Cities with the Highest Percentage of Immigrants from Philippines in Florida
RELATED REPORTS & OPTIONS
Philippines
Florida
Compare Cities
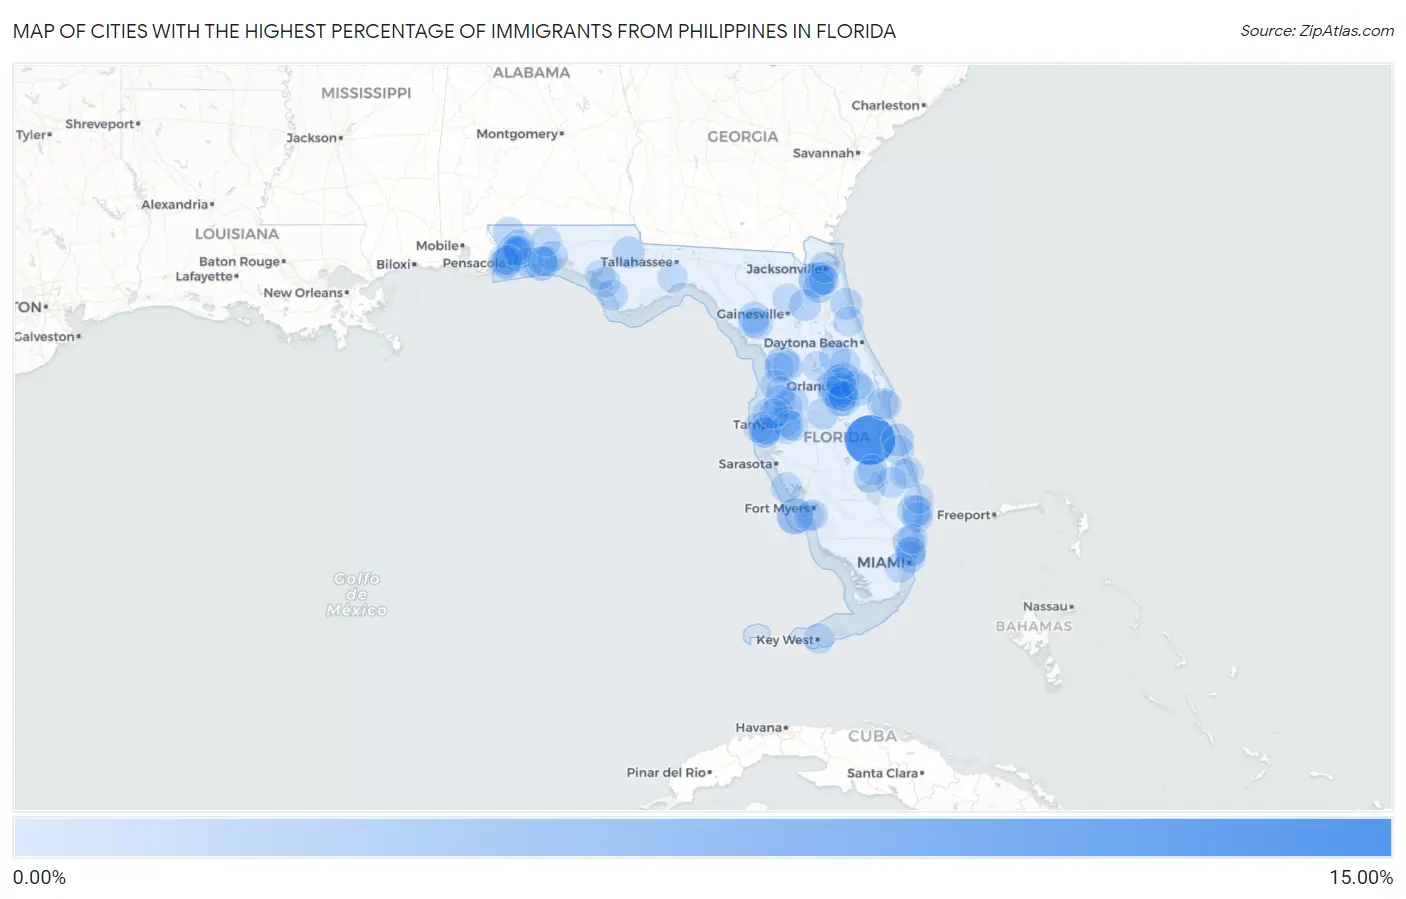
Map of Cities with the Highest Percentage of Immigrants from Philippines in Florida
0.00%
15.00%
Cities with the Highest Percentage of Immigrants from Philippines in Florida
| City | Philippines | vs State | vs National | |
| 1. | Yeehaw Junction | 13.43% | 0.39%(+13.0)#-1 | 0.60%(+12.8)#0 |
| 2. | Pine Ridge Cdp Collier County | 6.22% | 0.39%(+5.83)#0 | 0.60%(+5.62)#1 |
| 3. | Captiva | 4.64% | 0.39%(+4.25)#1 | 0.60%(+4.04)#2 |
| 4. | Oakleaf Plantation | 4.17% | 0.39%(+3.78)#2 | 0.60%(+3.57)#3 |
| 5. | Mary Esther | 3.21% | 0.39%(+2.82)#3 | 0.60%(+2.61)#4 |
| 6. | Citrus Hills | 3.19% | 0.39%(+2.80)#4 | 0.60%(+2.59)#5 |
| 7. | Gotha | 2.93% | 0.39%(+2.54)#5 | 0.60%(+2.33)#6 |
| 8. | Buckhead Ridge | 2.53% | 0.39%(+2.14)#6 | 0.60%(+1.93)#7 |
| 9. | Atlantis | 2.43% | 0.39%(+2.04)#7 | 0.60%(+1.83)#8 |
| 10. | Wedgefield | 2.40% | 0.39%(+2.01)#8 | 0.60%(+1.80)#9 |
| 11. | Indian River Shores | 2.34% | 0.39%(+1.95)#9 | 0.60%(+1.74)#10 |
| 12. | Broadview Park | 2.29% | 0.39%(+1.90)#10 | 0.60%(+1.69)#11 |
| 13. | Bellair Meadowbrook Terrace | 2.27% | 0.39%(+1.88)#11 | 0.60%(+1.67)#12 |
| 14. | Fern Park | 2.19% | 0.39%(+1.80)#12 | 0.60%(+1.59)#13 |
| 15. | Buenaventura Lakes | 2.12% | 0.39%(+1.73)#13 | 0.60%(+1.52)#14 |
| 16. | Pine Castle | 2.05% | 0.39%(+1.66)#14 | 0.60%(+1.45)#15 |
| 17. | South Highpoint | 1.97% | 0.39%(+1.58)#15 | 0.60%(+1.37)#16 |
| 18. | Bay Hill | 1.97% | 0.39%(+1.58)#16 | 0.60%(+1.37)#17 |
| 19. | Edgewood | 1.97% | 0.39%(+1.58)#17 | 0.60%(+1.37)#18 |
| 20. | Avalon | 1.93% | 0.39%(+1.54)#18 | 0.60%(+1.33)#19 |
| 21. | Altha | 1.90% | 0.39%(+1.51)#19 | 0.60%(+1.31)#20 |
| 22. | Pasadena Hills | 1.87% | 0.39%(+1.47)#20 | 0.60%(+1.27)#21 |
| 23. | Keystone Heights | 1.86% | 0.39%(+1.47)#21 | 0.60%(+1.26)#22 |
| 24. | Myrtle Grove | 1.85% | 0.39%(+1.46)#22 | 0.60%(+1.25)#23 |
| 25. | St Augustine Shores | 1.74% | 0.39%(+1.35)#23 | 0.60%(+1.14)#24 |
| 26. | South Palm Beach | 1.64% | 0.39%(+1.25)#24 | 0.60%(+1.04)#25 |
| 27. | Fanning Springs | 1.62% | 0.39%(+1.23)#25 | 0.60%(+1.02)#26 |
| 28. | Asbury Lake | 1.59% | 0.39%(+1.20)#26 | 0.60%(+0.990)#27 |
| 29. | Lake Alfred | 1.57% | 0.39%(+1.18)#27 | 0.60%(+0.972)#28 |
| 30. | Connerton | 1.55% | 0.39%(+1.16)#28 | 0.60%(+0.951)#29 |
| 31. | Brownsdale | 1.54% | 0.39%(+1.15)#29 | 0.60%(+0.943)#30 |
| 32. | Lake Kathryn | 1.53% | 0.39%(+1.14)#30 | 0.60%(+0.931)#31 |
| 33. | Bagdad | 1.49% | 0.39%(+1.10)#31 | 0.60%(+0.891)#32 |
| 34. | Chiefland | 1.49% | 0.39%(+1.10)#32 | 0.60%(+0.888)#33 |
| 35. | East Lake Orient Park | 1.48% | 0.39%(+1.09)#33 | 0.60%(+0.884)#34 |
| 36. | Point Baker | 1.36% | 0.39%(+0.974)#34 | 0.60%(+0.765)#35 |
| 37. | Rainbow Lakes Estates | 1.35% | 0.39%(+0.961)#35 | 0.60%(+0.752)#36 |
| 38. | Mexico Beach | 1.33% | 0.39%(+0.938)#36 | 0.60%(+0.729)#37 |
| 39. | Miami Shores | 1.31% | 0.39%(+0.925)#37 | 0.60%(+0.715)#38 |
| 40. | Lockhart | 1.29% | 0.39%(+0.902)#38 | 0.60%(+0.692)#39 |
| 41. | Merritt Island | 1.29% | 0.39%(+0.901)#53 | 0.60%(+0.692)#1,141 |
| 42. | Callaway | 1.28% | 0.39%(+0.888)#54 | 0.60%(+0.679)#1,142 |
| 43. | Jacksonville | 1.28% | 0.39%(+0.886)#64 | 0.60%(+0.677)#1,221 |
| 44. | Cypress Lake | 1.28% | 0.39%(+0.885)#65 | 0.60%(+0.675)#1,222 |
| 45. | Southchase | 1.27% | 0.39%(+0.881)#66 | 0.60%(+0.672)#1,223 |
| 46. | Kissimmee | 1.21% | 0.39%(+0.823)#67 | 0.60%(+0.613)#1,224 |
| 47. | North Miami Beach | 1.20% | 0.39%(+0.812)#68 | 0.60%(+0.602)#1,225 |
| 48. | Inverness | 1.20% | 0.39%(+0.807)#69 | 0.60%(+0.597)#1,226 |
| 49. | Indiantown | 1.19% | 0.39%(+0.803)#70 | 0.60%(+0.593)#1,227 |
| 50. | North Merritt Island | 1.18% | 0.39%(+0.794)#71 | 0.60%(+0.585)#1,228 |
| 51. | Pace | 1.16% | 0.39%(+0.771)#72 | 0.60%(+0.562)#1,229 |
| 52. | Manatee Road | 1.16% | 0.39%(+0.765)#73 | 0.60%(+0.556)#1,230 |
| 53. | Williamsburg | 1.10% | 0.39%(+0.710)#74 | 0.60%(+0.500)#1,231 |
| 54. | Bellview | 1.10% | 0.39%(+0.708)#75 | 0.60%(+0.499)#1,232 |
| 55. | Shalimar | 1.09% | 0.39%(+0.699)#76 | 0.60%(+0.490)#1,233 |
| 56. | Sunset | 1.08% | 0.39%(+0.691)#77 | 0.60%(+0.481)#1,234 |
| 57. | West Pensacola | 1.07% | 0.39%(+0.683)#78 | 0.60%(+0.473)#1,235 |
| 58. | Progress Village | 1.07% | 0.39%(+0.680)#79 | 0.60%(+0.470)#1,236 |
| 59. | Niceville | 1.07% | 0.39%(+0.679)#80 | 0.60%(+0.470)#1,237 |
| 60. | Gulf Stream | 1.06% | 0.39%(+0.671)#81 | 0.60%(+0.462)#1,238 |
| 61. | Englewood | 1.05% | 0.39%(+0.663)#82 | 0.60%(+0.453)#1,239 |
| 62. | East Lake | 1.03% | 0.39%(+0.639)#83 | 0.60%(+0.429)#1,240 |
| 63. | Okeechobee | 1.02% | 0.39%(+0.625)#84 | 0.60%(+0.415)#1,241 |
| 64. | Milton | 1.00% | 0.39%(+0.614)#85 | 0.60%(+0.405)#1,242 |
| 65. | Cheval | 0.99% | 0.39%(+0.596)#86 | 0.60%(+0.386)#1,243 |
| 66. | Bithlo | 0.98% | 0.39%(+0.588)#87 | 0.60%(+0.378)#1,244 |
| 67. | Navarre | 0.97% | 0.39%(+0.583)#88 | 0.60%(+0.374)#1,245 |
| 68. | Kenneth City | 0.97% | 0.39%(+0.582)#89 | 0.60%(+0.372)#1,246 |
| 69. | Meadow Woods | 0.96% | 0.39%(+0.569)#90 | 0.60%(+0.360)#1,247 |
| 70. | Crestview | 0.96% | 0.39%(+0.569)#91 | 0.60%(+0.359)#1,248 |
| 71. | Lakewood Park | 0.94% | 0.39%(+0.552)#92 | 0.60%(+0.342)#1,249 |
| 72. | Orange Park | 0.94% | 0.39%(+0.549)#93 | 0.60%(+0.340)#1,250 |
| 73. | West Lealman | 0.92% | 0.39%(+0.527)#94 | 0.60%(+0.318)#1,251 |
| 74. | Silver Lake | 0.91% | 0.39%(+0.521)#95 | 0.60%(+0.312)#1,252 |
| 75. | Debary | 0.91% | 0.39%(+0.515)#96 | 0.60%(+0.306)#1,253 |
| 76. | Lynn Haven | 0.90% | 0.39%(+0.511)#97 | 0.60%(+0.301)#1,254 |
| 77. | Wesley Chapel | 0.89% | 0.39%(+0.504)#98 | 0.60%(+0.294)#1,255 |
| 78. | Lecanto | 0.89% | 0.39%(+0.503)#99 | 0.60%(+0.294)#1,256 |
| 79. | Patrick Afb | 0.87% | 0.39%(+0.482)#100 | 0.60%(+0.272)#1,257 |
| 80. | Fairview Shores | 0.84% | 0.39%(+0.445)#101 | 0.60%(+0.236)#1,258 |
| 81. | Crawfordville | 0.84% | 0.39%(+0.445)#102 | 0.60%(+0.235)#1,259 |
| 82. | Ojus | 0.83% | 0.39%(+0.443)#103 | 0.60%(+0.233)#1,260 |
| 83. | Pea Ridge | 0.82% | 0.39%(+0.433)#104 | 0.60%(+0.224)#1,261 |
| 84. | Brooker | 0.82% | 0.39%(+0.433)#105 | 0.60%(+0.223)#1,262 |
| 85. | Palm Coast | 0.81% | 0.39%(+0.425)#106 | 0.60%(+0.215)#1,263 |
| 86. | Key West | 0.80% | 0.39%(+0.411)#107 | 0.60%(+0.202)#1,264 |
| 87. | Brandon | 0.80% | 0.39%(+0.408)#108 | 0.60%(+0.198)#1,265 |
| 88. | North Weeki Wachee | 0.80% | 0.39%(+0.407)#109 | 0.60%(+0.197)#1,266 |
| 89. | Brent | 0.80% | 0.39%(+0.407)#110 | 0.60%(+0.197)#1,267 |
| 90. | Wilton Manors | 0.79% | 0.39%(+0.396)#111 | 0.60%(+0.186)#1,268 |
| 91. | Sewall S Point | 0.78% | 0.39%(+0.390)#112 | 0.60%(+0.181)#1,269 |
| 92. | Iona | 0.78% | 0.39%(+0.386)#113 | 0.60%(+0.177)#1,270 |
| 93. | Garden Grove | 0.77% | 0.39%(+0.383)#114 | 0.60%(+0.173)#1,271 |
| 94. | Indian Rocks Beach | 0.76% | 0.39%(+0.369)#115 | 0.60%(+0.159)#1,272 |
| 95. | Palm City | 0.75% | 0.39%(+0.361)#116 | 0.60%(+0.152)#1,273 |
| 96. | Pinellas Park | 0.75% | 0.39%(+0.356)#117 | 0.60%(+0.146)#1,274 |
| 97. | Valrico | 0.74% | 0.39%(+0.351)#118 | 0.60%(+0.141)#1,275 |
| 98. | Palm Beach Shores | 0.74% | 0.39%(+0.349)#119 | 0.60%(+0.140)#1,276 |
| 99. | Keystone | 0.74% | 0.39%(+0.347)#120 | 0.60%(+0.137)#1,277 |
| 100. | Wright | 0.73% | 0.39%(+0.344)#121 | 0.60%(+0.135)#1,278 |
Common Questions
What are the Top 10 Cities with the Highest Percentage of Immigrants from Philippines in Florida?
Top 10 Cities with the Highest Percentage of Immigrants from Philippines in Florida are:
#1
13.43%
#2
4.64%
#3
4.17%
#4
3.21%
#5
3.19%
#6
2.93%
#7
2.53%
#8
2.43%
#9
2.40%
#10
2.34%
What city has the Highest Percentage of Immigrants from Philippines in Florida?
Yeehaw Junction has the Highest Percentage of Immigrants from Philippines in Florida with 13.43%.
What is the Percentage of Immigrants from Philippines in the State of Florida?
Percentage of Immigrants from Philippines in Florida is 0.39%.
What is the Percentage of Immigrants from Philippines in the United States?
Percentage of Immigrants from Philippines in the United States is 0.60%.