Waldorf, MD
Waldorf Map
Waldorf Overview
81,077
TOTAL POPULATION
37,948
MALE POPULATION
43,129
FEMALE POPULATION
87.99
MALES / 100 FEMALES
113.65
FEMALES / 100 MALES
36.3
MEDIAN AGE
3.2
AVG FAMILY SIZE
2.7
AVG HOUSEHOLD SIZE
$46,663
PER CAPITA INCOME
$123,252
AVG FAMILY INCOME
$111,454
AVG HOUSEHOLD INCOME
14.9%
WAGE / INCOME GAP [ % ]
85.1¢/ $1
WAGE / INCOME GAP [ $ ]
$13,027
FAMILY INCOME DEFICIT
0.37
INEQUALITY / GINI INDEX
46,905
LABOR FORCE [ PEOPLE ]
73.6%
PERCENT IN LABOR FORCE
5.8%
UNEMPLOYMENT RATE
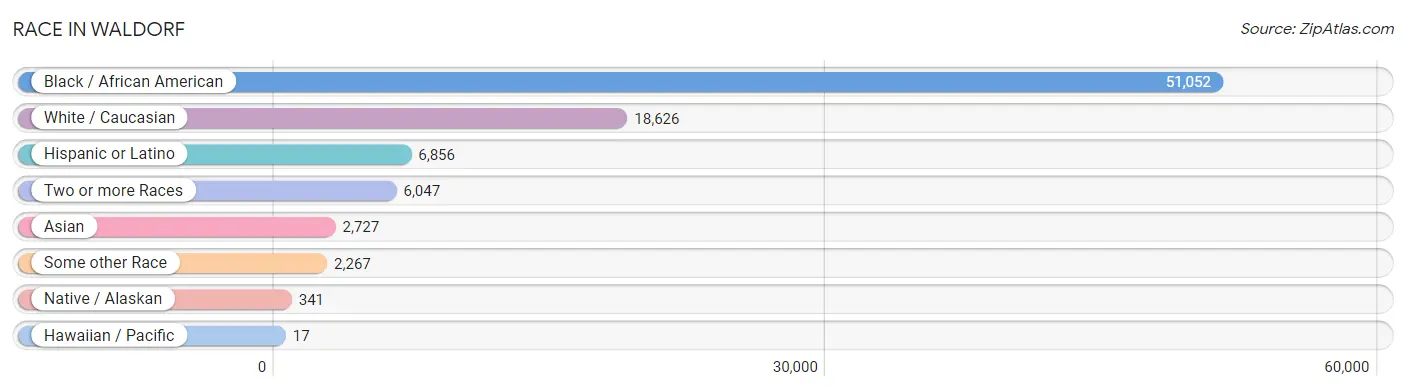
Race in Waldorf
The most populous races in Waldorf are Black / African American (51,052 | 63.0%), White / Caucasian (18,626 | 23.0%), and Hispanic or Latino (6,856 | 8.5%).
| Race | # Population | % Population |
| Asian | 2,727 | 3.4% |
| Black / African American | 51,052 | 63.0% |
| Hawaiian / Pacific | 17 | 0.0% |
| Hispanic or Latino | 6,856 | 8.5% |
| Native / Alaskan | 341 | 0.4% |
| White / Caucasian | 18,626 | 23.0% |
| Two or more Races | 6,047 | 7.5% |
| Some other Race | 2,267 | 2.8% |
| Total | 81,077 | 100.0% |
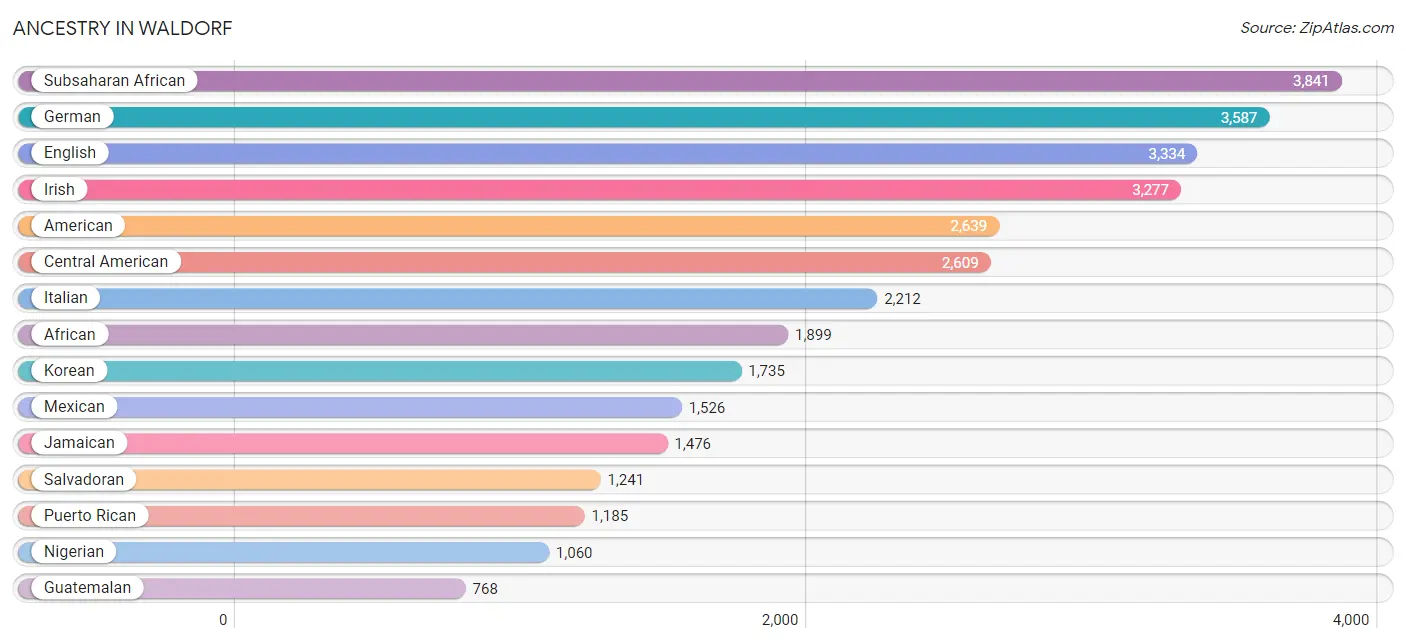
Ancestry in Waldorf
The most populous ancestries reported in Waldorf are Subsaharan African (3,841 | 4.7%), German (3,587 | 4.4%), English (3,334 | 4.1%), Irish (3,277 | 4.0%), and American (2,639 | 3.3%), together accounting for 20.6% of all Waldorf residents.
| Ancestry | # Population | % Population |
| African | 1,899 | 2.3% |
| American | 2,639 | 3.3% |
| Apache | 5 | 0.0% |
| Arab | 191 | 0.2% |
| Armenian | 9 | 0.0% |
| Barbadian | 21 | 0.0% |
| Bermudan | 135 | 0.2% |
| Bhutanese | 227 | 0.3% |
| Blackfeet | 283 | 0.4% |
| Brazilian | 91 | 0.1% |
| British | 201 | 0.3% |
| British West Indian | 46 | 0.1% |
| Bulgarian | 42 | 0.1% |
| Burmese | 231 | 0.3% |
| Canadian | 30 | 0.0% |
| Celtic | 14 | 0.0% |
| Central American | 2,609 | 3.2% |
| Central American Indian | 139 | 0.2% |
| Cherokee | 242 | 0.3% |
| Chilean | 1 | 0.0% |
| Choctaw | 13 | 0.0% |
| Colombian | 437 | 0.5% |
| Comanche | 10 | 0.0% |
| Costa Rican | 30 | 0.0% |
| Cree | 16 | 0.0% |
| Croatian | 16 | 0.0% |
| Cuban | 35 | 0.0% |
| Czech | 82 | 0.1% |
| Danish | 20 | 0.0% |
| Delaware | 187 | 0.2% |
| Dominican | 469 | 0.6% |
| Dutch | 383 | 0.5% |
| Eastern European | 22 | 0.0% |
| English | 3,334 | 4.1% |
| Ethiopian | 289 | 0.4% |
| European | 470 | 0.6% |
| Filipino | 99 | 0.1% |
| Finnish | 56 | 0.1% |
| French | 514 | 0.6% |
| French American Indian | 30 | 0.0% |
| French Canadian | 63 | 0.1% |
| German | 3,587 | 4.4% |
| Ghanaian | 83 | 0.1% |
| Greek | 218 | 0.3% |
| Guamanian / Chamorro | 4 | 0.0% |
| Guatemalan | 768 | 0.9% |
| Guyanese | 88 | 0.1% |
| Haitian | 259 | 0.3% |
| Honduran | 249 | 0.3% |
| Hungarian | 170 | 0.2% |
| Indian (Asian) | 435 | 0.5% |
| Iranian | 42 | 0.1% |
| Iraqi | 99 | 0.1% |
| Irish | 3,277 | 4.0% |
| Iroquois | 8 | 0.0% |
| Israeli | 2 | 0.0% |
| Italian | 2,212 | 2.7% |
| Jamaican | 1,476 | 1.8% |
| Japanese | 78 | 0.1% |
| Korean | 1,735 | 2.1% |
| Laotian | 13 | 0.0% |
| Lebanese | 28 | 0.0% |
| Liberian | 26 | 0.0% |
| Lithuanian | 28 | 0.0% |
| Mexican | 1,526 | 1.9% |
| Mexican American Indian | 14 | 0.0% |
| Moroccan | 64 | 0.1% |
| Native Hawaiian | 48 | 0.1% |
| Navajo | 61 | 0.1% |
| Nicaraguan | 13 | 0.0% |
| Nigerian | 1,060 | 1.3% |
| Northern European | 57 | 0.1% |
| Norwegian | 165 | 0.2% |
| Pakistani | 59 | 0.1% |
| Panamanian | 305 | 0.4% |
| Peruvian | 281 | 0.4% |
| Polish | 455 | 0.6% |
| Portuguese | 50 | 0.1% |
| Puerto Rican | 1,185 | 1.5% |
| Russian | 104 | 0.1% |
| Salvadoran | 1,241 | 1.5% |
| Scandinavian | 32 | 0.0% |
| Scotch-Irish | 171 | 0.2% |
| Scottish | 383 | 0.5% |
| Senegalese | 15 | 0.0% |
| Serbian | 50 | 0.1% |
| Sierra Leonean | 270 | 0.3% |
| Sioux | 29 | 0.0% |
| Slovak | 34 | 0.0% |
| South American | 719 | 0.9% |
| South American Indian | 86 | 0.1% |
| Spaniard | 100 | 0.1% |
| Spanish | 28 | 0.0% |
| Sri Lankan | 185 | 0.2% |
| Subsaharan African | 3,841 | 4.7% |
| Swedish | 52 | 0.1% |
| Swiss | 53 | 0.1% |
| Thai | 308 | 0.4% |
| Trinidadian and Tobagonian | 188 | 0.2% |
| U.S. Virgin Islander | 25 | 0.0% |
| Ukrainian | 218 | 0.3% |
| Vietnamese | 61 | 0.1% |
| Welsh | 250 | 0.3% |
| West Indian | 134 | 0.2% | View All 104 Rows |
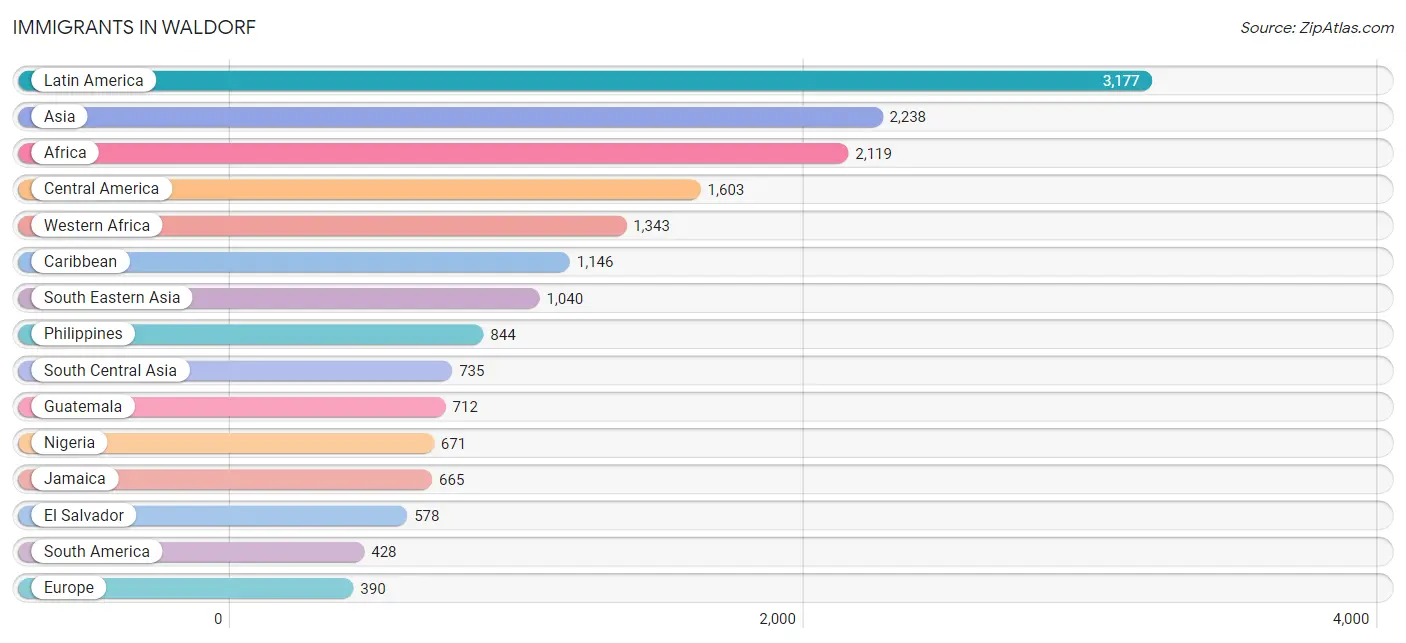
Immigrants in Waldorf
The most numerous immigrant groups reported in Waldorf came from Latin America (3,177 | 3.9%), Asia (2,238 | 2.8%), Africa (2,119 | 2.6%), Central America (1,603 | 2.0%), and Western Africa (1,343 | 1.7%), together accounting for 12.9% of all Waldorf residents.
| Immigration Origin | # Population | % Population |
| Africa | 2,119 | 2.6% |
| Asia | 2,238 | 2.8% |
| Bangladesh | 41 | 0.1% |
| Brazil | 26 | 0.0% |
| Bulgaria | 39 | 0.1% |
| Cambodia | 53 | 0.1% |
| Cameroon | 178 | 0.2% |
| Caribbean | 1,146 | 1.4% |
| Central America | 1,603 | 2.0% |
| China | 152 | 0.2% |
| Colombia | 76 | 0.1% |
| Cuba | 2 | 0.0% |
| Dominican Republic | 217 | 0.3% |
| Eastern Africa | 199 | 0.3% |
| Eastern Asia | 297 | 0.4% |
| Eastern Europe | 51 | 0.1% |
| El Salvador | 578 | 0.7% |
| England | 49 | 0.1% |
| Ethiopia | 146 | 0.2% |
| Europe | 390 | 0.5% |
| France | 4 | 0.0% |
| Germany | 82 | 0.1% |
| Ghana | 101 | 0.1% |
| Guatemala | 712 | 0.9% |
| Guyana | 75 | 0.1% |
| Haiti | 76 | 0.1% |
| Honduras | 32 | 0.0% |
| India | 151 | 0.2% |
| Indonesia | 7 | 0.0% |
| Iraq | 99 | 0.1% |
| Ireland | 10 | 0.0% |
| Israel | 2 | 0.0% |
| Italy | 52 | 0.1% |
| Jamaica | 665 | 0.8% |
| Japan | 29 | 0.0% |
| Kenya | 35 | 0.0% |
| Korea | 116 | 0.1% |
| Latin America | 3,177 | 3.9% |
| Liberia | 182 | 0.2% |
| Malaysia | 13 | 0.0% |
| Mexico | 256 | 0.3% |
| Middle Africa | 178 | 0.2% |
| Morocco | 64 | 0.1% |
| Nepal | 173 | 0.2% |
| Nigeria | 671 | 0.8% |
| Northern Africa | 64 | 0.1% |
| Northern Europe | 164 | 0.2% |
| Pakistan | 370 | 0.5% |
| Panama | 25 | 0.0% |
| Peru | 180 | 0.2% |
| Philippines | 844 | 1.0% |
| Poland | 6 | 0.0% |
| Sierra Leone | 260 | 0.3% |
| Somalia | 18 | 0.0% |
| South America | 428 | 0.5% |
| South Central Asia | 735 | 0.9% |
| South Eastern Asia | 1,040 | 1.3% |
| Southern Europe | 89 | 0.1% |
| Spain | 37 | 0.1% |
| Taiwan | 21 | 0.0% |
| Thailand | 13 | 0.0% |
| Trinidad and Tobago | 112 | 0.1% |
| Ukraine | 6 | 0.0% |
| Venezuela | 71 | 0.1% |
| Vietnam | 110 | 0.1% |
| West Indies | 28 | 0.0% |
| Western Africa | 1,343 | 1.7% |
| Western Asia | 166 | 0.2% |
| Western Europe | 86 | 0.1% | View All 69 Rows |
Sex and Age in Waldorf
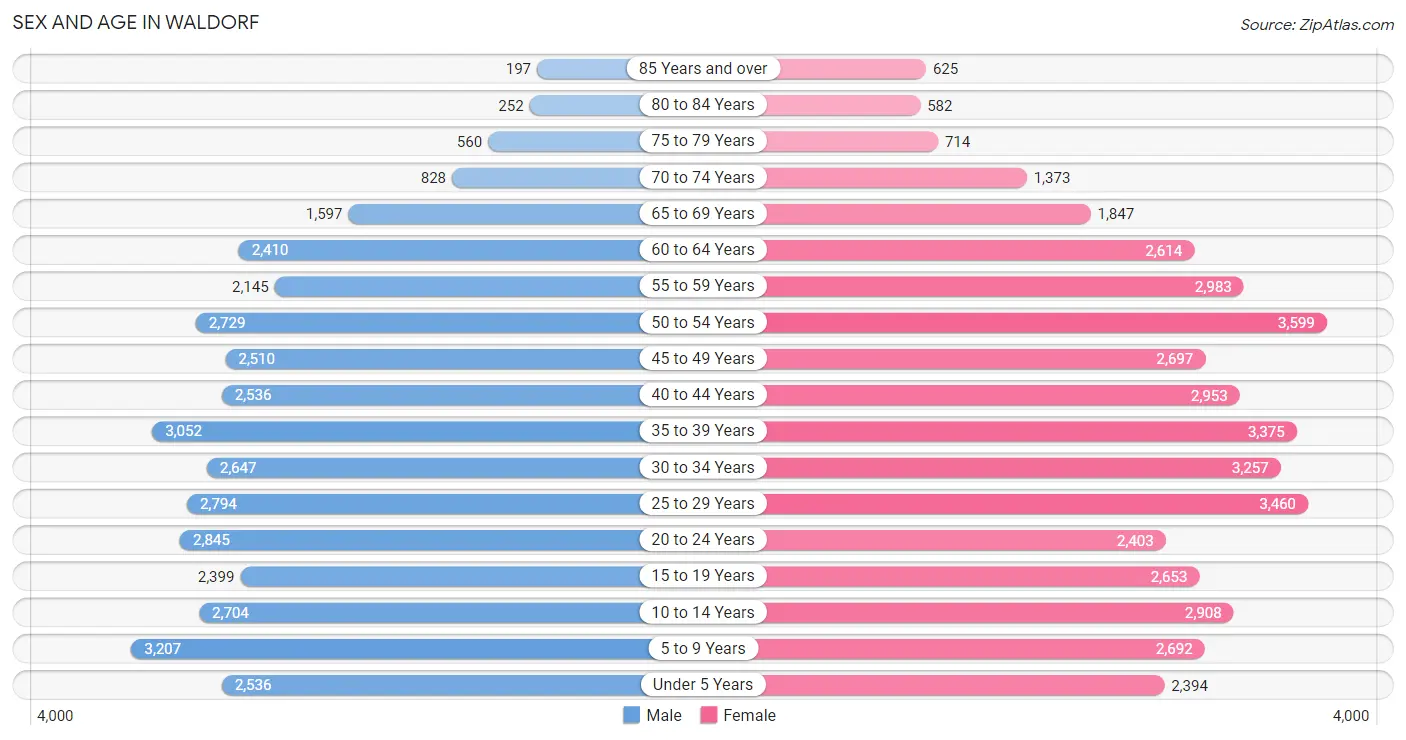
Sex and Age in Waldorf
The most populous age groups in Waldorf are 5 to 9 Years (3,207 | 8.5%) for men and 50 to 54 Years (3,599 | 8.3%) for women.
| Age Bracket | Male | Female |
| Under 5 Years | 2,536 (6.7%) | 2,394 (5.6%) |
| 5 to 9 Years | 3,207 (8.5%) | 2,692 (6.2%) |
| 10 to 14 Years | 2,704 (7.1%) | 2,908 (6.7%) |
| 15 to 19 Years | 2,399 (6.3%) | 2,653 (6.1%) |
| 20 to 24 Years | 2,845 (7.5%) | 2,403 (5.6%) |
| 25 to 29 Years | 2,794 (7.4%) | 3,460 (8.0%) |
| 30 to 34 Years | 2,647 (7.0%) | 3,257 (7.5%) |
| 35 to 39 Years | 3,052 (8.0%) | 3,375 (7.8%) |
| 40 to 44 Years | 2,536 (6.7%) | 2,953 (6.9%) |
| 45 to 49 Years | 2,510 (6.6%) | 2,697 (6.2%) |
| 50 to 54 Years | 2,729 (7.2%) | 3,599 (8.3%) |
| 55 to 59 Years | 2,145 (5.7%) | 2,983 (6.9%) |
| 60 to 64 Years | 2,410 (6.4%) | 2,614 (6.1%) |
| 65 to 69 Years | 1,597 (4.2%) | 1,847 (4.3%) |
| 70 to 74 Years | 828 (2.2%) | 1,373 (3.2%) |
| 75 to 79 Years | 560 (1.5%) | 714 (1.7%) |
| 80 to 84 Years | 252 (0.7%) | 582 (1.3%) |
| 85 Years and over | 197 (0.5%) | 625 (1.5%) |
| Total | 37,948 (100.0%) | 43,129 (100.0%) |
Families and Households in Waldorf
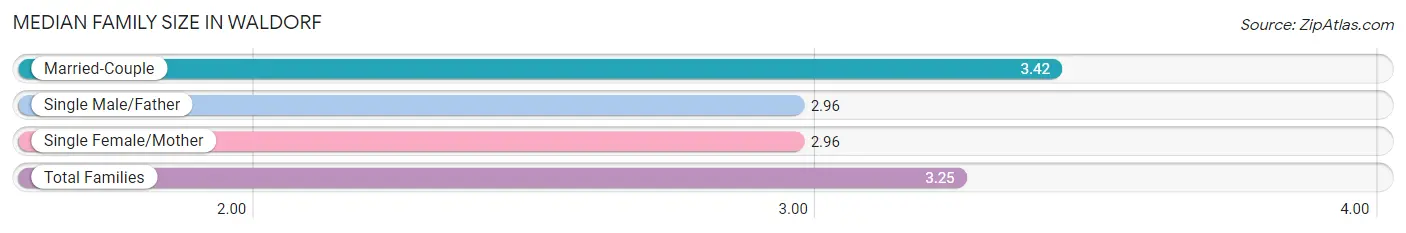
Median Family Size in Waldorf
The median family size in Waldorf is 3.25 persons per family, with married-couple families (13,128 | 63.1%) accounting for the largest median family size of 3.42 persons per family. On the other hand, single male/father families (1,684 | 8.1%) represent the smallest median family size with 2.96 persons per family.
| Family Type | # Families | Family Size |
| Married-Couple | 13,128 (63.1%) | 3.42 |
| Single Male/Father | 1,684 (8.1%) | 2.96 |
| Single Female/Mother | 5,978 (28.7%) | 2.96 |
| Total Families | 20,790 (100.0%) | 3.25 |
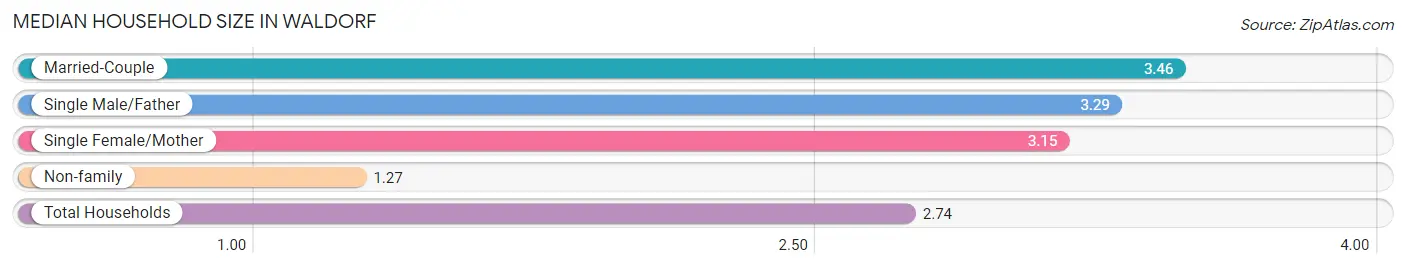
Median Household Size in Waldorf
The median household size in Waldorf is 2.74 persons per household, with married-couple households (13,128 | 44.5%) accounting for the largest median household size of 3.46 persons per household. non-family households (8,690 | 29.5%) represent the smallest median household size with 1.27 persons per household.
| Household Type | # Households | Household Size |
| Married-Couple | 13,128 (44.5%) | 3.46 |
| Single Male/Father | 1,684 (5.7%) | 3.29 |
| Single Female/Mother | 5,978 (20.3%) | 3.15 |
| Non-family | 8,690 (29.5%) | 1.27 |
| Total Households | 29,480 (100.0%) | 2.74 |
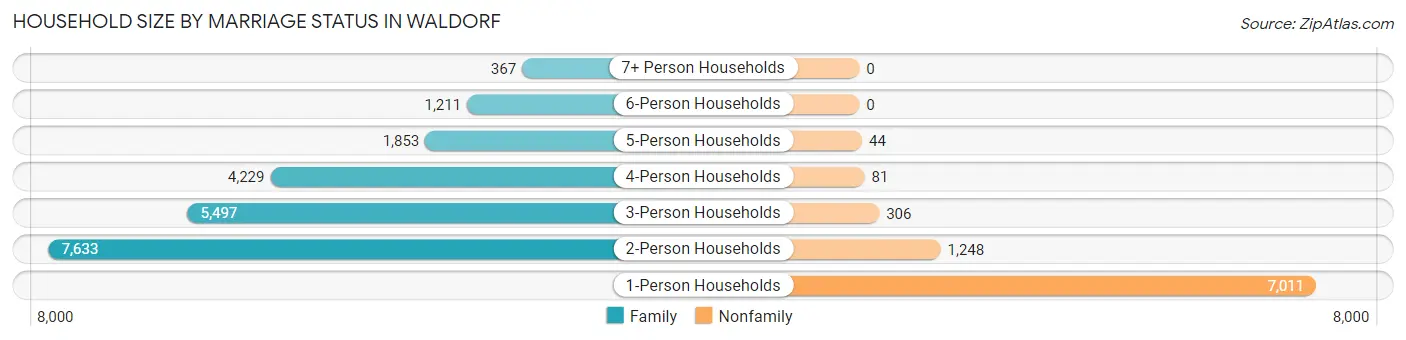
Household Size by Marriage Status in Waldorf
Out of a total of 29,480 households in Waldorf, 20,790 (70.5%) are family households, while 8,690 (29.5%) are nonfamily households. The most numerous type of family households are 2-person households, comprising 7,633, and the most common type of nonfamily households are 1-person households, comprising 7,011.
| Household Size | Family Households | Nonfamily Households |
| 1-Person Households | - | 7,011 (23.8%) |
| 2-Person Households | 7,633 (25.9%) | 1,248 (4.2%) |
| 3-Person Households | 5,497 (18.6%) | 306 (1.0%) |
| 4-Person Households | 4,229 (14.3%) | 81 (0.3%) |
| 5-Person Households | 1,853 (6.3%) | 44 (0.2%) |
| 6-Person Households | 1,211 (4.1%) | 0 (0.0%) |
| 7+ Person Households | 367 (1.2%) | 0 (0.0%) |
| Total | 20,790 (70.5%) | 8,690 (29.5%) |
Female Fertility in Waldorf
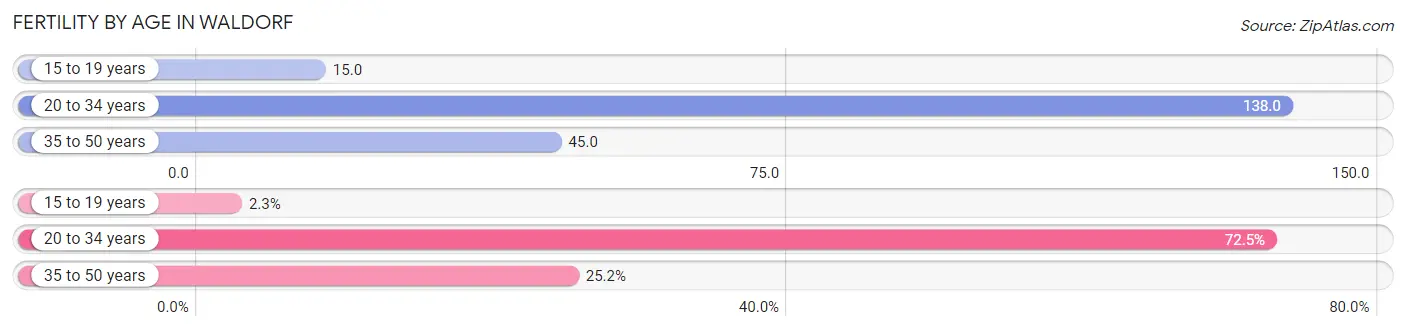
Fertility by Age in Waldorf
Average fertility rate in Waldorf is 81.0 births per 1,000 women. Women in the age bracket of 20 to 34 years have the highest fertility rate with 138.0 births per 1,000 women. Women in the age bracket of 20 to 34 years acount for 72.5% of all women with births.
| Age Bracket | Women with Births | Births / 1,000 Women |
| 15 to 19 years | 40 (2.3%) | 15.0 |
| 20 to 34 years | 1,263 (72.5%) | 138.0 |
| 35 to 50 years | 438 (25.2%) | 45.0 |
| Total | 1,741 (100.0%) | 81.0 |
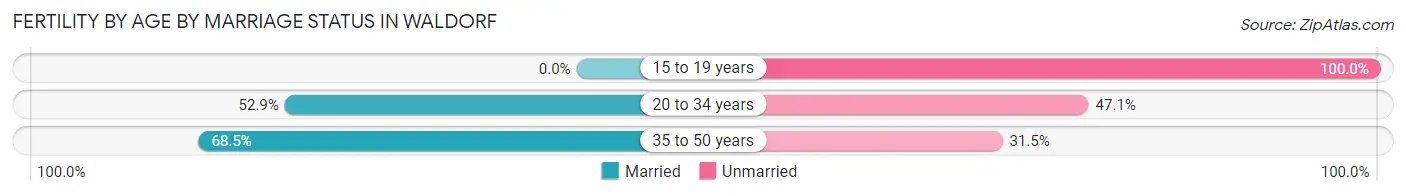
Fertility by Age by Marriage Status in Waldorf
55.6% of women with births (1,741) in Waldorf are married. The highest percentage of unmarried women with births falls into 15 to 19 years age bracket with 100.0% of them unmarried at the time of birth, while the lowest percentage of unmarried women with births belong to 35 to 50 years age bracket with 31.5% of them unmarried.
| Age Bracket | Married | Unmarried |
| 15 to 19 years | 0 (0.0%) | 40 (100.0%) |
| 20 to 34 years | 668 (52.9%) | 595 (47.1%) |
| 35 to 50 years | 300 (68.5%) | 138 (31.5%) |
| Total | 968 (55.6%) | 773 (44.4%) |
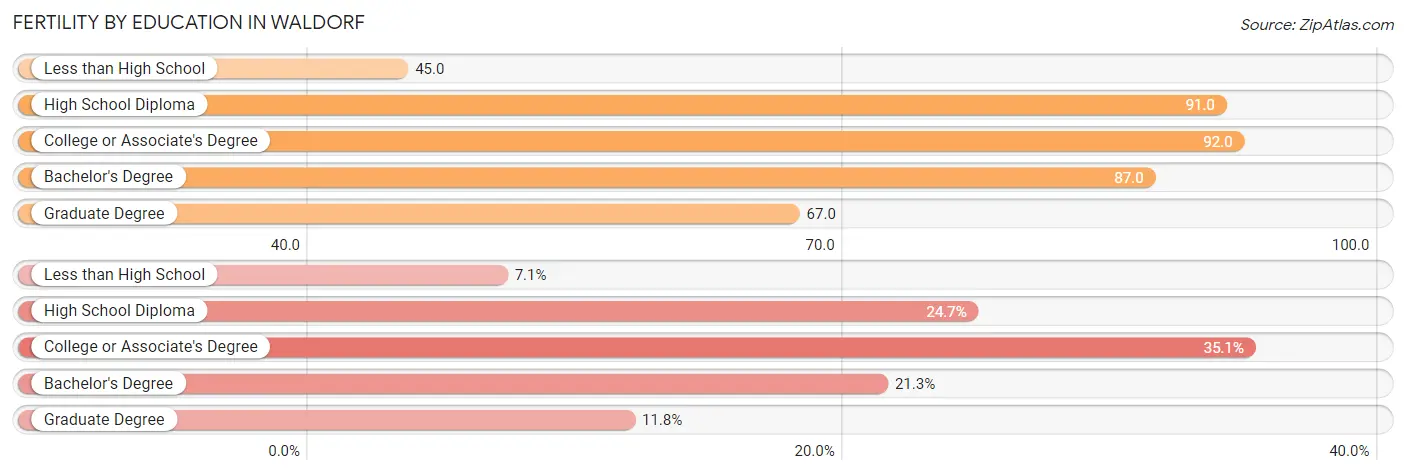
Fertility by Education in Waldorf
Average fertility rate in Waldorf is 81.0 births per 1,000 women. Women with the education attainment of college or associate's degree have the highest fertility rate of 92.0 births per 1,000 women, while women with the education attainment of less than high school have the lowest fertility at 45.0 births per 1,000 women. Women with the education attainment of college or associate's degree represent 35.1% of all women with births.
| Educational Attainment | Women with Births | Births / 1,000 Women |
| Less than High School | 123 (7.1%) | 45.0 |
| High School Diploma | 430 (24.7%) | 91.0 |
| College or Associate's Degree | 611 (35.1%) | 92.0 |
| Bachelor's Degree | 371 (21.3%) | 87.0 |
| Graduate Degree | 206 (11.8%) | 67.0 |
| Total | 1,741 (100.0%) | 81.0 |
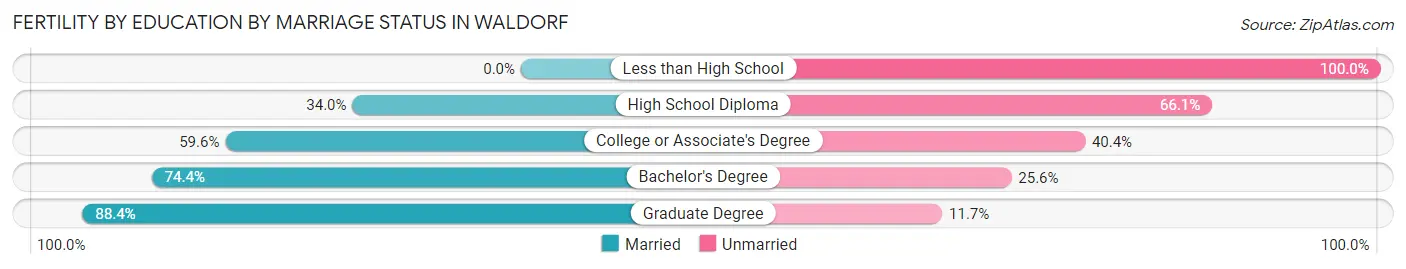
Fertility by Education by Marriage Status in Waldorf
44.4% of women with births in Waldorf are unmarried. Women with the educational attainment of graduate degree are most likely to be married with 88.3% of them married at childbirth, while women with the educational attainment of less than high school are least likely to be married with 100.0% of them unmarried at childbirth.
| Educational Attainment | Married | Unmarried |
| Less than High School | 0 (0.0%) | 123 (100.0%) |
| High School Diploma | 146 (34.0%) | 284 (66.0%) |
| College or Associate's Degree | 364 (59.6%) | 247 (40.4%) |
| Bachelor's Degree | 276 (74.4%) | 95 (25.6%) |
| Graduate Degree | 182 (88.3%) | 24 (11.7%) |
| Total | 968 (55.6%) | 773 (44.4%) |
Income in Waldorf
Income Overview in Waldorf
Per Capita Income in Waldorf is $46,663, while median incomes of families and households are $123,252 and $111,454 respectively.
| Characteristic | Number | Measure |
| Per Capita Income | 81,077 | $46,663 |
| Median Family Income | 20,790 | $123,252 |
| Mean Family Income | 20,790 | $140,274 |
| Median Household Income | 29,480 | $111,454 |
| Mean Household Income | 29,480 | $126,860 |
| Income Deficit | 20,790 | $13,027 |
| Wage / Income Gap (%) | 81,077 | 14.95% |
| Wage / Income Gap ($) | 81,077 | 85.05¢ per $1 |
| Gini / Inequality Index | 81,077 | 0.37 |
Earnings by Sex in Waldorf
Average Earnings in Waldorf are $57,366, $63,415 for men and $53,937 for women, a difference of 14.9%.
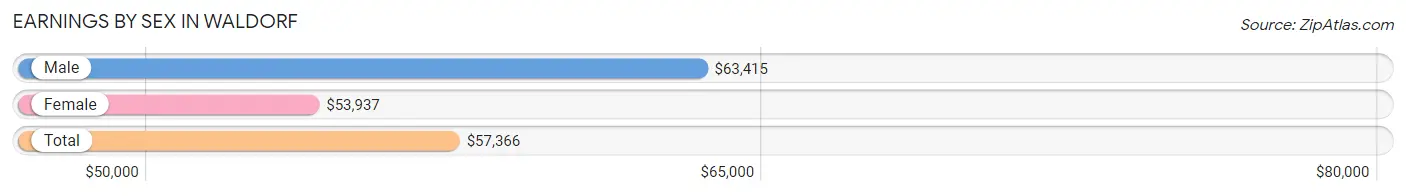
| Sex | Number | Average Earnings |
| Male | 22,900 (48.4%) | $63,415 |
| Female | 24,396 (51.6%) | $53,937 |
| Total | 47,296 (100.0%) | $57,366 |
Earnings by Sex by Income Bracket in Waldorf
The most common earnings brackets in Waldorf are $100,000+ for men (5,527 | 24.1%) and $100,000+ for women (5,355 | 22.0%).
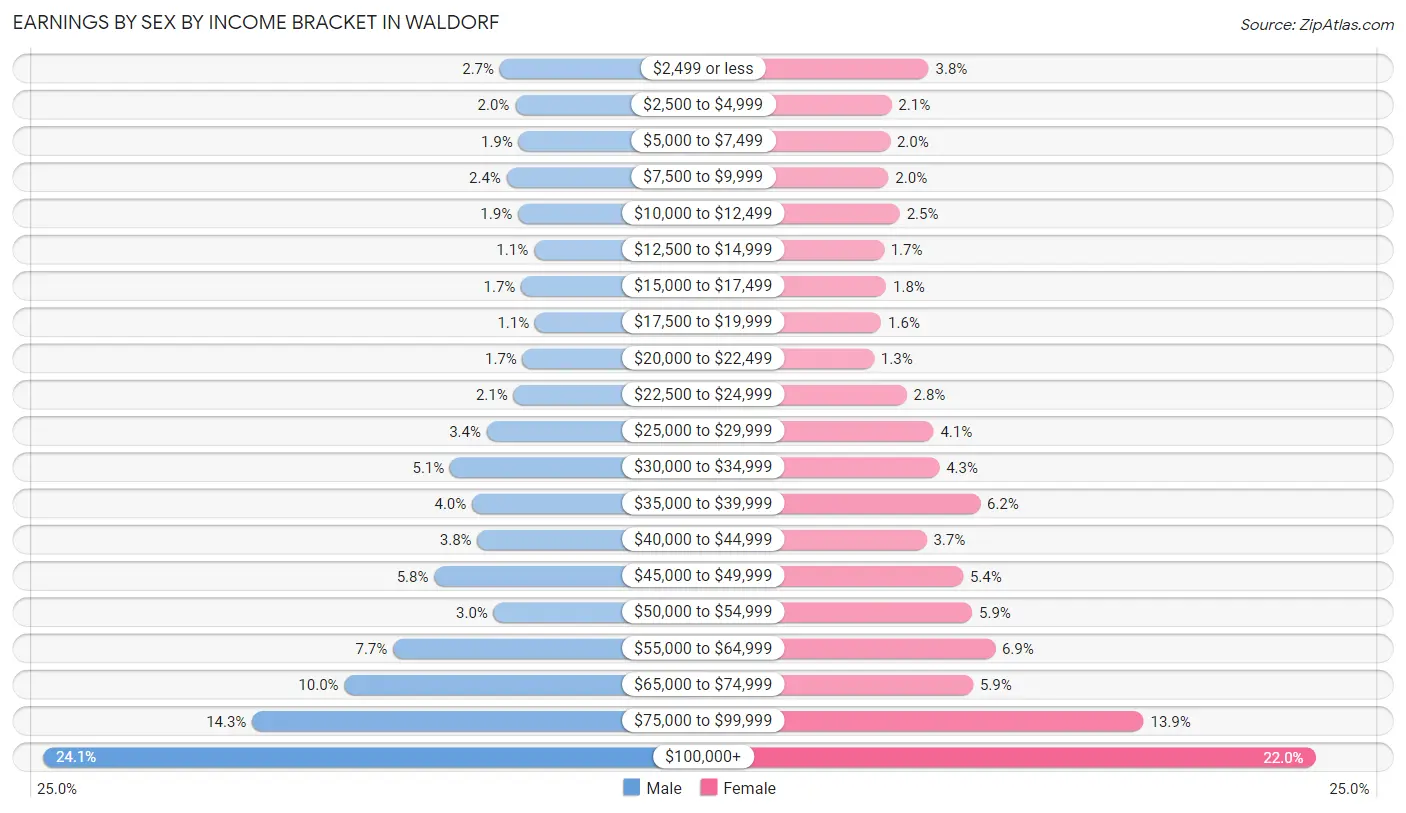
| Income | Male | Female |
| $2,499 or less | 628 (2.7%) | 934 (3.8%) |
| $2,500 to $4,999 | 463 (2.0%) | 511 (2.1%) |
| $5,000 to $7,499 | 425 (1.9%) | 494 (2.0%) |
| $7,500 to $9,999 | 554 (2.4%) | 476 (1.9%) |
| $10,000 to $12,499 | 433 (1.9%) | 605 (2.5%) |
| $12,500 to $14,999 | 262 (1.1%) | 423 (1.7%) |
| $15,000 to $17,499 | 398 (1.7%) | 448 (1.8%) |
| $17,500 to $19,999 | 249 (1.1%) | 393 (1.6%) |
| $20,000 to $22,499 | 382 (1.7%) | 310 (1.3%) |
| $22,500 to $24,999 | 481 (2.1%) | 684 (2.8%) |
| $25,000 to $29,999 | 767 (3.4%) | 990 (4.1%) |
| $30,000 to $34,999 | 1,160 (5.1%) | 1,057 (4.3%) |
| $35,000 to $39,999 | 926 (4.0%) | 1,522 (6.2%) |
| $40,000 to $44,999 | 867 (3.8%) | 911 (3.7%) |
| $45,000 to $49,999 | 1,331 (5.8%) | 1,327 (5.4%) |
| $50,000 to $54,999 | 695 (3.0%) | 1,431 (5.9%) |
| $55,000 to $64,999 | 1,772 (7.7%) | 1,693 (6.9%) |
| $65,000 to $74,999 | 2,295 (10.0%) | 1,442 (5.9%) |
| $75,000 to $99,999 | 3,285 (14.3%) | 3,390 (13.9%) |
| $100,000+ | 5,527 (24.1%) | 5,355 (22.0%) |
| Total | 22,900 (100.0%) | 24,396 (100.0%) |
Earnings by Sex by Educational Attainment in Waldorf
Average earnings in Waldorf are $70,287 for men and $58,744 for women, a difference of 16.4%. Men with an educational attainment of graduate degree enjoy the highest average annual earnings of $109,334, while those with less than high school education earn the least with $41,844. Women with an educational attainment of graduate degree earn the most with the average annual earnings of $90,693, while those with less than high school education have the smallest earnings of $21,731.
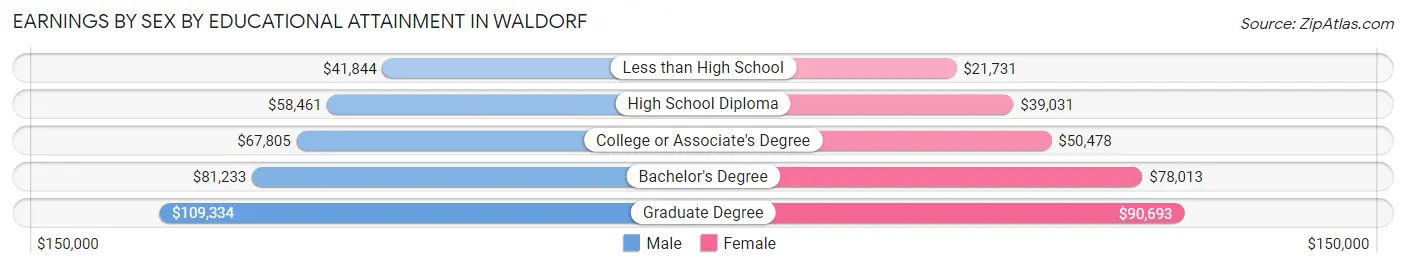
| Educational Attainment | Male Income | Female Income |
| Less than High School | $41,844 | $21,731 |
| High School Diploma | $58,461 | $39,031 |
| College or Associate's Degree | $67,805 | $50,478 |
| Bachelor's Degree | $81,233 | $78,013 |
| Graduate Degree | $109,334 | $90,693 |
| Total | $70,287 | $58,744 |
Family Income in Waldorf
Family Income Brackets in Waldorf
According to the Waldorf family income data, there are 5,281 families falling into the $100,000 to $149,999 income range, which is the most common income bracket and makes up 25.4% of all families. Conversely, the $10,000 to $14,999 income bracket is the least frequent group with only 125 families (0.6%) belonging to this category.
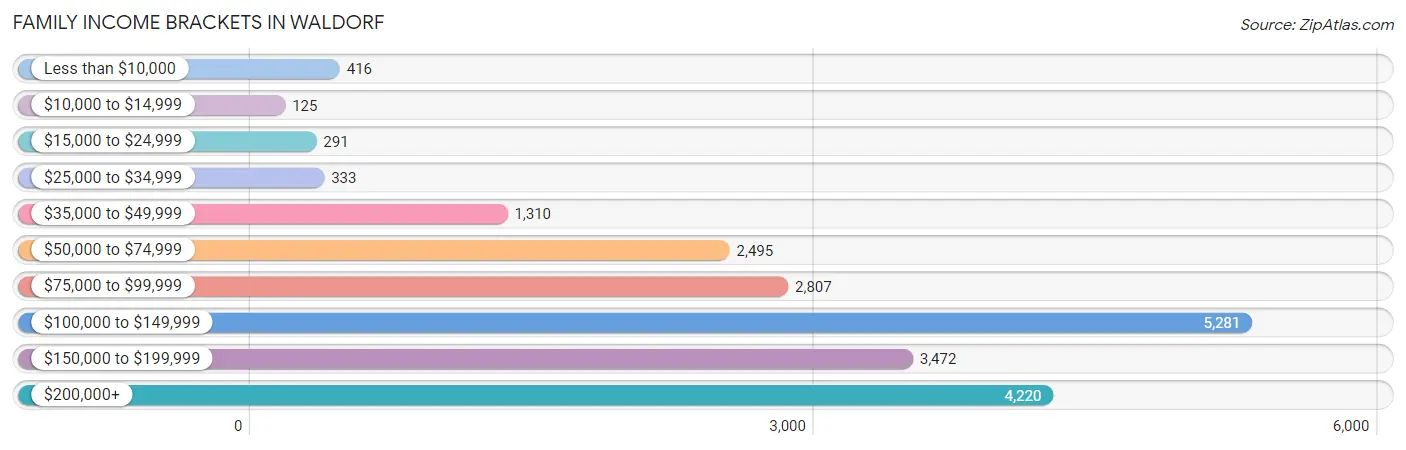
| Income Bracket | # Families | % Families |
| Less than $10,000 | 416 | 2.0% |
| $10,000 to $14,999 | 125 | 0.6% |
| $15,000 to $24,999 | 291 | 1.4% |
| $25,000 to $34,999 | 333 | 1.6% |
| $35,000 to $49,999 | 1,310 | 6.3% |
| $50,000 to $74,999 | 2,495 | 12.0% |
| $75,000 to $99,999 | 2,807 | 13.5% |
| $100,000 to $149,999 | 5,281 | 25.4% |
| $150,000 to $199,999 | 3,472 | 16.7% |
| $200,000+ | 4,220 | 20.3% |
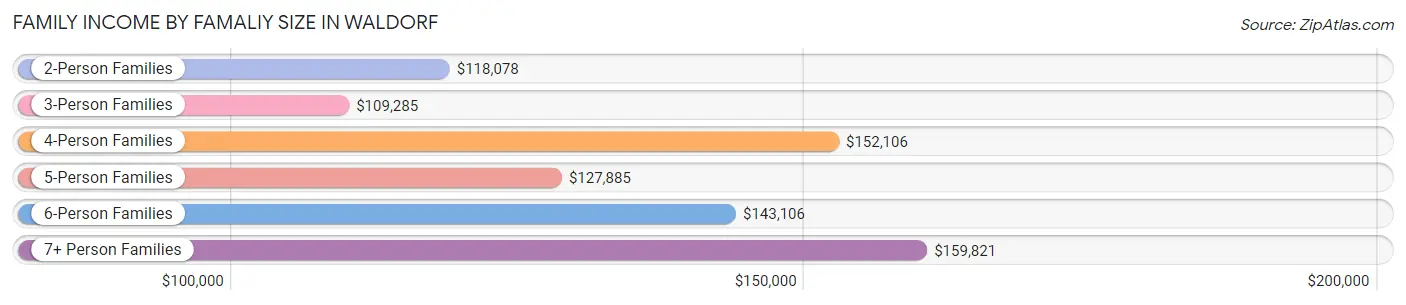
Family Income by Famaliy Size in Waldorf
7+ person families (335 | 1.6%) account for the highest median family income in Waldorf with $159,821 per family, while 2-person families (8,303 | 39.9%) have the highest median income of $59,039 per family member.
| Income Bracket | # Families | Median Income |
| 2-Person Families | 8,303 (39.9%) | $118,078 |
| 3-Person Families | 5,713 (27.5%) | $109,285 |
| 4-Person Families | 3,607 (17.3%) | $152,106 |
| 5-Person Families | 1,766 (8.5%) | $127,885 |
| 6-Person Families | 1,066 (5.1%) | $143,106 |
| 7+ Person Families | 335 (1.6%) | $159,821 |
| Total | 20,790 (100.0%) | $123,252 |
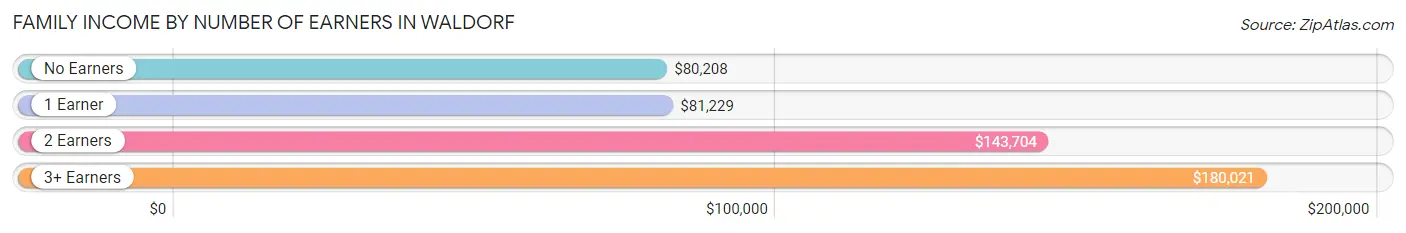
Family Income by Number of Earners in Waldorf
The median family income in Waldorf is $123,252, with families comprising 3+ earners (3,107) having the highest median family income of $180,021, while families with no earners (1,270) have the lowest median family income of $80,208, accounting for 14.9% and 6.1% of families, respectively.
| Number of Earners | # Families | Median Income |
| No Earners | 1,270 (6.1%) | $80,208 |
| 1 Earner | 6,943 (33.4%) | $81,229 |
| 2 Earners | 9,470 (45.6%) | $143,704 |
| 3+ Earners | 3,107 (14.9%) | $180,021 |
| Total | 20,790 (100.0%) | $123,252 |
Household Income in Waldorf
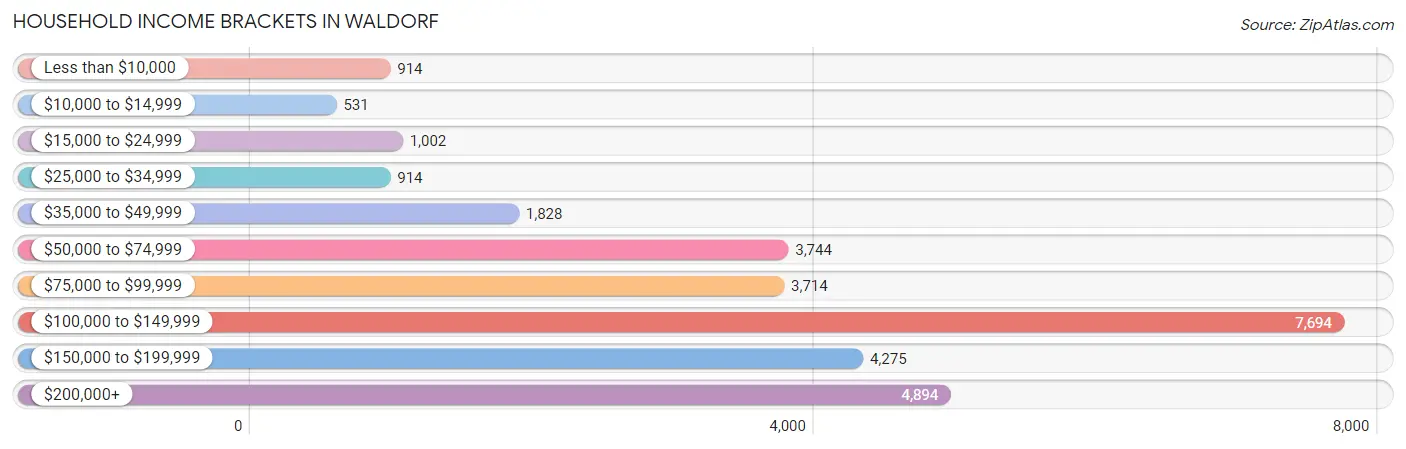
Household Income Brackets in Waldorf
With 7,694 households falling in the category, the $100,000 to $149,999 income range is the most frequent in Waldorf, accounting for 26.1% of all households. In contrast, only 531 households (1.8%) fall into the $10,000 to $14,999 income bracket, making it the least populous group.
| Income Bracket | # Households | % Households |
| Less than $10,000 | 914 | 3.1% |
| $10,000 to $14,999 | 531 | 1.8% |
| $15,000 to $24,999 | 1,002 | 3.4% |
| $25,000 to $34,999 | 914 | 3.1% |
| $35,000 to $49,999 | 1,828 | 6.2% |
| $50,000 to $74,999 | 3,744 | 12.7% |
| $75,000 to $99,999 | 3,714 | 12.6% |
| $100,000 to $149,999 | 7,694 | 26.1% |
| $150,000 to $199,999 | 4,275 | 14.5% |
| $200,000+ | 4,894 | 16.6% |
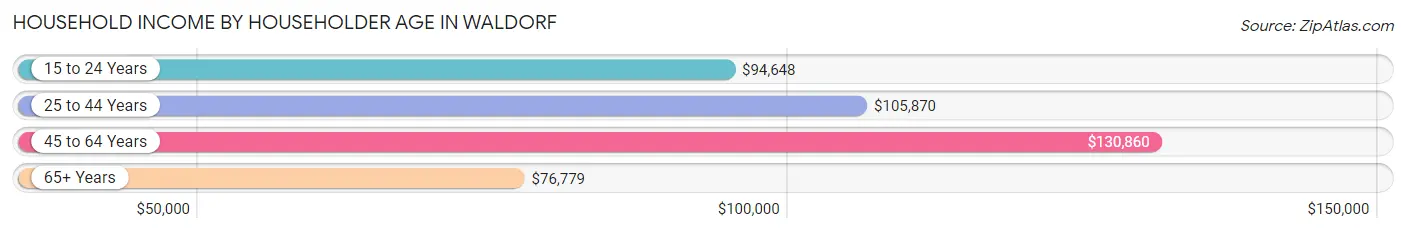
Household Income by Householder Age in Waldorf
The median household income in Waldorf is $111,454, with the highest median household income of $130,860 found in the 45 to 64 years age bracket for the primary householder. A total of 13,162 households (44.7%) fall into this category. Meanwhile, the 65+ years age bracket for the primary householder has the lowest median household income of $76,779, with 4,732 households (16.1%) in this group.
| Income Bracket | # Households | Median Income |
| 15 to 24 Years | 572 (1.9%) | $94,648 |
| 25 to 44 Years | 11,014 (37.4%) | $105,870 |
| 45 to 64 Years | 13,162 (44.7%) | $130,860 |
| 65+ Years | 4,732 (16.1%) | $76,779 |
| Total | 29,480 (100.0%) | $111,454 |
Poverty in Waldorf
Income Below Poverty by Sex and Age in Waldorf
With 5.2% poverty level for males and 6.2% for females among the residents of Waldorf, under 5 year old males and 75 year old and over females are the most vulnerable to poverty, with 297 males (12.0%) and 340 females (18.5%) in their respective age groups living below the poverty level.
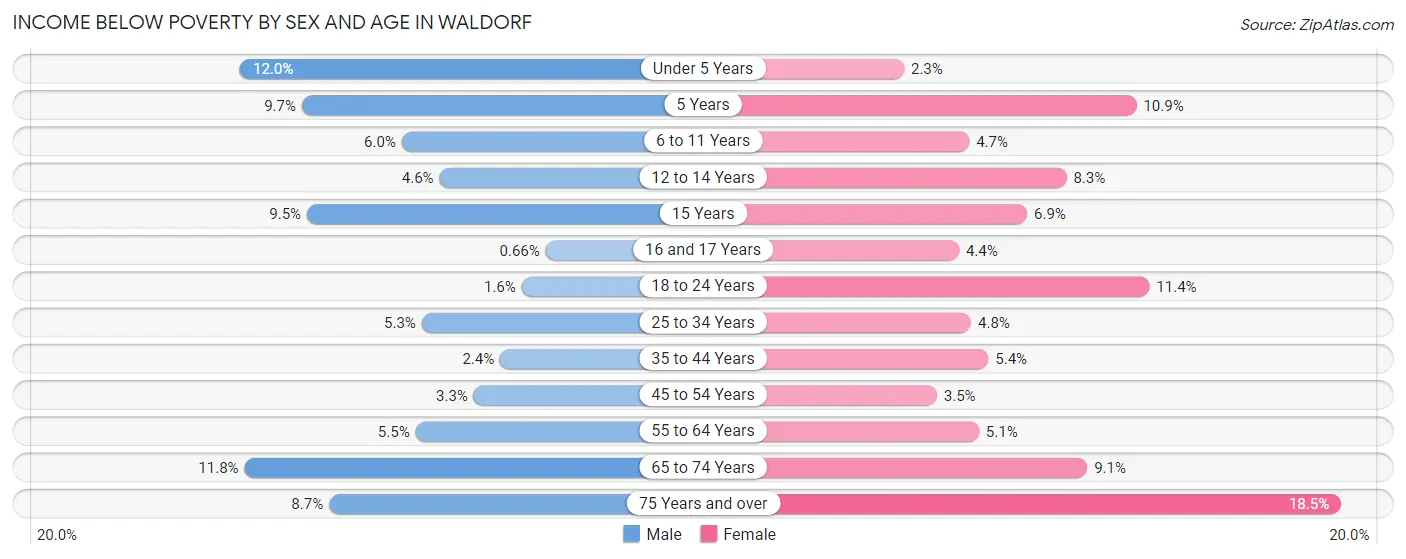
| Age Bracket | Male | Female |
| Under 5 Years | 297 (12.0%) | 55 (2.3%) |
| 5 Years | 43 (9.7%) | 36 (10.9%) |
| 6 to 11 Years | 224 (6.0%) | 171 (4.7%) |
| 12 to 14 Years | 77 (4.6%) | 134 (8.3%) |
| 15 Years | 42 (9.5%) | 32 (6.9%) |
| 16 and 17 Years | 7 (0.7%) | 58 (4.3%) |
| 18 to 24 Years | 58 (1.5%) | 372 (11.4%) |
| 25 to 34 Years | 286 (5.3%) | 322 (4.8%) |
| 35 to 44 Years | 131 (2.4%) | 344 (5.4%) |
| 45 to 54 Years | 174 (3.3%) | 222 (3.5%) |
| 55 to 64 Years | 250 (5.5%) | 284 (5.1%) |
| 65 to 74 Years | 287 (11.8%) | 293 (9.1%) |
| 75 Years and over | 87 (8.7%) | 340 (18.5%) |
| Total | 1,963 (5.2%) | 2,663 (6.2%) |
Income Above Poverty by Sex and Age in Waldorf
According to the poverty statistics in Waldorf, males aged 16 and 17 years and females aged under 5 years are the age groups that are most secure financially, with 99.3% of males and 97.7% of females in these age groups living above the poverty line.
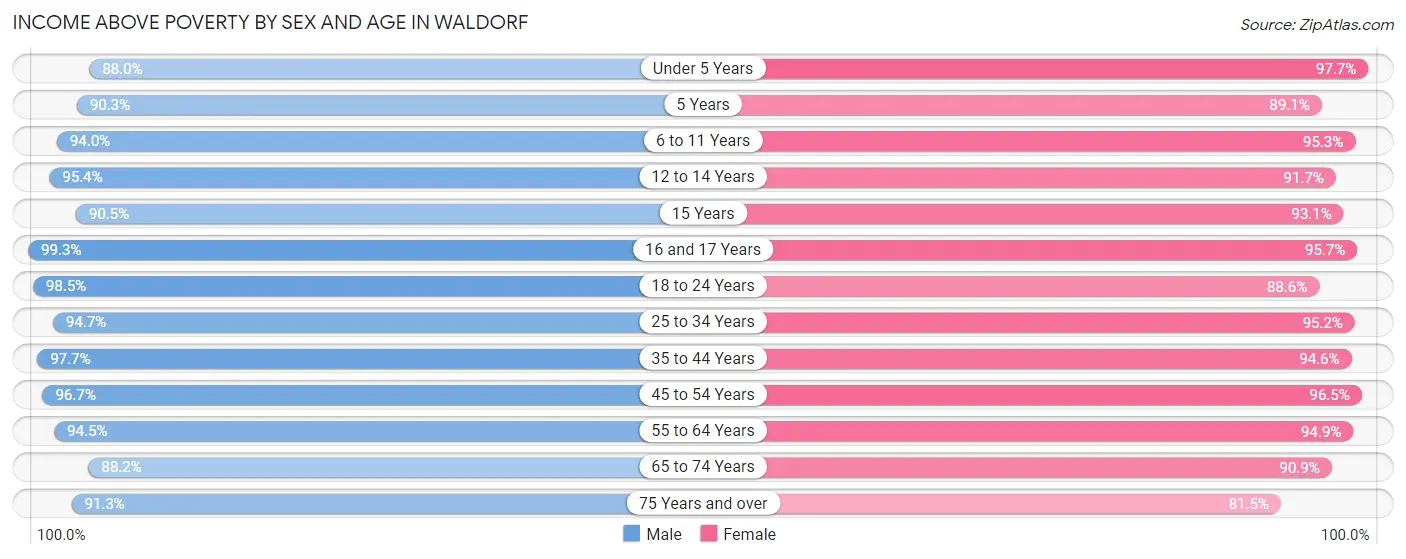
| Age Bracket | Male | Female |
| Under 5 Years | 2,177 (88.0%) | 2,329 (97.7%) |
| 5 Years | 400 (90.3%) | 293 (89.1%) |
| 6 to 11 Years | 3,510 (94.0%) | 3,442 (95.3%) |
| 12 to 14 Years | 1,597 (95.4%) | 1,472 (91.7%) |
| 15 Years | 399 (90.5%) | 433 (93.1%) |
| 16 and 17 Years | 1,054 (99.3%) | 1,276 (95.7%) |
| 18 to 24 Years | 3,684 (98.5%) | 2,885 (88.6%) |
| 25 to 34 Years | 5,155 (94.7%) | 6,391 (95.2%) |
| 35 to 44 Years | 5,450 (97.7%) | 5,984 (94.6%) |
| 45 to 54 Years | 5,058 (96.7%) | 6,071 (96.5%) |
| 55 to 64 Years | 4,300 (94.5%) | 5,296 (94.9%) |
| 65 to 74 Years | 2,138 (88.2%) | 2,923 (90.9%) |
| 75 Years and over | 913 (91.3%) | 1,495 (81.5%) |
| Total | 35,835 (94.8%) | 40,290 (93.8%) |
Income Below Poverty Among Married-Couple Families in Waldorf
The poverty statistics for married-couple families in Waldorf show that 1.2% or 155 of the total 13,128 families live below the poverty line. Families with 3 or 4 children have the highest poverty rate of 2.5%, comprising of 42 families. On the other hand, families with 5 or more children have the lowest poverty rate of 0.0%, which includes 0 families.
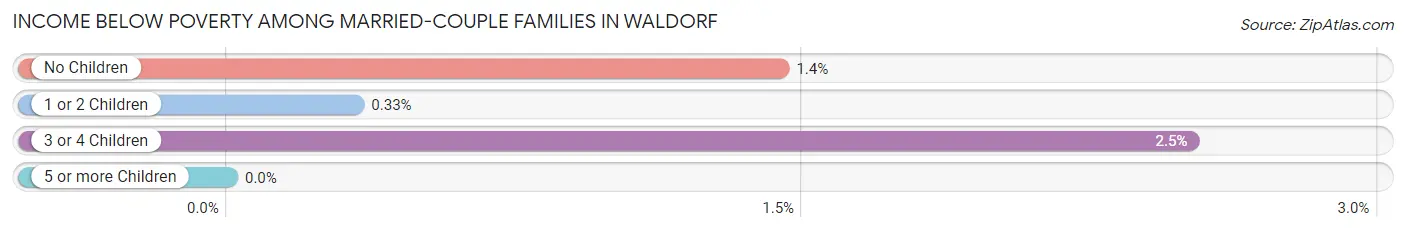
| Children | Above Poverty | Below Poverty |
| No Children | 6,719 (98.6%) | 98 (1.4%) |
| 1 or 2 Children | 4,589 (99.7%) | 15 (0.3%) |
| 3 or 4 Children | 1,630 (97.5%) | 42 (2.5%) |
| 5 or more Children | 35 (100.0%) | 0 (0.0%) |
| Total | 12,973 (98.8%) | 155 (1.2%) |
Income Below Poverty Among Single-Parent Households in Waldorf
According to the poverty data in Waldorf, 4.6% or 78 single-father households and 8.5% or 510 single-mother households are living below the poverty line. Among single-father households, those with 3 or 4 children have the highest poverty rate, with 23 households (14.5%) experiencing poverty. Likewise, among single-mother households, those with 3 or 4 children have the highest poverty rate, with 77 households (20.6%) falling below the poverty line.
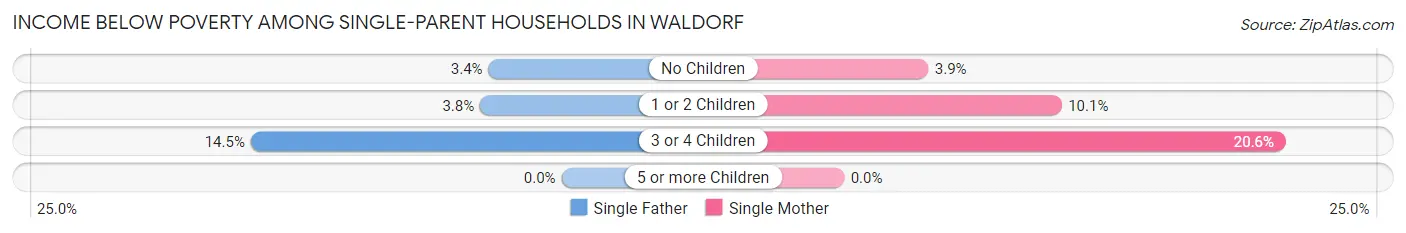
| Children | Single Father | Single Mother |
| No Children | 24 (3.4%) | 85 (3.9%) |
| 1 or 2 Children | 31 (3.8%) | 348 (10.1%) |
| 3 or 4 Children | 23 (14.5%) | 77 (20.6%) |
| 5 or more Children | 0 (0.0%) | 0 (0.0%) |
| Total | 78 (4.6%) | 510 (8.5%) |
Income Below Poverty Among Married-Couple vs Single-Parent Households in Waldorf
The poverty data for Waldorf shows that 155 of the married-couple family households (1.2%) and 588 of the single-parent households (7.7%) are living below the poverty level. Within the married-couple family households, those with 3 or 4 children have the highest poverty rate, with 42 households (2.5%) falling below the poverty line. Among the single-parent households, those with 3 or 4 children have the highest poverty rate, with 100 household (18.8%) living below poverty.
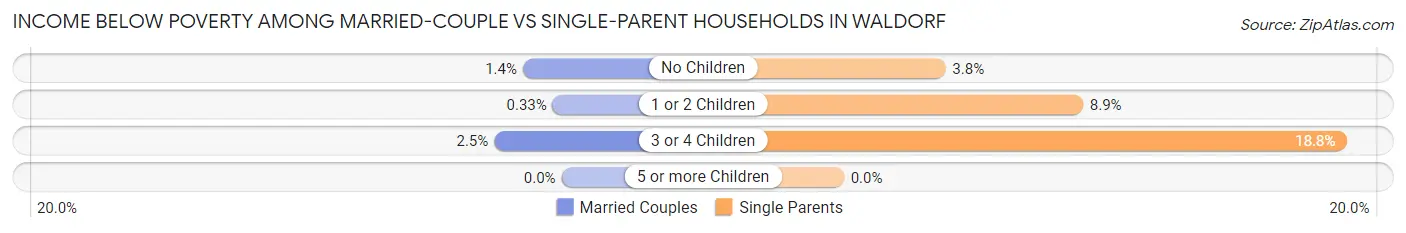
| Children | Married-Couple Families | Single-Parent Households |
| No Children | 98 (1.4%) | 109 (3.8%) |
| 1 or 2 Children | 15 (0.3%) | 379 (8.9%) |
| 3 or 4 Children | 42 (2.5%) | 100 (18.8%) |
| 5 or more Children | 0 (0.0%) | 0 (0.0%) |
| Total | 155 (1.2%) | 588 (7.7%) |
Employment Characteristics in Waldorf
Employment by Class of Employer in Waldorf
Among the 43,534 employed individuals in Waldorf, private company employees (21,818 | 50.1%), federal government employees (11,324 | 26.0%), and local government employees (3,743 | 8.6%) make up the most common classes of employment.
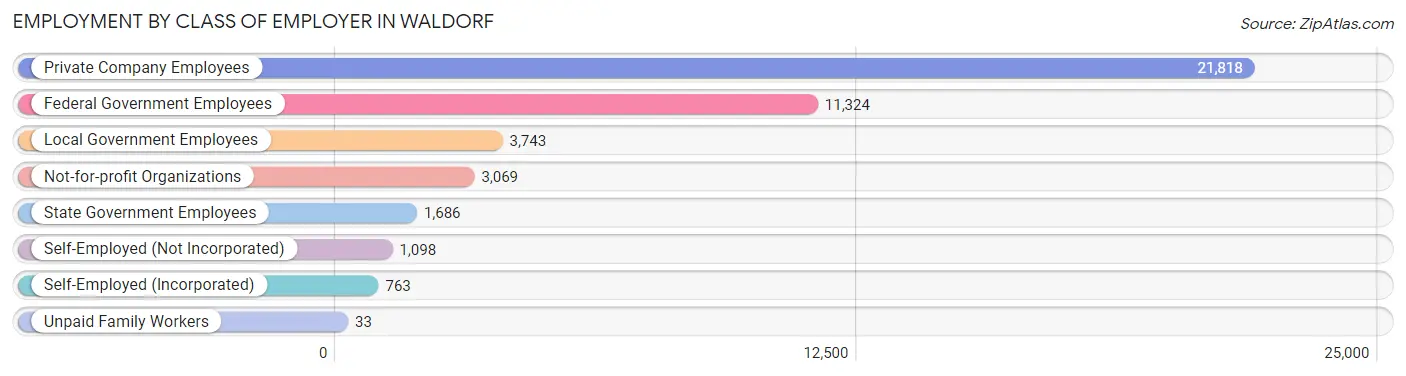
| Employer Class | # Employees | % Employees |
| Private Company Employees | 21,818 | 50.1% |
| Self-Employed (Incorporated) | 763 | 1.8% |
| Self-Employed (Not Incorporated) | 1,098 | 2.5% |
| Not-for-profit Organizations | 3,069 | 7.0% |
| Local Government Employees | 3,743 | 8.6% |
| State Government Employees | 1,686 | 3.9% |
| Federal Government Employees | 11,324 | 26.0% |
| Unpaid Family Workers | 33 | 0.1% |
| Total | 43,534 | 100.0% |
Employment Status by Age in Waldorf
According to the labor force statistics for Waldorf, out of the total population over 16 years of age (63,730), 73.6% or 46,905 individuals are in the labor force, with 5.8% or 2,720 of them unemployed. The age group with the highest labor force participation rate is 35 to 44 years, with 91.8% or 10,939 individuals in the labor force. Within the labor force, the 16 to 19 years age range has the highest percentage of unemployed individuals, with 30.8% or 478 of them being unemployed.
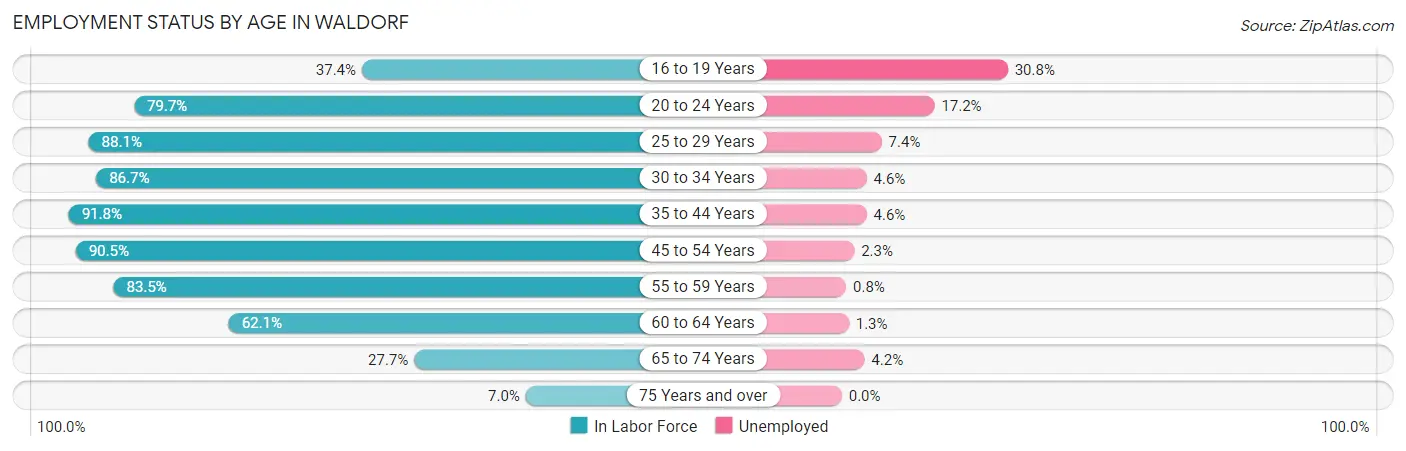
| Age Bracket | In Labor Force | Unemployed |
| 16 to 19 Years | 1,551 (37.4%) | 478 (30.8%) |
| 20 to 24 Years | 4,183 (79.7%) | 719 (17.2%) |
| 25 to 29 Years | 5,510 (88.1%) | 408 (7.4%) |
| 30 to 34 Years | 5,119 (86.7%) | 235 (4.6%) |
| 35 to 44 Years | 10,939 (91.8%) | 503 (4.6%) |
| 45 to 54 Years | 10,439 (90.5%) | 240 (2.3%) |
| 55 to 59 Years | 4,282 (83.5%) | 34 (0.8%) |
| 60 to 64 Years | 3,120 (62.1%) | 41 (1.3%) |
| 65 to 74 Years | 1,564 (27.7%) | 66 (4.2%) |
| 75 Years and over | 205 (7.0%) | 0 (0.0%) |
| Total | 46,905 (73.6%) | 2,720 (5.8%) |
Employment Status by Educational Attainment in Waldorf
According to labor force statistics for Waldorf, 86.2% of individuals (39,446) out of the total population between 25 and 64 years of age (45,761) are in the labor force, with 3.7% or 1,460 of them being unemployed. The group with the highest labor force participation rate are those with the educational attainment of bachelor's degree or higher, with 92.5% or 14,175 individuals in the labor force. Within the labor force, individuals with less than high school education have the highest percentage of unemployment, with 5.5% or 67 of them being unemployed.
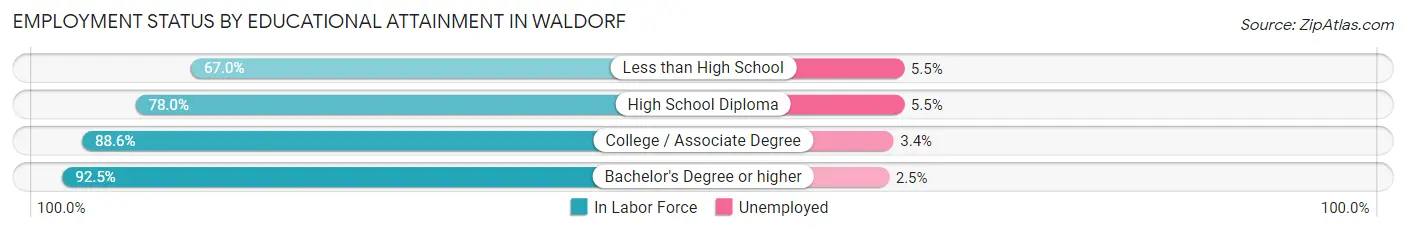
| Educational Attainment | In Labor Force | Unemployed |
| Less than High School | 1,223 (67.0%) | 100 (5.5%) |
| High School Diploma | 9,785 (78.0%) | 690 (5.5%) |
| College / Associate Degree | 14,235 (88.6%) | 546 (3.4%) |
| Bachelor's Degree or higher | 14,175 (92.5%) | 383 (2.5%) |
| Total | 39,446 (86.2%) | 1,693 (3.7%) |
Employment Occupations by Sex in Waldorf
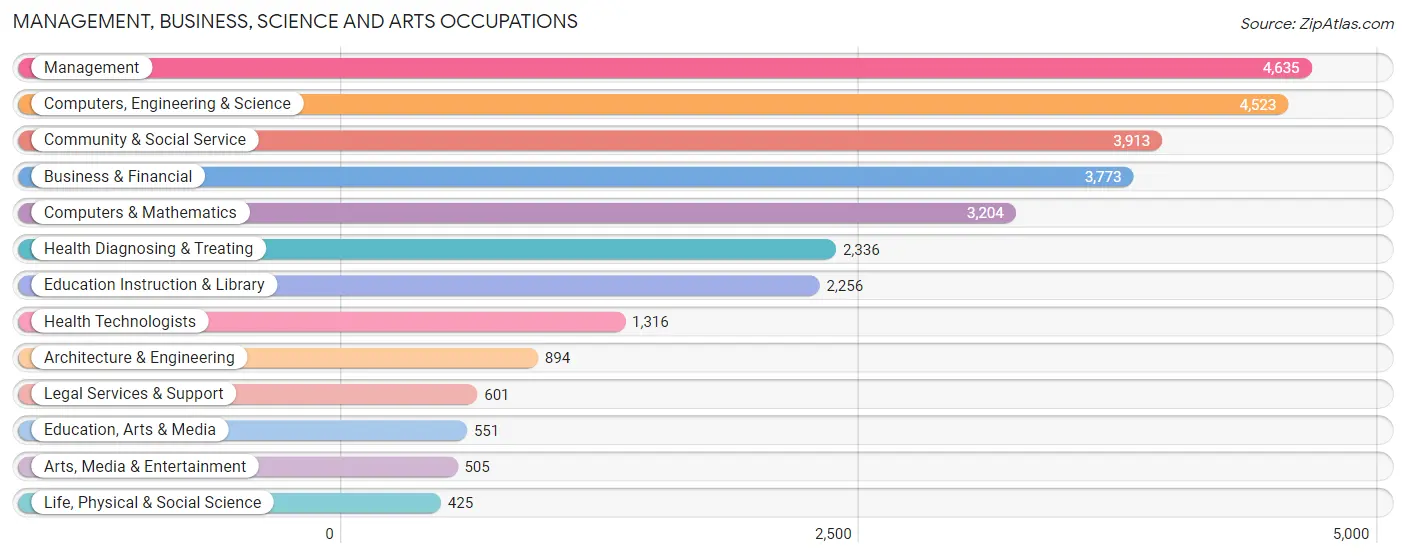
Management, Business, Science and Arts Occupations
The most common Management, Business, Science and Arts occupations in Waldorf are Management (4,635 | 10.7%), Computers, Engineering & Science (4,523 | 10.5%), Community & Social Service (3,913 | 9.1%), Business & Financial (3,773 | 8.7%), and Computers & Mathematics (3,204 | 7.4%).
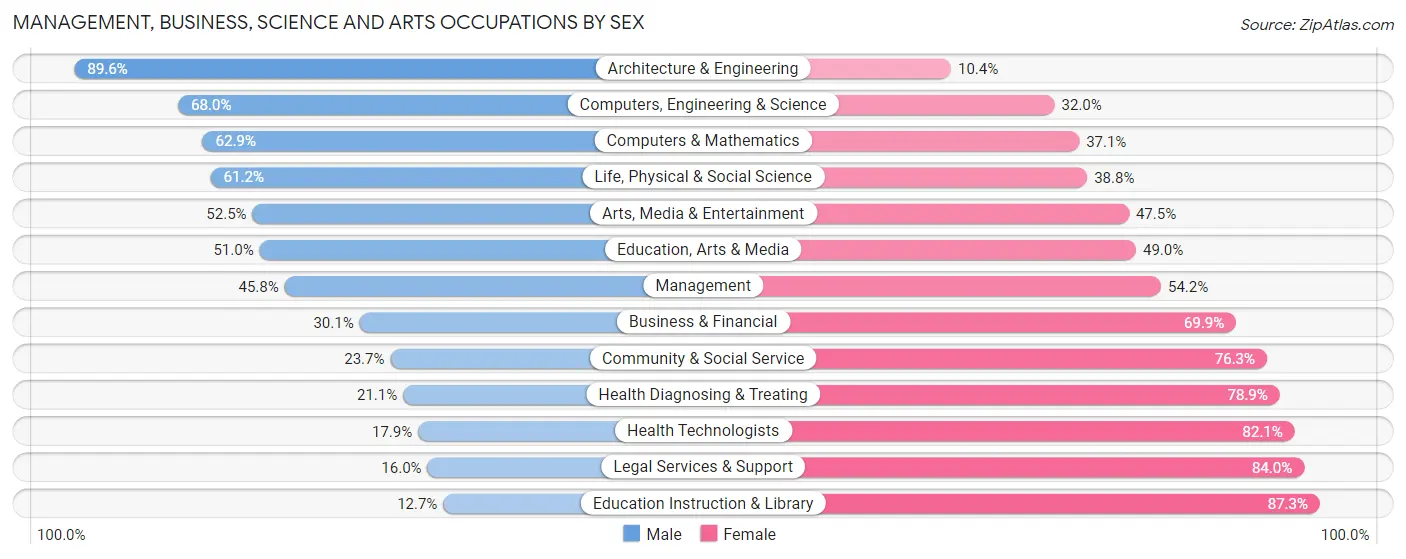
Management, Business, Science and Arts Occupations by Sex
Within the Management, Business, Science and Arts occupations in Waldorf, the most male-oriented occupations are Architecture & Engineering (89.6%), Computers, Engineering & Science (68.0%), and Computers & Mathematics (62.9%), while the most female-oriented occupations are Education Instruction & Library (87.3%), Legal Services & Support (84.0%), and Health Technologists (82.1%).
| Occupation | Male | Female |
| Management | 2,122 (45.8%) | 2,513 (54.2%) |
| Business & Financial | 1,137 (30.1%) | 2,636 (69.9%) |
| Computers, Engineering & Science | 3,075 (68.0%) | 1,448 (32.0%) |
| Computers & Mathematics | 2,014 (62.9%) | 1,190 (37.1%) |
| Architecture & Engineering | 801 (89.6%) | 93 (10.4%) |
| Life, Physical & Social Science | 260 (61.2%) | 165 (38.8%) |
| Community & Social Service | 928 (23.7%) | 2,985 (76.3%) |
| Education, Arts & Media | 281 (51.0%) | 270 (49.0%) |
| Legal Services & Support | 96 (16.0%) | 505 (84.0%) |
| Education Instruction & Library | 286 (12.7%) | 1,970 (87.3%) |
| Arts, Media & Entertainment | 265 (52.5%) | 240 (47.5%) |
| Health Diagnosing & Treating | 492 (21.1%) | 1,844 (78.9%) |
| Health Technologists | 236 (17.9%) | 1,080 (82.1%) |
| Total (Category) | 7,754 (40.4%) | 11,426 (59.6%) |
| Total (Overall) | 20,745 (48.1%) | 22,392 (51.9%) |
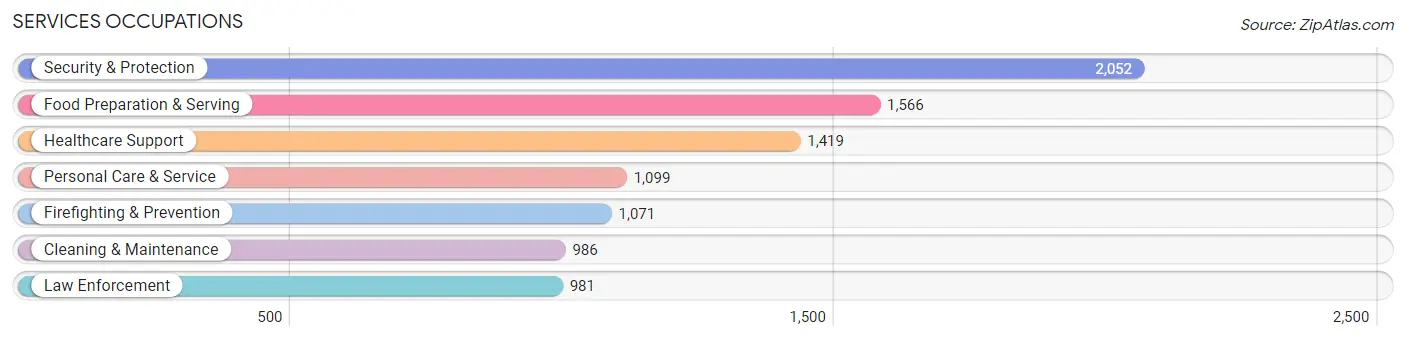
Services Occupations
The most common Services occupations in Waldorf are Security & Protection (2,052 | 4.8%), Food Preparation & Serving (1,566 | 3.6%), Healthcare Support (1,419 | 3.3%), Personal Care & Service (1,099 | 2.5%), and Firefighting & Prevention (1,071 | 2.5%).
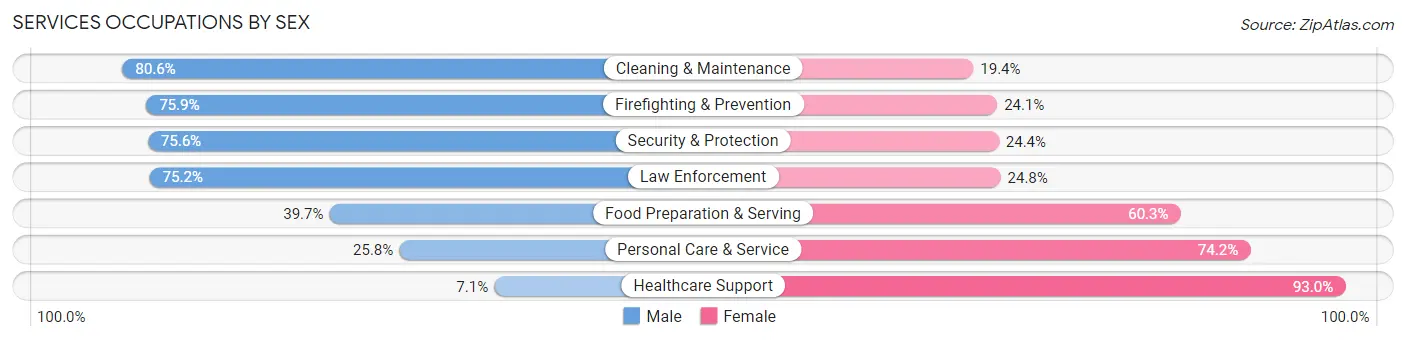
Services Occupations by Sex
Within the Services occupations in Waldorf, the most male-oriented occupations are Cleaning & Maintenance (80.6%), Firefighting & Prevention (75.9%), and Security & Protection (75.6%), while the most female-oriented occupations are Healthcare Support (92.9%), Personal Care & Service (74.2%), and Food Preparation & Serving (60.3%).
| Occupation | Male | Female |
| Healthcare Support | 100 (7.0%) | 1,319 (92.9%) |
| Security & Protection | 1,551 (75.6%) | 501 (24.4%) |
| Firefighting & Prevention | 813 (75.9%) | 258 (24.1%) |
| Law Enforcement | 738 (75.2%) | 243 (24.8%) |
| Food Preparation & Serving | 621 (39.7%) | 945 (60.3%) |
| Cleaning & Maintenance | 795 (80.6%) | 191 (19.4%) |
| Personal Care & Service | 284 (25.8%) | 815 (74.2%) |
| Total (Category) | 3,351 (47.0%) | 3,771 (52.9%) |
| Total (Overall) | 20,745 (48.1%) | 22,392 (51.9%) |
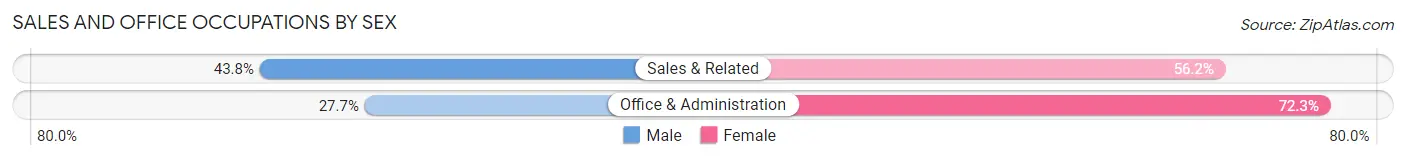
Sales and Office Occupations
The most common Sales and Office occupations in Waldorf are Office & Administration (5,928 | 13.7%), and Sales & Related (2,976 | 6.9%).

Sales and Office Occupations by Sex
| Occupation | Male | Female |
| Sales & Related | 1,304 (43.8%) | 1,672 (56.2%) |
| Office & Administration | 1,640 (27.7%) | 4,288 (72.3%) |
| Total (Category) | 2,944 (33.1%) | 5,960 (66.9%) |
| Total (Overall) | 20,745 (48.1%) | 22,392 (51.9%) |
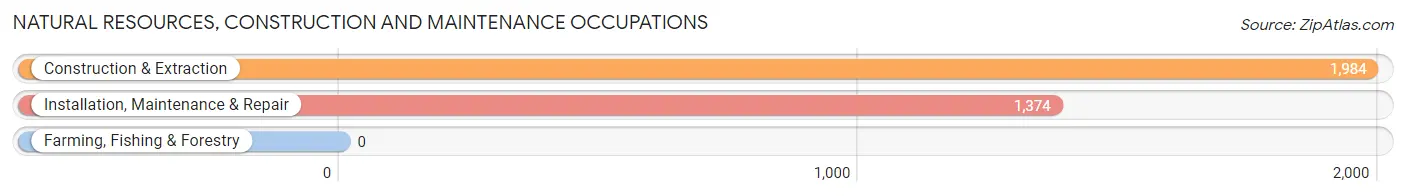
Natural Resources, Construction and Maintenance Occupations
The most common Natural Resources, Construction and Maintenance occupations in Waldorf are Construction & Extraction (1,984 | 4.6%), and Installation, Maintenance & Repair (1,374 | 3.2%).
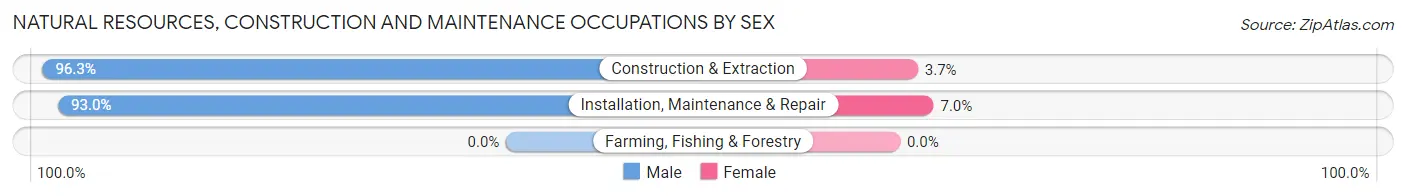
Natural Resources, Construction and Maintenance Occupations by Sex
| Occupation | Male | Female |
| Farming, Fishing & Forestry | 0 (0.0%) | 0 (0.0%) |
| Construction & Extraction | 1,910 (96.3%) | 74 (3.7%) |
| Installation, Maintenance & Repair | 1,278 (93.0%) | 96 (7.0%) |
| Total (Category) | 3,188 (94.9%) | 170 (5.1%) |
| Total (Overall) | 20,745 (48.1%) | 22,392 (51.9%) |
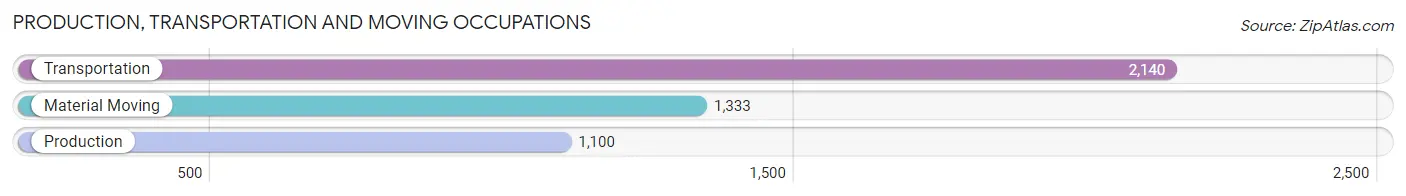
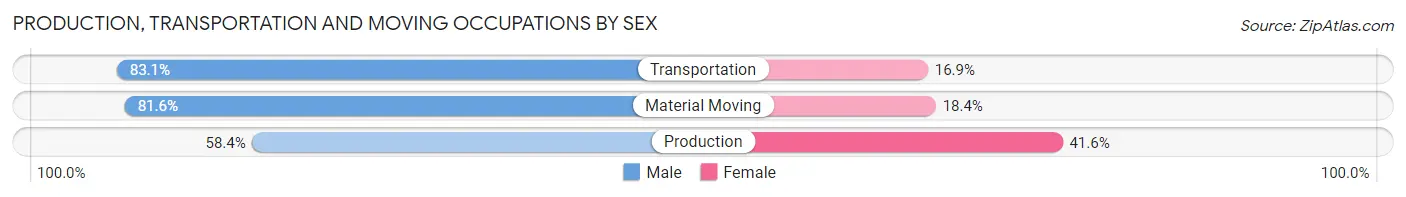
Production, Transportation and Moving Occupations
The most common Production, Transportation and Moving occupations in Waldorf are Transportation (2,140 | 5.0%), Material Moving (1,333 | 3.1%), and Production (1,100 | 2.5%).
Production, Transportation and Moving Occupations by Sex
| Occupation | Male | Female |
| Production | 642 (58.4%) | 458 (41.6%) |
| Transportation | 1,778 (83.1%) | 362 (16.9%) |
| Material Moving | 1,088 (81.6%) | 245 (18.4%) |
| Total (Category) | 3,508 (76.7%) | 1,065 (23.3%) |
| Total (Overall) | 20,745 (48.1%) | 22,392 (51.9%) |
Employment Industries by Sex in Waldorf
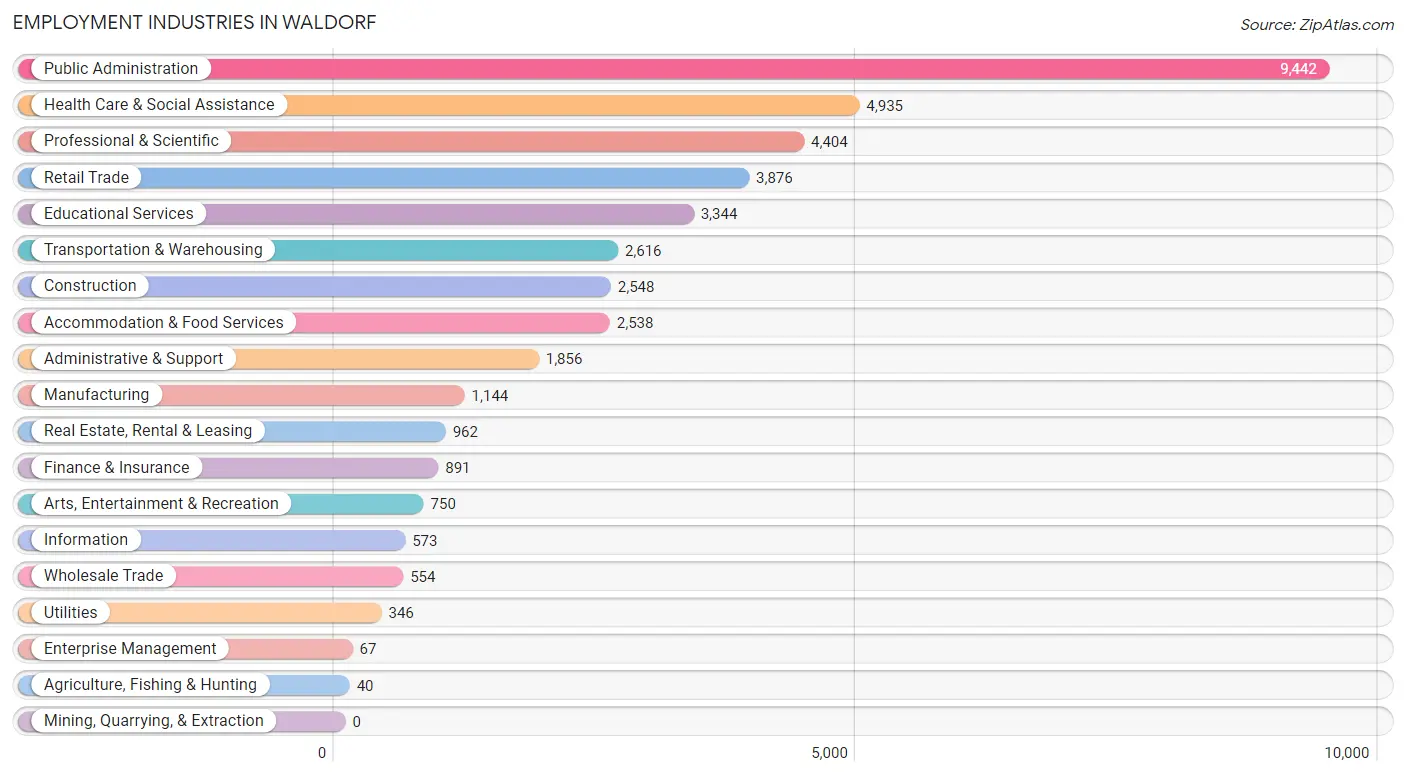
Employment Industries in Waldorf
The major employment industries in Waldorf include Public Administration (9,442 | 21.9%), Health Care & Social Assistance (4,935 | 11.4%), Professional & Scientific (4,404 | 10.2%), Retail Trade (3,876 | 9.0%), and Educational Services (3,344 | 7.7%).
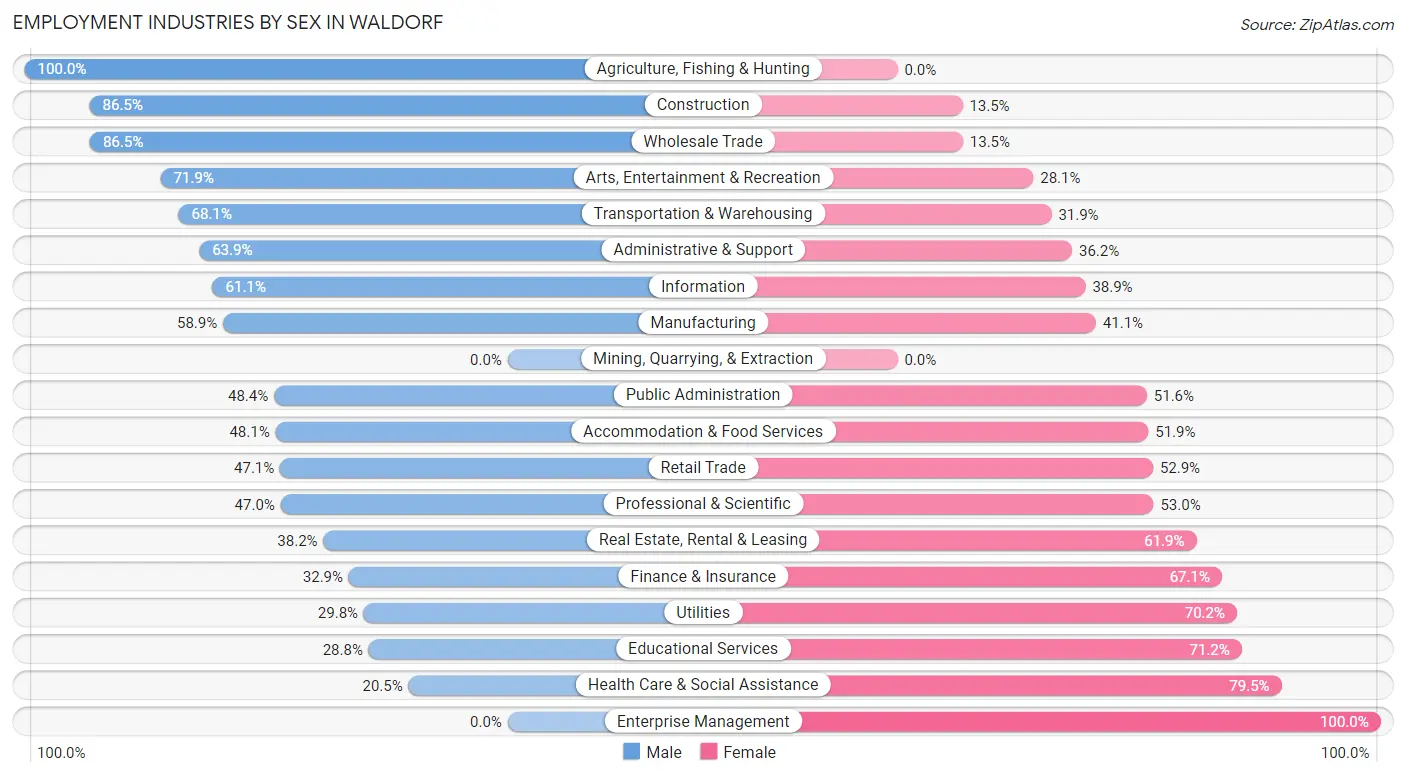
Employment Industries by Sex in Waldorf
The Waldorf industries that see more men than women are Agriculture, Fishing & Hunting (100.0%), Construction (86.5%), and Wholesale Trade (86.5%), whereas the industries that tend to have a higher number of women are Enterprise Management (100.0%), Health Care & Social Assistance (79.5%), and Educational Services (71.2%).
| Industry | Male | Female |
| Agriculture, Fishing & Hunting | 40 (100.0%) | 0 (0.0%) |
| Mining, Quarrying, & Extraction | 0 (0.0%) | 0 (0.0%) |
| Construction | 2,205 (86.5%) | 343 (13.5%) |
| Manufacturing | 674 (58.9%) | 470 (41.1%) |
| Wholesale Trade | 479 (86.5%) | 75 (13.5%) |
| Retail Trade | 1,826 (47.1%) | 2,050 (52.9%) |
| Transportation & Warehousing | 1,782 (68.1%) | 834 (31.9%) |
| Utilities | 103 (29.8%) | 243 (70.2%) |
| Information | 350 (61.1%) | 223 (38.9%) |
| Finance & Insurance | 293 (32.9%) | 598 (67.1%) |
| Real Estate, Rental & Leasing | 367 (38.2%) | 595 (61.9%) |
| Professional & Scientific | 2,070 (47.0%) | 2,334 (53.0%) |
| Enterprise Management | 0 (0.0%) | 67 (100.0%) |
| Administrative & Support | 1,185 (63.8%) | 671 (36.1%) |
| Educational Services | 962 (28.8%) | 2,382 (71.2%) |
| Health Care & Social Assistance | 1,013 (20.5%) | 3,922 (79.5%) |
| Arts, Entertainment & Recreation | 539 (71.9%) | 211 (28.1%) |
| Accommodation & Food Services | 1,220 (48.1%) | 1,318 (51.9%) |
| Public Administration | 4,567 (48.4%) | 4,875 (51.6%) |
| Total | 20,745 (48.1%) | 22,392 (51.9%) |
Education in Waldorf
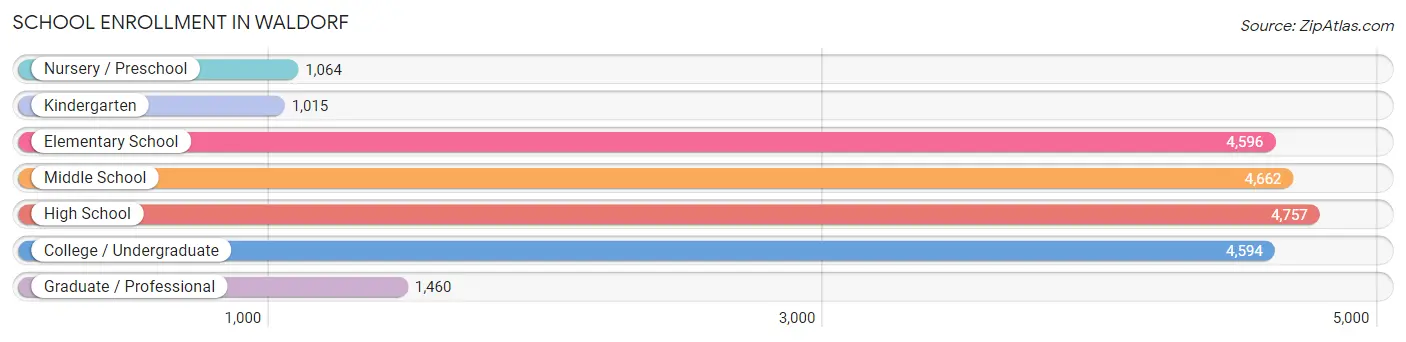
School Enrollment in Waldorf
The most common levels of schooling among the 22,148 students in Waldorf are high school (4,757 | 21.5%), middle school (4,662 | 21.0%), and elementary school (4,596 | 20.7%).
| School Level | # Students | % Students |
| Nursery / Preschool | 1,064 | 4.8% |
| Kindergarten | 1,015 | 4.6% |
| Elementary School | 4,596 | 20.7% |
| Middle School | 4,662 | 21.0% |
| High School | 4,757 | 21.5% |
| College / Undergraduate | 4,594 | 20.7% |
| Graduate / Professional | 1,460 | 6.6% |
| Total | 22,148 | 100.0% |
School Enrollment by Age by Funding Source in Waldorf
Out of a total of 22,148 students who are enrolled in schools in Waldorf, 2,946 (13.3%) attend a private institution, while the remaining 19,202 (86.7%) are enrolled in public schools. The age group of 35 years and over has the highest likelihood of being enrolled in private schools, with 715 (36.7% in the age bracket) enrolled. Conversely, the age group of 18 to 19 year olds has the lowest likelihood of being enrolled in a private school, with 1,177 (94.7% in the age bracket) attending a public institution.
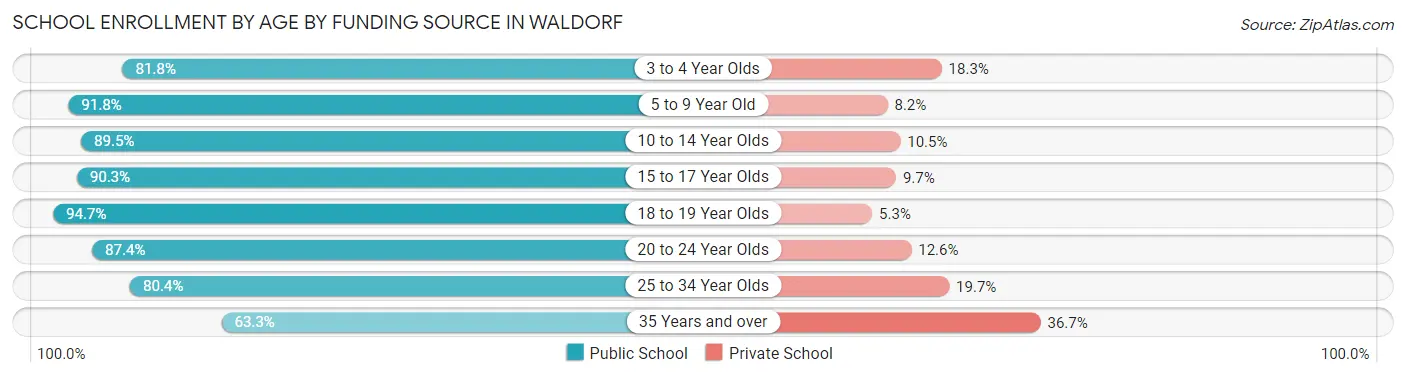
| Age Bracket | Public School | Private School |
| 3 to 4 Year Olds | 699 (81.8%) | 156 (18.2%) |
| 5 to 9 Year Old | 5,069 (91.8%) | 451 (8.2%) |
| 10 to 14 Year Olds | 4,973 (89.5%) | 586 (10.5%) |
| 15 to 17 Year Olds | 2,937 (90.3%) | 317 (9.7%) |
| 18 to 19 Year Olds | 1,177 (94.7%) | 66 (5.3%) |
| 20 to 24 Year Olds | 1,166 (87.4%) | 168 (12.6%) |
| 25 to 34 Year Olds | 1,955 (80.3%) | 478 (19.7%) |
| 35 Years and over | 1,235 (63.3%) | 715 (36.7%) |
| Total | 19,202 (86.7%) | 2,946 (13.3%) |
Educational Attainment by Field of Study in Waldorf
Business (5,047 | 26.5%), arts & humanities (1,774 | 9.3%), education (1,763 | 9.2%), science & technology (1,632 | 8.6%), and social sciences (1,614 | 8.5%) are the most common fields of study among 19,079 individuals in Waldorf who have obtained a bachelor's degree or higher.
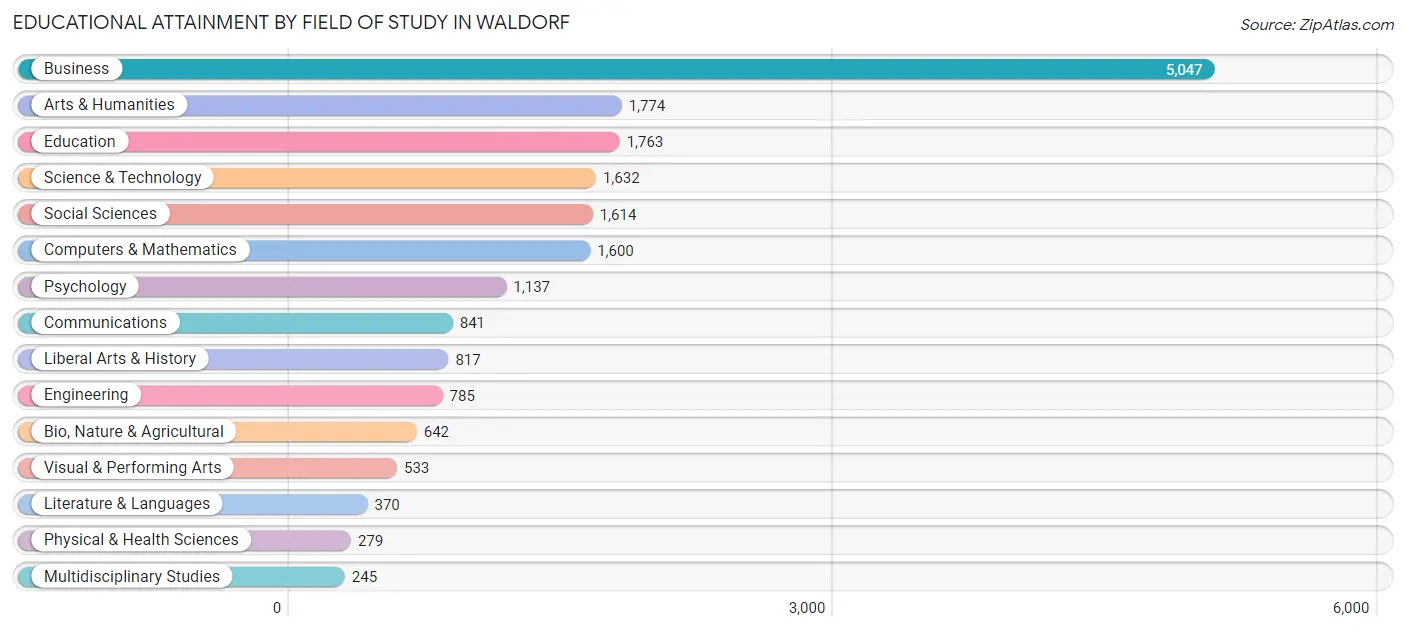
| Field of Study | # Graduates | % Graduates |
| Computers & Mathematics | 1,600 | 8.4% |
| Bio, Nature & Agricultural | 642 | 3.4% |
| Physical & Health Sciences | 279 | 1.5% |
| Psychology | 1,137 | 6.0% |
| Social Sciences | 1,614 | 8.5% |
| Engineering | 785 | 4.1% |
| Multidisciplinary Studies | 245 | 1.3% |
| Science & Technology | 1,632 | 8.6% |
| Business | 5,047 | 26.5% |
| Education | 1,763 | 9.2% |
| Literature & Languages | 370 | 1.9% |
| Liberal Arts & History | 817 | 4.3% |
| Visual & Performing Arts | 533 | 2.8% |
| Communications | 841 | 4.4% |
| Arts & Humanities | 1,774 | 9.3% |
| Total | 19,079 | 100.0% |
Transportation & Commute in Waldorf
Vehicle Availability by Sex in Waldorf
The most prevalent vehicle ownership categories in Waldorf are males with 2 vehicles (10,621, accounting for 49.7%) and females with 2 vehicles (9,737, making up 47.9%).
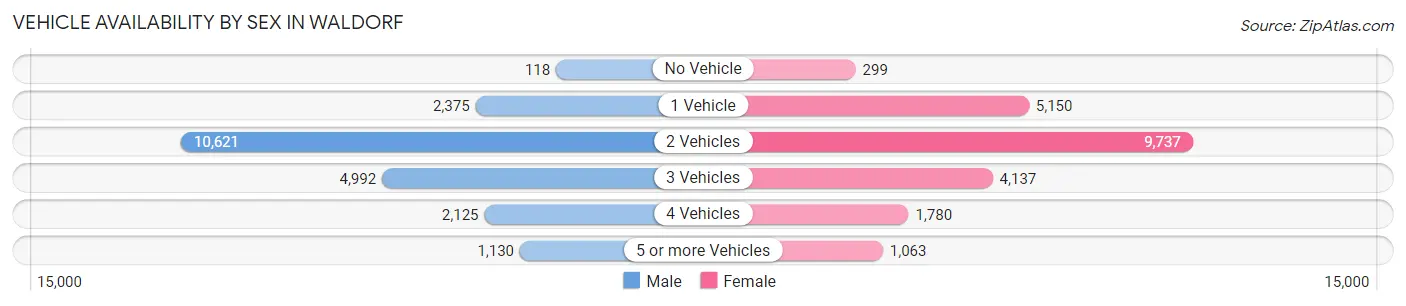
| Vehicles Available | Male | Female |
| No Vehicle | 118 (0.5%) | 299 (1.3%) |
| 1 Vehicle | 2,375 (11.1%) | 5,150 (23.2%) |
| 2 Vehicles | 10,621 (49.7%) | 9,737 (43.9%) |
| 3 Vehicles | 4,992 (23.4%) | 4,137 (18.7%) |
| 4 Vehicles | 2,125 (10.0%) | 1,780 (8.0%) |
| 5 or more Vehicles | 1,130 (5.3%) | 1,063 (4.8%) |
| Total | 21,361 (100.0%) | 22,166 (100.0%) |
Commute Time in Waldorf
The most frequently occuring commute durations in Waldorf are 60 to 89 minutes (8,332 commuters, 21.6%), 45 to 59 minutes (6,333 commuters, 16.4%), and 90 or more minutes (4,706 commuters, 12.2%).
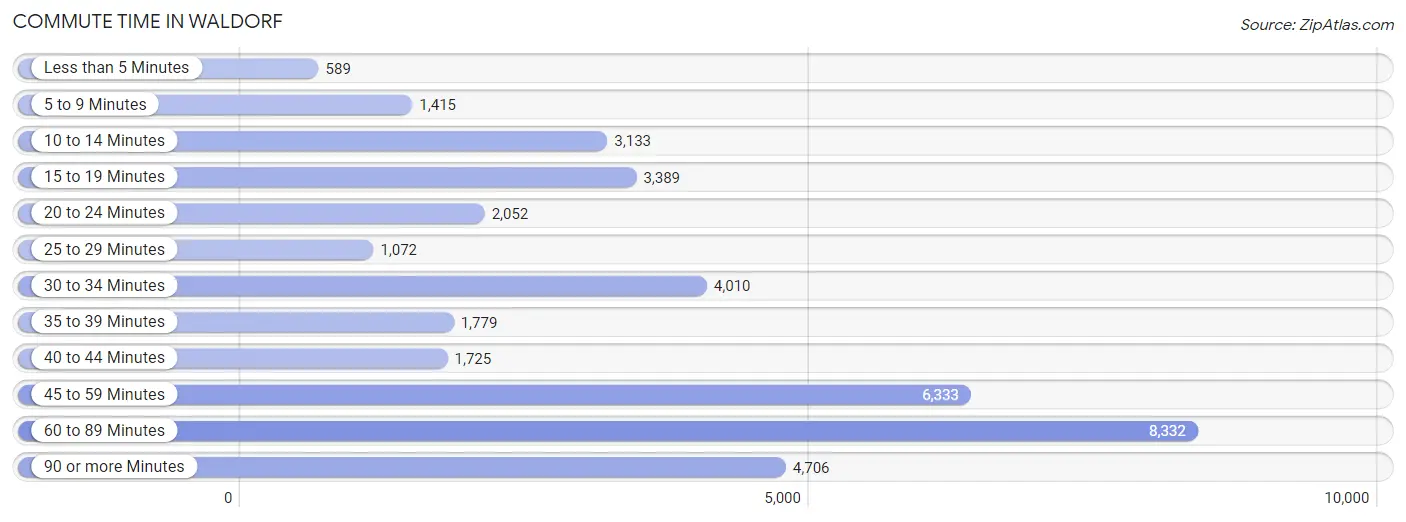
| Commute Time | # Commuters | % Commuters |
| Less than 5 Minutes | 589 | 1.5% |
| 5 to 9 Minutes | 1,415 | 3.7% |
| 10 to 14 Minutes | 3,133 | 8.1% |
| 15 to 19 Minutes | 3,389 | 8.8% |
| 20 to 24 Minutes | 2,052 | 5.3% |
| 25 to 29 Minutes | 1,072 | 2.8% |
| 30 to 34 Minutes | 4,010 | 10.4% |
| 35 to 39 Minutes | 1,779 | 4.6% |
| 40 to 44 Minutes | 1,725 | 4.5% |
| 45 to 59 Minutes | 6,333 | 16.4% |
| 60 to 89 Minutes | 8,332 | 21.6% |
| 90 or more Minutes | 4,706 | 12.2% |
Commute Time by Sex in Waldorf
The most common commute times in Waldorf are 60 to 89 minutes (3,836 commuters, 19.7%) for males and 60 to 89 minutes (4,496 commuters, 23.6%) for females.
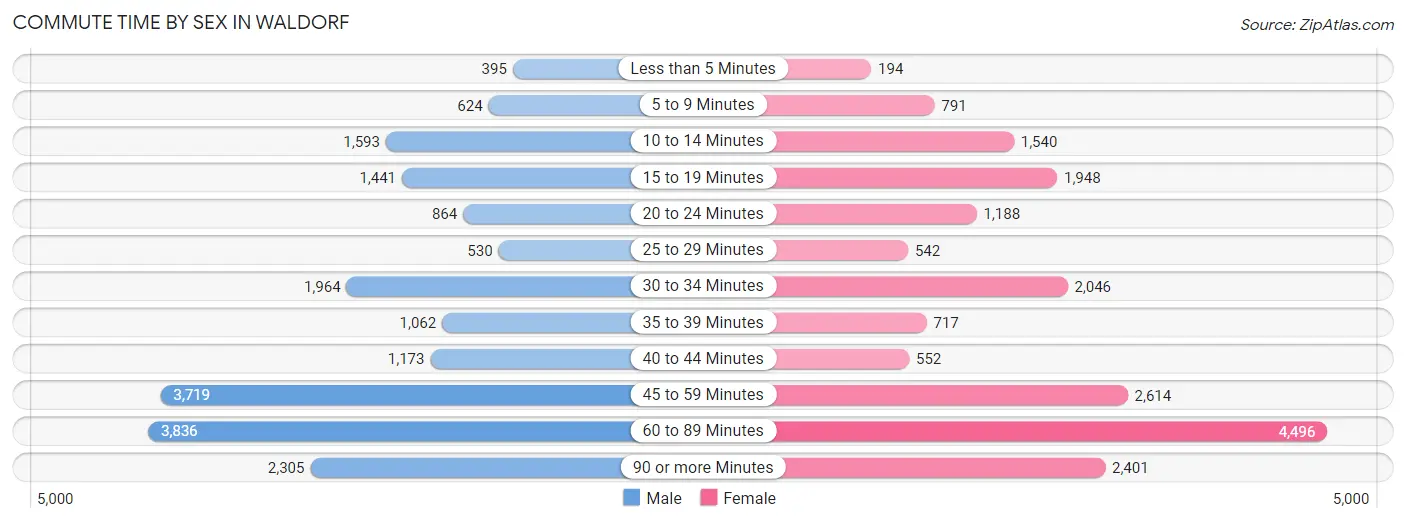
| Commute Time | Male | Female |
| Less than 5 Minutes | 395 (2.0%) | 194 (1.0%) |
| 5 to 9 Minutes | 624 (3.2%) | 791 (4.2%) |
| 10 to 14 Minutes | 1,593 (8.2%) | 1,540 (8.1%) |
| 15 to 19 Minutes | 1,441 (7.4%) | 1,948 (10.2%) |
| 20 to 24 Minutes | 864 (4.4%) | 1,188 (6.2%) |
| 25 to 29 Minutes | 530 (2.7%) | 542 (2.9%) |
| 30 to 34 Minutes | 1,964 (10.1%) | 2,046 (10.7%) |
| 35 to 39 Minutes | 1,062 (5.4%) | 717 (3.8%) |
| 40 to 44 Minutes | 1,173 (6.0%) | 552 (2.9%) |
| 45 to 59 Minutes | 3,719 (19.1%) | 2,614 (13.7%) |
| 60 to 89 Minutes | 3,836 (19.7%) | 4,496 (23.6%) |
| 90 or more Minutes | 2,305 (11.8%) | 2,401 (12.6%) |
Time of Departure to Work by Sex in Waldorf
The most frequent times of departure to work in Waldorf are 7:30 AM to 7:59 AM (2,004, 10.3%) for males and 7:00 AM to 7:29 AM (2,929, 15.4%) for females.
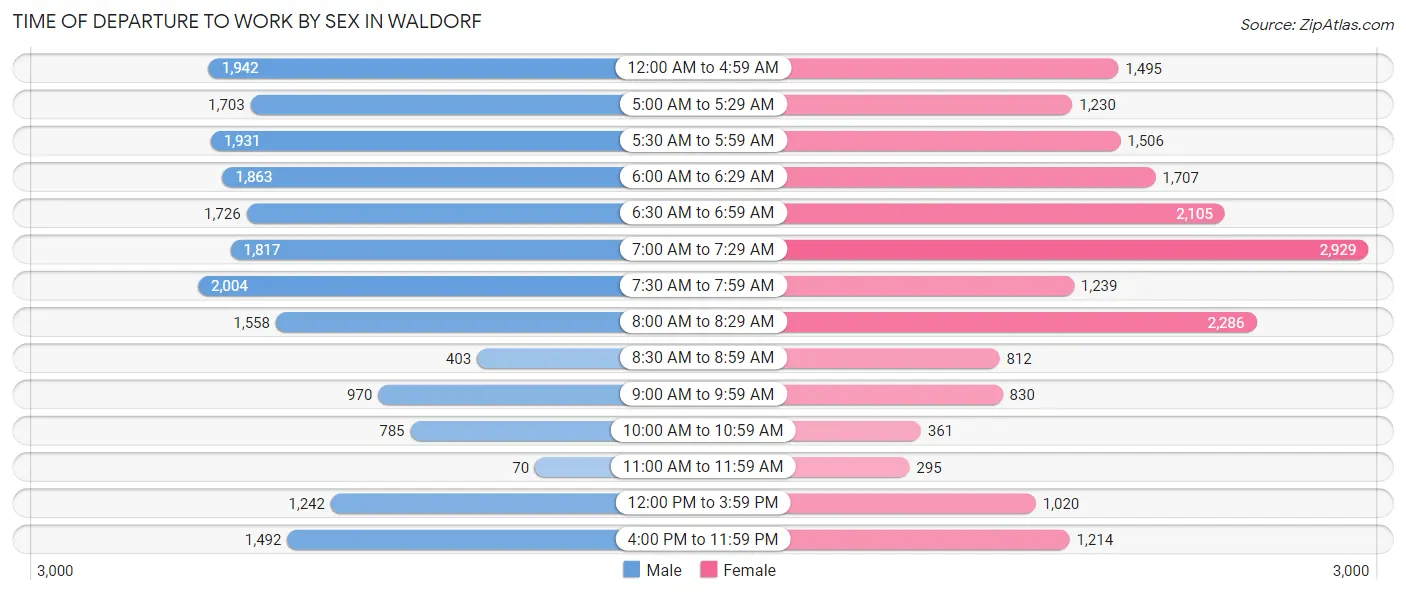
| Time of Departure | Male | Female |
| 12:00 AM to 4:59 AM | 1,942 (10.0%) | 1,495 (7.9%) |
| 5:00 AM to 5:29 AM | 1,703 (8.7%) | 1,230 (6.5%) |
| 5:30 AM to 5:59 AM | 1,931 (9.9%) | 1,506 (7.9%) |
| 6:00 AM to 6:29 AM | 1,863 (9.6%) | 1,707 (9.0%) |
| 6:30 AM to 6:59 AM | 1,726 (8.8%) | 2,105 (11.1%) |
| 7:00 AM to 7:29 AM | 1,817 (9.3%) | 2,929 (15.4%) |
| 7:30 AM to 7:59 AM | 2,004 (10.3%) | 1,239 (6.5%) |
| 8:00 AM to 8:29 AM | 1,558 (8.0%) | 2,286 (12.0%) |
| 8:30 AM to 8:59 AM | 403 (2.1%) | 812 (4.3%) |
| 9:00 AM to 9:59 AM | 970 (5.0%) | 830 (4.4%) |
| 10:00 AM to 10:59 AM | 785 (4.0%) | 361 (1.9%) |
| 11:00 AM to 11:59 AM | 70 (0.4%) | 295 (1.5%) |
| 12:00 PM to 3:59 PM | 1,242 (6.4%) | 1,020 (5.4%) |
| 4:00 PM to 11:59 PM | 1,492 (7.6%) | 1,214 (6.4%) |
| Total | 19,506 (100.0%) | 19,029 (100.0%) |
Housing Occupancy in Waldorf
Occupancy by Ownership in Waldorf
Of the total 29,480 dwellings in Waldorf, owner-occupied units account for 21,264 (72.1%), while renter-occupied units make up 8,216 (27.9%).
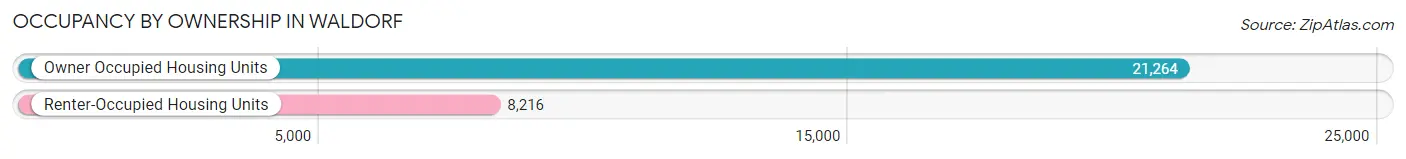
| Occupancy | # Housing Units | % Housing Units |
| Owner Occupied Housing Units | 21,264 | 72.1% |
| Renter-Occupied Housing Units | 8,216 | 27.9% |
| Total Occupied Housing Units | 29,480 | 100.0% |
Occupancy by Household Size in Waldorf
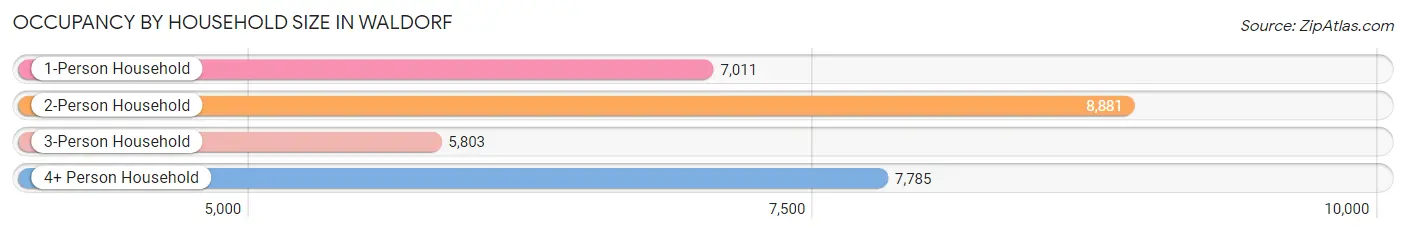
| Household Size | # Housing Units | % Housing Units |
| 1-Person Household | 7,011 | 23.8% |
| 2-Person Household | 8,881 | 30.1% |
| 3-Person Household | 5,803 | 19.7% |
| 4+ Person Household | 7,785 | 26.4% |
| Total Housing Units | 29,480 | 100.0% |
Occupancy by Ownership by Household Size in Waldorf
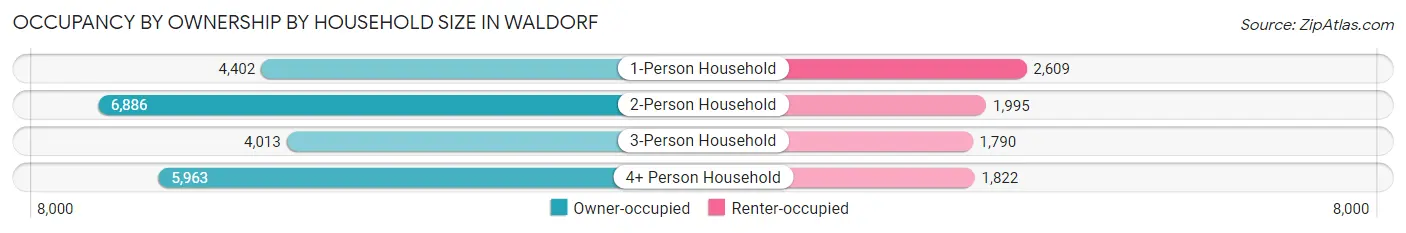
| Household Size | Owner-occupied | Renter-occupied |
| 1-Person Household | 4,402 (62.8%) | 2,609 (37.2%) |
| 2-Person Household | 6,886 (77.5%) | 1,995 (22.5%) |
| 3-Person Household | 4,013 (69.2%) | 1,790 (30.8%) |
| 4+ Person Household | 5,963 (76.6%) | 1,822 (23.4%) |
| Total Housing Units | 21,264 (72.1%) | 8,216 (27.9%) |
Occupancy by Educational Attainment in Waldorf
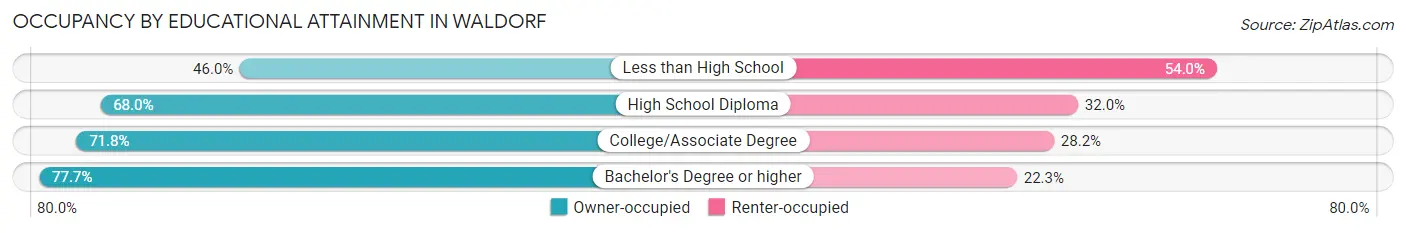
| Household Size | Owner-occupied | Renter-occupied |
| Less than High School | 542 (46.0%) | 637 (54.0%) |
| High School Diploma | 4,645 (68.0%) | 2,186 (32.0%) |
| College/Associate Degree | 7,363 (71.8%) | 2,890 (28.2%) |
| Bachelor's Degree or higher | 8,714 (77.7%) | 2,503 (22.3%) |
Occupancy by Age of Householder in Waldorf
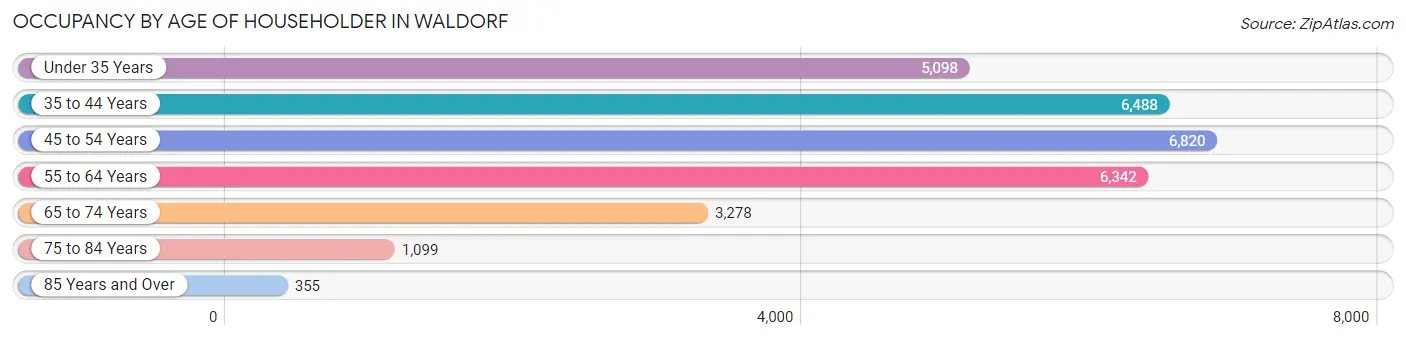
| Age Bracket | # Households | % Households |
| Under 35 Years | 5,098 | 17.3% |
| 35 to 44 Years | 6,488 | 22.0% |
| 45 to 54 Years | 6,820 | 23.1% |
| 55 to 64 Years | 6,342 | 21.5% |
| 65 to 74 Years | 3,278 | 11.1% |
| 75 to 84 Years | 1,099 | 3.7% |
| 85 Years and Over | 355 | 1.2% |
| Total | 29,480 | 100.0% |
Housing Finances in Waldorf
Median Income by Occupancy in Waldorf
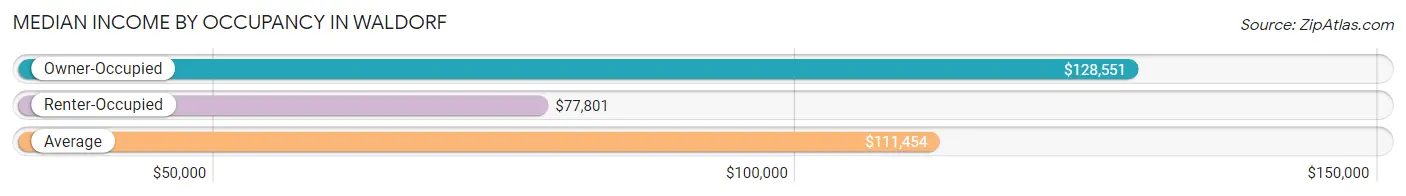
| Occupancy Type | # Households | Median Income |
| Owner-Occupied | 21,264 (72.1%) | $128,551 |
| Renter-Occupied | 8,216 (27.9%) | $77,801 |
| Average | 29,480 (100.0%) | $111,454 |
Occupancy by Householder Income Bracket in Waldorf
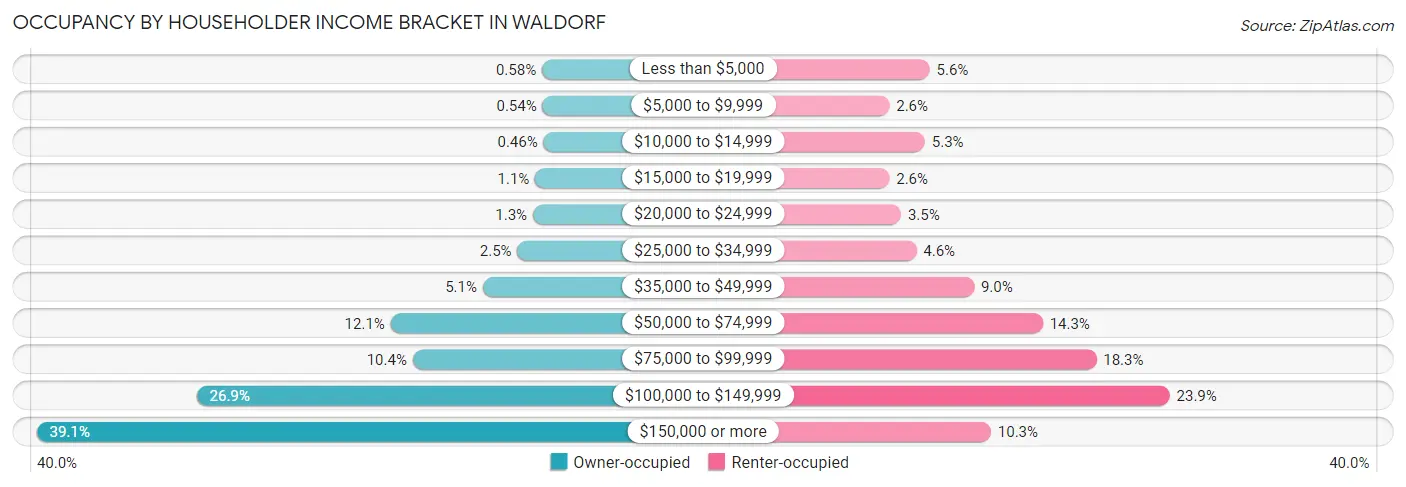
| Income Bracket | Owner-occupied | Renter-occupied |
| Less than $5,000 | 123 (0.6%) | 463 (5.6%) |
| $5,000 to $9,999 | 115 (0.5%) | 211 (2.6%) |
| $10,000 to $14,999 | 98 (0.5%) | 434 (5.3%) |
| $15,000 to $19,999 | 233 (1.1%) | 211 (2.6%) |
| $20,000 to $24,999 | 270 (1.3%) | 284 (3.5%) |
| $25,000 to $34,999 | 520 (2.5%) | 380 (4.6%) |
| $35,000 to $49,999 | 1,082 (5.1%) | 741 (9.0%) |
| $50,000 to $74,999 | 2,575 (12.1%) | 1,172 (14.3%) |
| $75,000 to $99,999 | 2,218 (10.4%) | 1,507 (18.3%) |
| $100,000 to $149,999 | 5,718 (26.9%) | 1,966 (23.9%) |
| $150,000 or more | 8,312 (39.1%) | 847 (10.3%) |
| Total | 21,264 (100.0%) | 8,216 (100.0%) |
Monthly Housing Cost Tiers in Waldorf
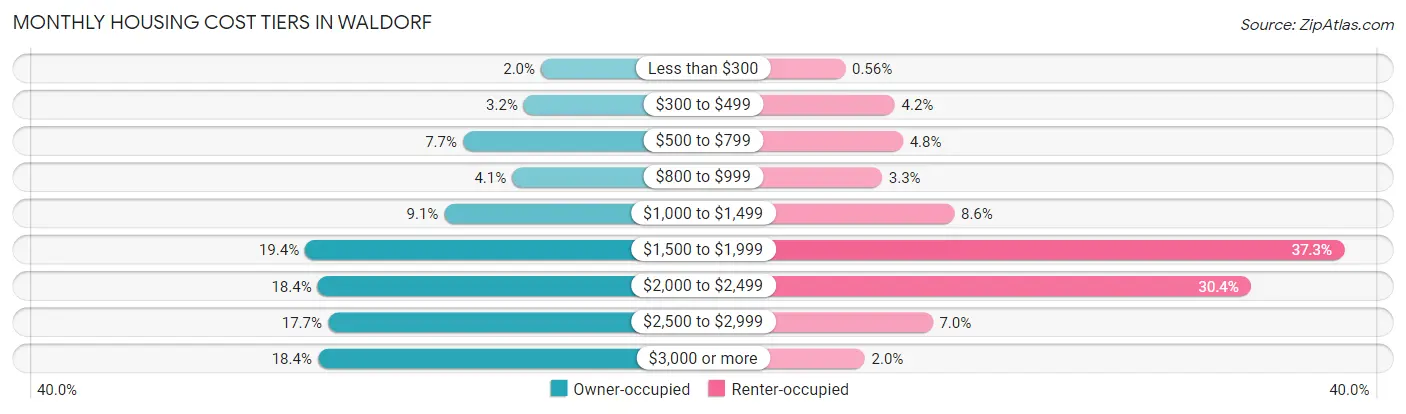
| Monthly Cost | Owner-occupied | Renter-occupied |
| Less than $300 | 420 (2.0%) | 46 (0.6%) |
| $300 to $499 | 689 (3.2%) | 346 (4.2%) |
| $500 to $799 | 1,644 (7.7%) | 395 (4.8%) |
| $800 to $999 | 872 (4.1%) | 269 (3.3%) |
| $1,000 to $1,499 | 1,935 (9.1%) | 706 (8.6%) |
| $1,500 to $1,999 | 4,114 (19.4%) | 3,064 (37.3%) |
| $2,000 to $2,499 | 3,919 (18.4%) | 2,500 (30.4%) |
| $2,500 to $2,999 | 3,757 (17.7%) | 575 (7.0%) |
| $3,000 or more | 3,914 (18.4%) | 164 (2.0%) |
| Total | 21,264 (100.0%) | 8,216 (100.0%) |
Physical Housing Characteristics in Waldorf
Housing Structures in Waldorf
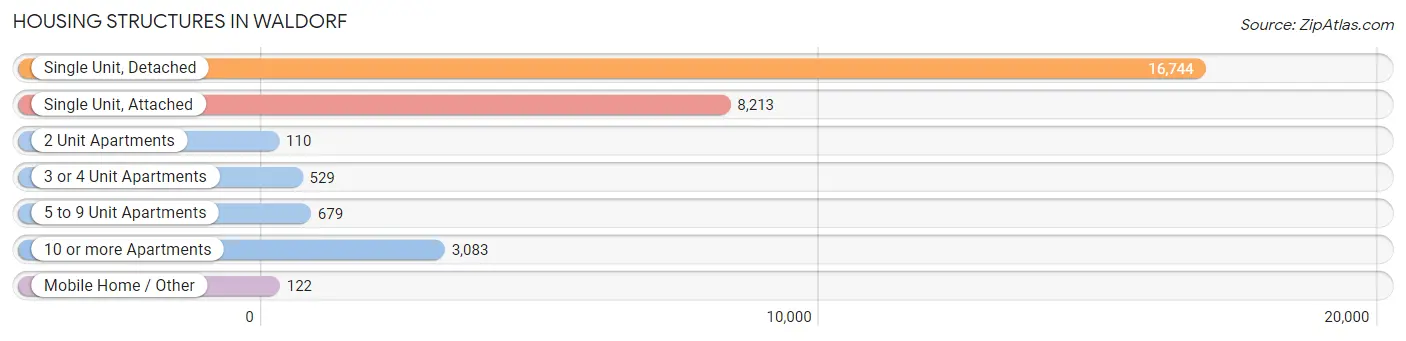
| Structure Type | # Housing Units | % Housing Units |
| Single Unit, Detached | 16,744 | 56.8% |
| Single Unit, Attached | 8,213 | 27.9% |
| 2 Unit Apartments | 110 | 0.4% |
| 3 or 4 Unit Apartments | 529 | 1.8% |
| 5 to 9 Unit Apartments | 679 | 2.3% |
| 10 or more Apartments | 3,083 | 10.5% |
| Mobile Home / Other | 122 | 0.4% |
| Total | 29,480 | 100.0% |
Housing Structures by Occupancy in Waldorf
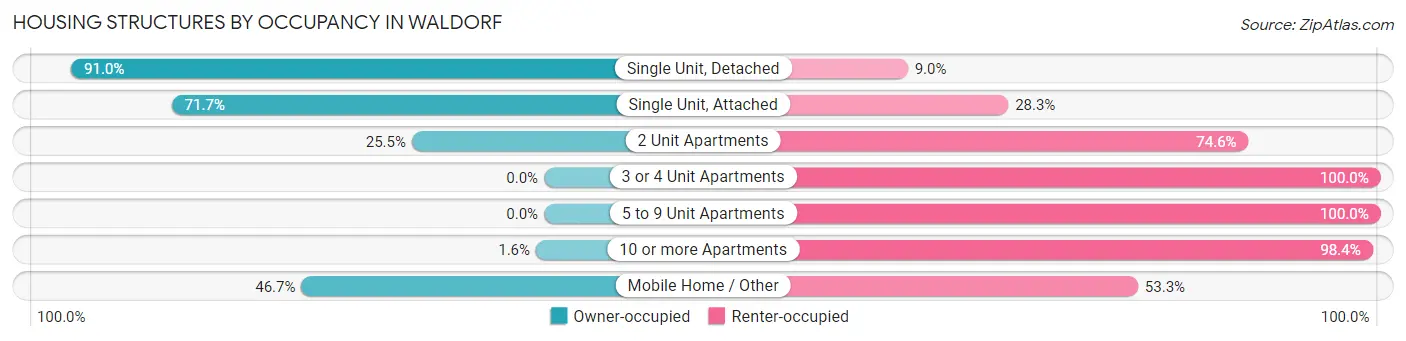
| Structure Type | Owner-occupied | Renter-occupied |
| Single Unit, Detached | 15,243 (91.0%) | 1,501 (9.0%) |
| Single Unit, Attached | 5,888 (71.7%) | 2,325 (28.3%) |
| 2 Unit Apartments | 28 (25.5%) | 82 (74.6%) |
| 3 or 4 Unit Apartments | 0 (0.0%) | 529 (100.0%) |
| 5 to 9 Unit Apartments | 0 (0.0%) | 679 (100.0%) |
| 10 or more Apartments | 48 (1.6%) | 3,035 (98.4%) |
| Mobile Home / Other | 57 (46.7%) | 65 (53.3%) |
| Total | 21,264 (72.1%) | 8,216 (27.9%) |
Housing Structures by Number of Rooms in Waldorf
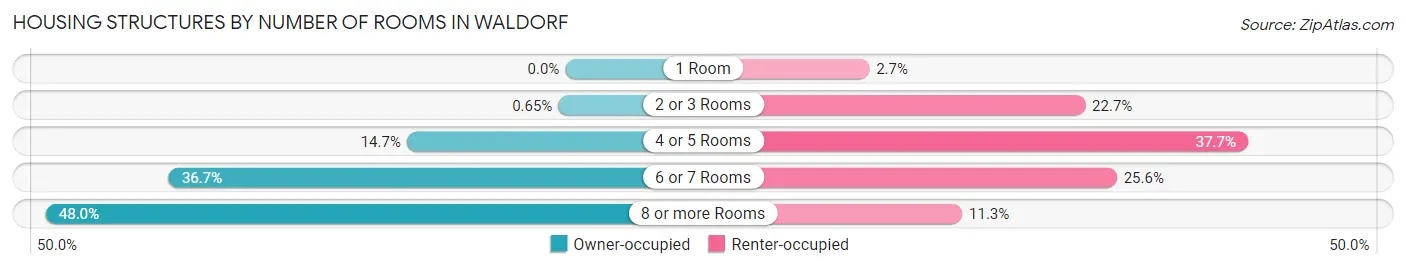
| Number of Rooms | Owner-occupied | Renter-occupied |
| 1 Room | 0 (0.0%) | 223 (2.7%) |
| 2 or 3 Rooms | 139 (0.6%) | 1,863 (22.7%) |
| 4 or 5 Rooms | 3,117 (14.7%) | 3,099 (37.7%) |
| 6 or 7 Rooms | 7,795 (36.7%) | 2,103 (25.6%) |
| 8 or more Rooms | 10,213 (48.0%) | 928 (11.3%) |
| Total | 21,264 (100.0%) | 8,216 (100.0%) |
Housing Structure by Heating Type in Waldorf
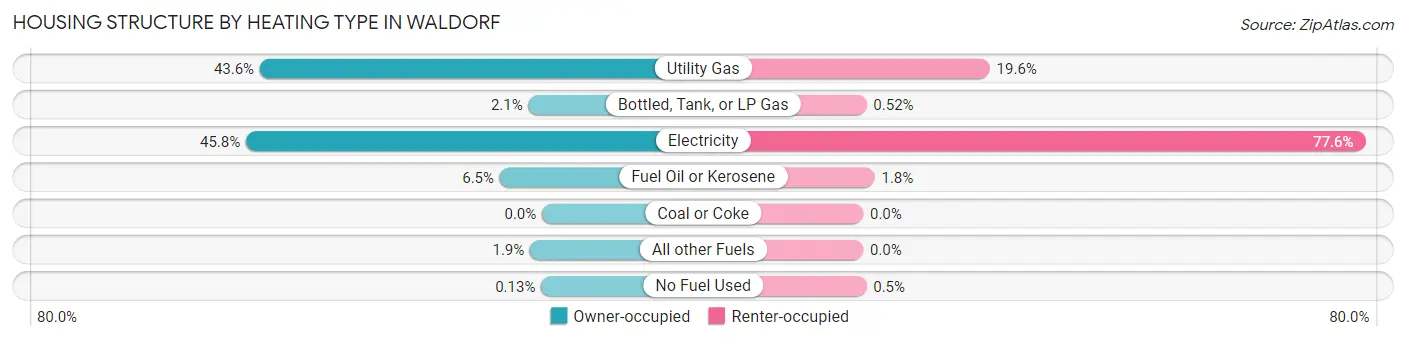
| Heating Type | Owner-occupied | Renter-occupied |
| Utility Gas | 9,276 (43.6%) | 1,608 (19.6%) |
| Bottled, Tank, or LP Gas | 445 (2.1%) | 43 (0.5%) |
| Electricity | 9,733 (45.8%) | 6,378 (77.6%) |
| Fuel Oil or Kerosene | 1,389 (6.5%) | 146 (1.8%) |
| Coal or Coke | 0 (0.0%) | 0 (0.0%) |
| All other Fuels | 393 (1.8%) | 0 (0.0%) |
| No Fuel Used | 28 (0.1%) | 41 (0.5%) |
| Total | 21,264 (100.0%) | 8,216 (100.0%) |
Household Vehicle Usage in Waldorf
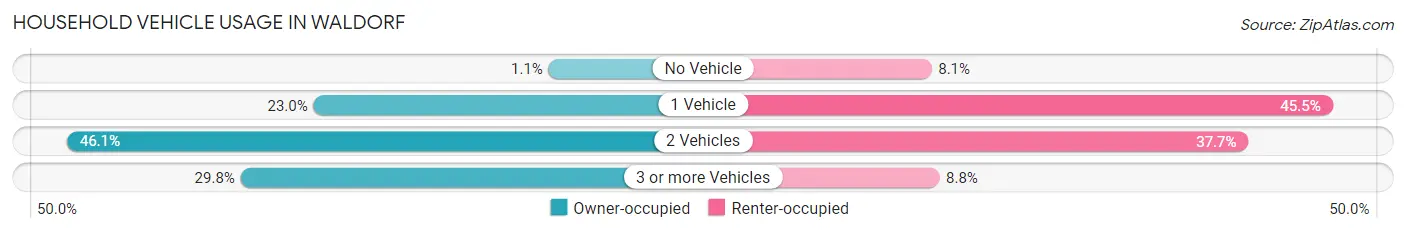
| Vehicles per Household | Owner-occupied | Renter-occupied |
| No Vehicle | 230 (1.1%) | 662 (8.1%) |
| 1 Vehicle | 4,897 (23.0%) | 3,739 (45.5%) |
| 2 Vehicles | 9,795 (46.1%) | 3,093 (37.7%) |
| 3 or more Vehicles | 6,342 (29.8%) | 722 (8.8%) |
| Total | 21,264 (100.0%) | 8,216 (100.0%) |
Real Estate & Mortgages in Waldorf
Real Estate and Mortgage Overview in Waldorf
| Characteristic | Without Mortgage | With Mortgage |
| Housing Units | 3,289 | 17,975 |
| Median Property Value | $338,800 | $364,600 |
| Median Household Income | $108,322 | $7,201 |
| Monthly Housing Costs | $669 | $3,914 |
| Real Estate Taxes | $3,560 | $512 |
Property Value by Mortgage Status in Waldorf
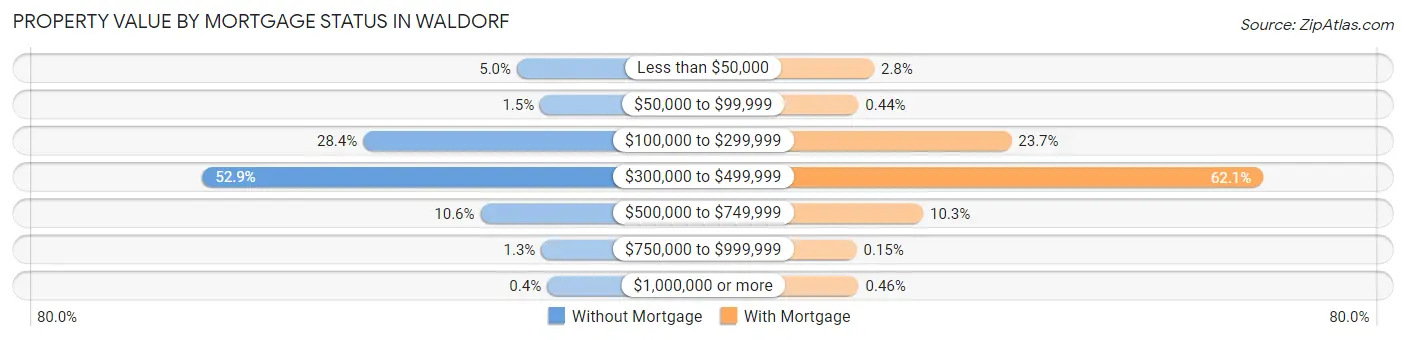
| Property Value | Without Mortgage | With Mortgage |
| Less than $50,000 | 164 (5.0%) | 507 (2.8%) |
| $50,000 to $99,999 | 48 (1.5%) | 79 (0.4%) |
| $100,000 to $299,999 | 935 (28.4%) | 4,267 (23.7%) |
| $300,000 to $499,999 | 1,740 (52.9%) | 11,163 (62.1%) |
| $500,000 to $749,999 | 347 (10.5%) | 1,849 (10.3%) |
| $750,000 to $999,999 | 42 (1.3%) | 27 (0.2%) |
| $1,000,000 or more | 13 (0.4%) | 83 (0.5%) |
| Total | 3,289 (100.0%) | 17,975 (100.0%) |
Household Income by Mortgage Status in Waldorf
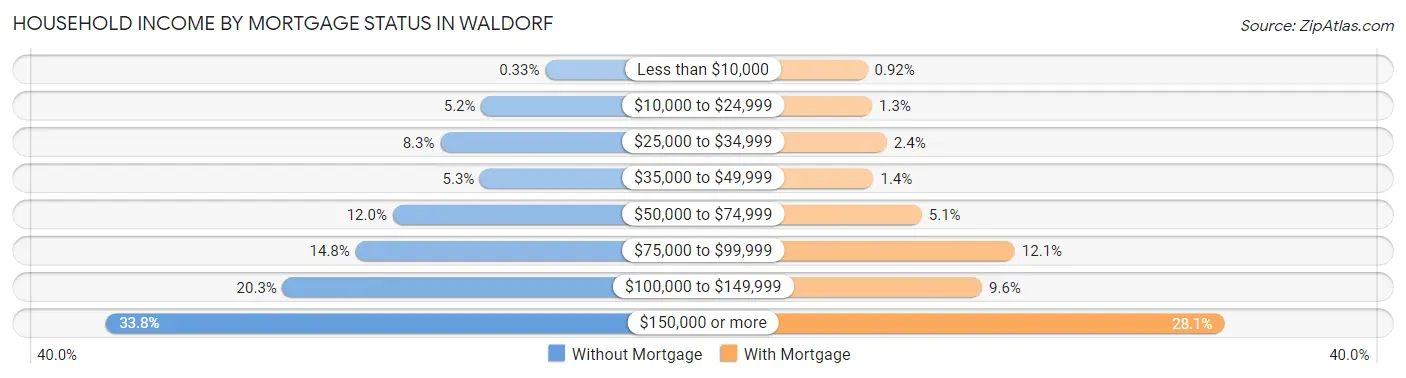
| Household Income | Without Mortgage | With Mortgage |
| Less than $10,000 | 11 (0.3%) | 165 (0.9%) |
| $10,000 to $24,999 | 171 (5.2%) | 227 (1.3%) |
| $25,000 to $34,999 | 274 (8.3%) | 430 (2.4%) |
| $35,000 to $49,999 | 174 (5.3%) | 246 (1.4%) |
| $50,000 to $74,999 | 393 (11.9%) | 908 (5.1%) |
| $75,000 to $99,999 | 486 (14.8%) | 2,182 (12.1%) |
| $100,000 to $149,999 | 669 (20.3%) | 1,732 (9.6%) |
| $150,000 or more | 1,111 (33.8%) | 5,049 (28.1%) |
| Total | 3,289 (100.0%) | 17,975 (100.0%) |
Property Value to Household Income Ratio in Waldorf
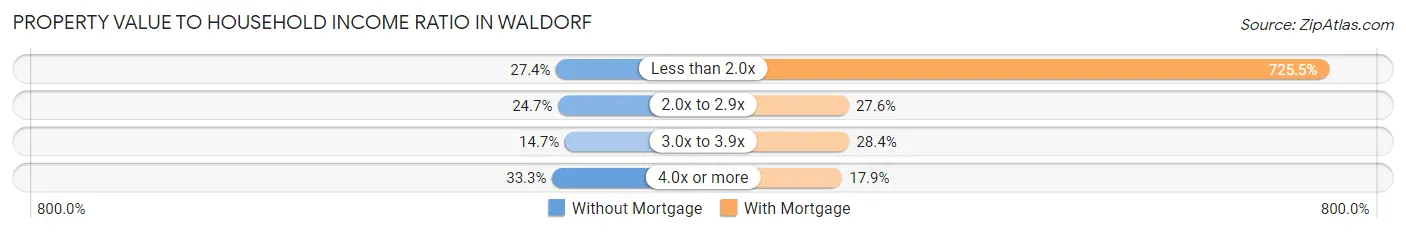
| Value-to-Income Ratio | Without Mortgage | With Mortgage |
| Less than 2.0x | 901 (27.4%) | 130,412 (725.5%) |
| 2.0x to 2.9x | 811 (24.7%) | 4,968 (27.6%) |
| 3.0x to 3.9x | 483 (14.7%) | 5,107 (28.4%) |
| 4.0x or more | 1,094 (33.3%) | 3,224 (17.9%) |
| Total | 3,289 (100.0%) | 17,975 (100.0%) |
Real Estate Taxes by Mortgage Status in Waldorf

| Property Taxes | Without Mortgage | With Mortgage |
| Less than $800 | 113 (3.4%) | 6 (0.0%) |
| $800 to $1,499 | 73 (2.2%) | 407 (2.3%) |
| $800 to $1,499 | 2,792 (84.9%) | 704 (3.9%) |
| Total | 3,289 (100.0%) | 17,975 (100.0%) |
Health & Disability in Waldorf
Health Insurance Coverage by Age in Waldorf
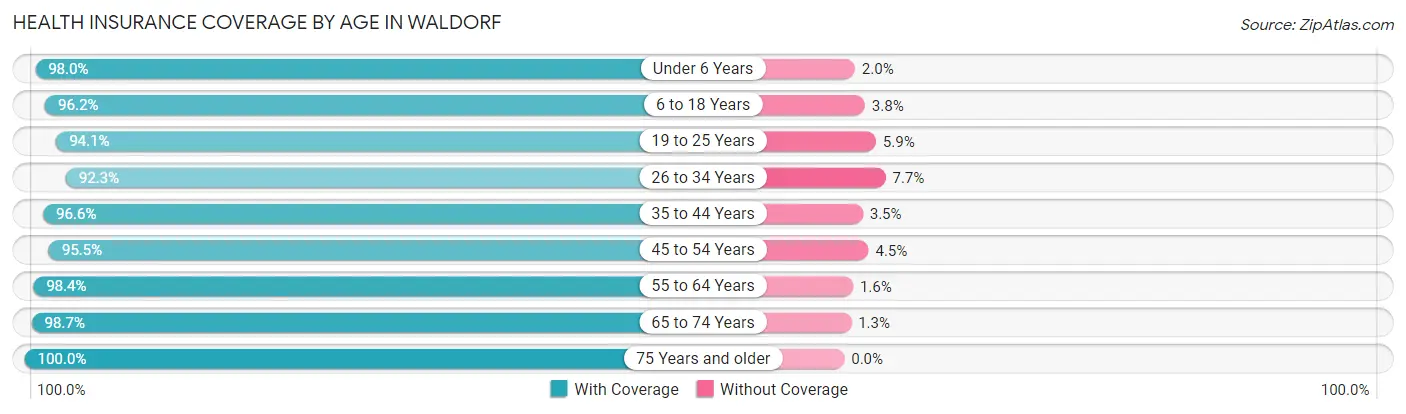
| Age Bracket | With Coverage | Without Coverage |
| Under 6 Years | 5,589 (98.0%) | 113 (2.0%) |
| 6 to 18 Years | 14,530 (96.2%) | 580 (3.8%) |
| 19 to 25 Years | 6,427 (94.1%) | 403 (5.9%) |
| 26 to 34 Years | 9,663 (92.3%) | 805 (7.7%) |
| 35 to 44 Years | 11,297 (96.6%) | 404 (3.5%) |
| 45 to 54 Years | 10,861 (95.5%) | 514 (4.5%) |
| 55 to 64 Years | 9,967 (98.4%) | 163 (1.6%) |
| 65 to 74 Years | 5,568 (98.7%) | 73 (1.3%) |
| 75 Years and older | 2,835 (100.0%) | 0 (0.0%) |
| Total | 76,737 (96.2%) | 3,055 (3.8%) |
Health Insurance Coverage by Citizenship Status in Waldorf

| Citizenship Status | With Coverage | Without Coverage |
| Native Born | 5,589 (98.0%) | 113 (2.0%) |
| Foreign Born, Citizen | 14,530 (96.2%) | 580 (3.8%) |
| Foreign Born, not a Citizen | 6,427 (94.1%) | 403 (5.9%) |
Health Insurance Coverage by Household Income in Waldorf
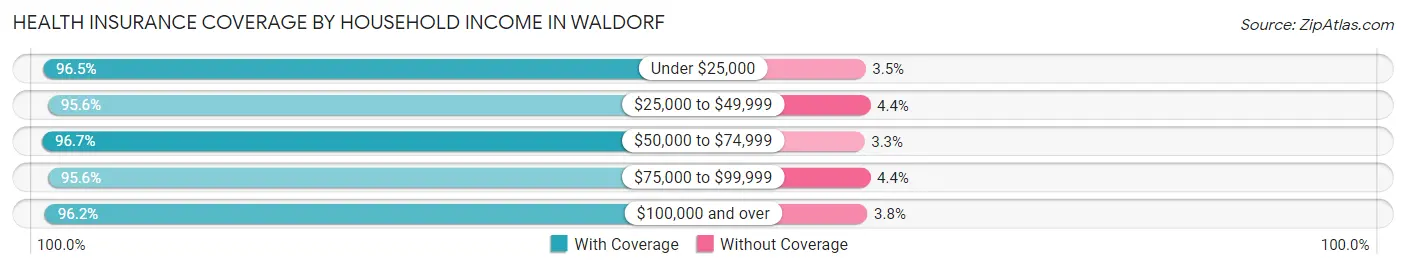
| Household Income | With Coverage | Without Coverage |
| Under $25,000 | 3,991 (96.5%) | 144 (3.5%) |
| $25,000 to $49,999 | 5,660 (95.6%) | 258 (4.4%) |
| $50,000 to $74,999 | 8,975 (96.7%) | 304 (3.3%) |
| $75,000 to $99,999 | 8,854 (95.6%) | 404 (4.4%) |
| $100,000 and over | 49,108 (96.2%) | 1,943 (3.8%) |
Public vs Private Health Insurance Coverage by Age in Waldorf
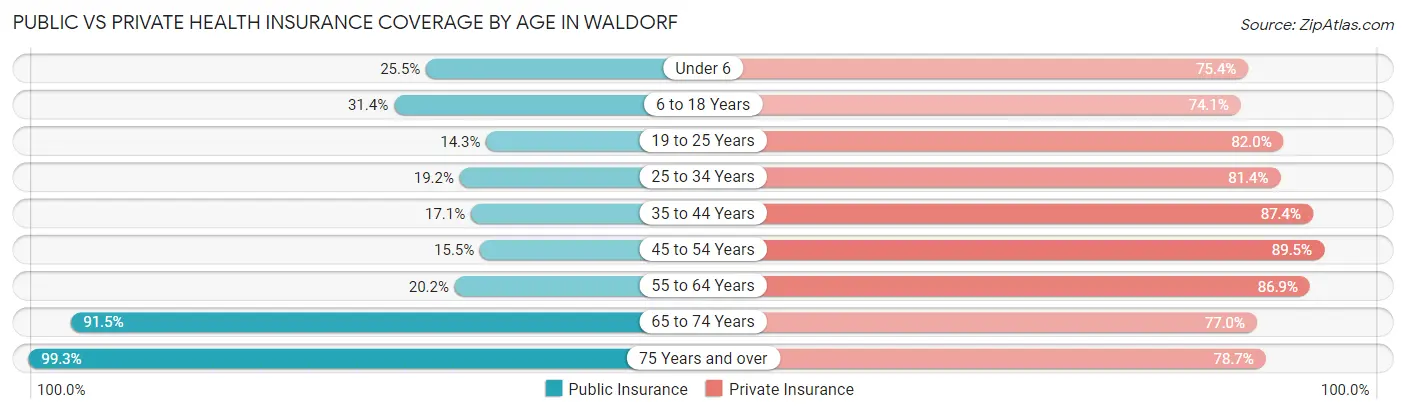
| Age Bracket | Public Insurance | Private Insurance |
| Under 6 | 1,452 (25.5%) | 4,301 (75.4%) |
| 6 to 18 Years | 4,751 (31.4%) | 11,189 (74.1%) |
| 19 to 25 Years | 977 (14.3%) | 5,599 (82.0%) |
| 25 to 34 Years | 2,012 (19.2%) | 8,520 (81.4%) |
| 35 to 44 Years | 2,006 (17.1%) | 10,228 (87.4%) |
| 45 to 54 Years | 1,758 (15.4%) | 10,177 (89.5%) |
| 55 to 64 Years | 2,041 (20.2%) | 8,800 (86.9%) |
| 65 to 74 Years | 5,162 (91.5%) | 4,346 (77.0%) |
| 75 Years and over | 2,815 (99.3%) | 2,230 (78.7%) |
| Total | 22,974 (28.8%) | 65,390 (82.0%) |
Disability Status by Sex by Age in Waldorf
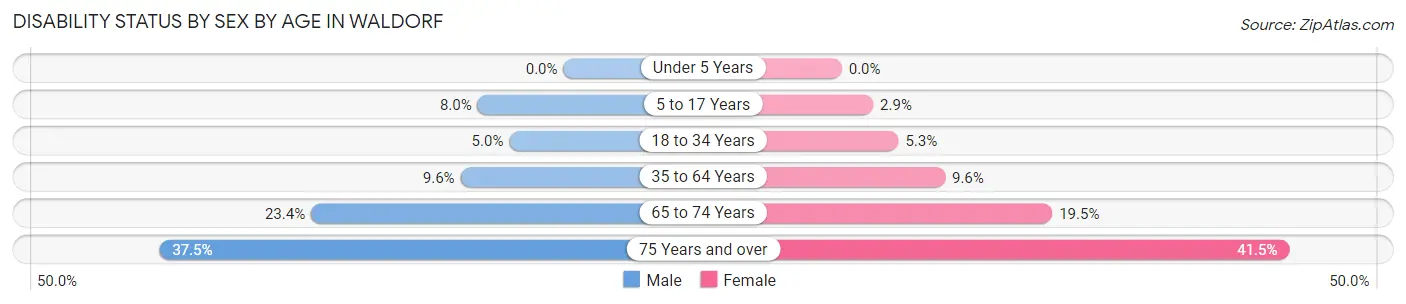
| Age Bracket | Male | Female |
| Under 5 Years | 0 (0.0%) | 0 (0.0%) |
| 5 to 17 Years | 590 (8.0%) | 215 (2.9%) |
| 18 to 34 Years | 433 (5.0%) | 512 (5.3%) |
| 35 to 64 Years | 1,436 (9.6%) | 1,741 (9.6%) |
| 65 to 74 Years | 568 (23.4%) | 628 (19.5%) |
| 75 Years and over | 375 (37.5%) | 762 (41.5%) |
Disability Class by Sex by Age in Waldorf
Disability Class: Hearing Difficulty
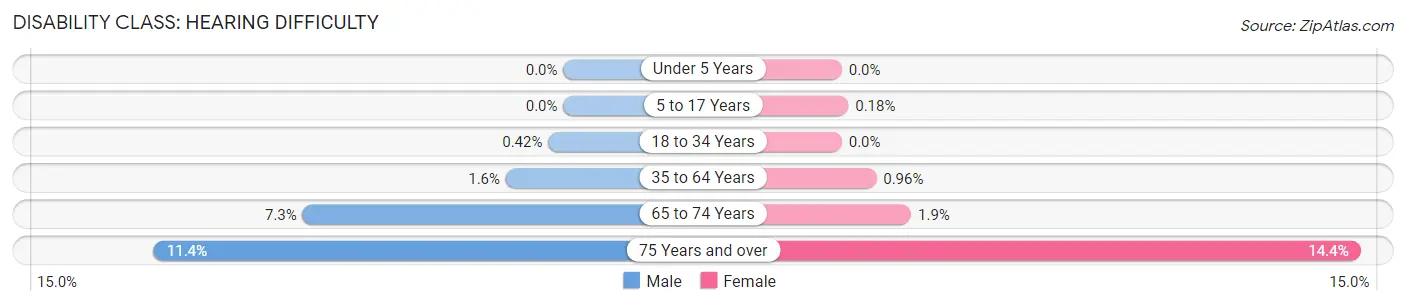
| Age Bracket | Male | Female |
| Under 5 Years | 0 (0.0%) | 0 (0.0%) |
| 5 to 17 Years | 0 (0.0%) | 13 (0.2%) |
| 18 to 34 Years | 36 (0.4%) | 0 (0.0%) |
| 35 to 64 Years | 240 (1.6%) | 174 (1.0%) |
| 65 to 74 Years | 176 (7.3%) | 62 (1.9%) |
| 75 Years and over | 114 (11.4%) | 265 (14.4%) |
Disability Class: Vision Difficulty
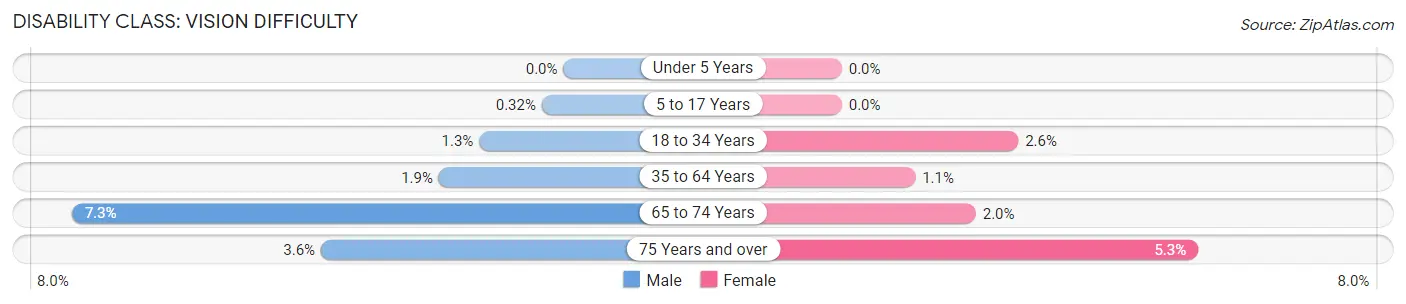
| Age Bracket | Male | Female |
| Under 5 Years | 0 (0.0%) | 0 (0.0%) |
| 5 to 17 Years | 24 (0.3%) | 0 (0.0%) |
| 18 to 34 Years | 108 (1.3%) | 255 (2.6%) |
| 35 to 64 Years | 278 (1.8%) | 198 (1.1%) |
| 65 to 74 Years | 177 (7.3%) | 64 (2.0%) |
| 75 Years and over | 36 (3.6%) | 97 (5.3%) |
Disability Class: Cognitive Difficulty
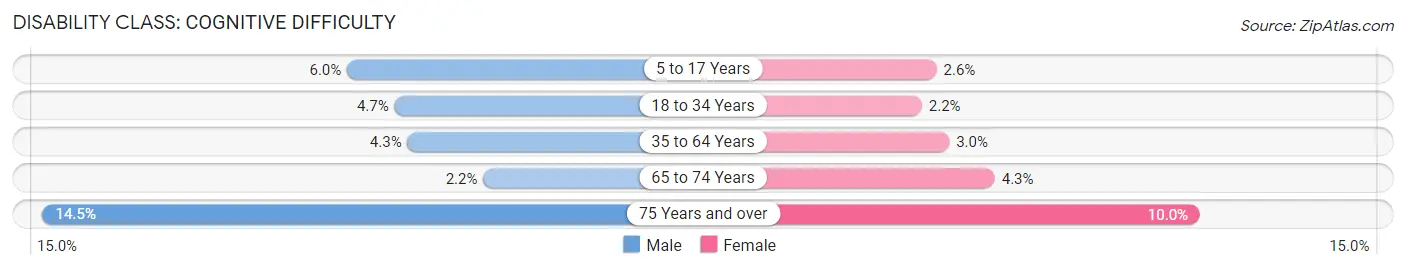
| Age Bracket | Male | Female |
| 5 to 17 Years | 446 (6.0%) | 195 (2.6%) |
| 18 to 34 Years | 406 (4.7%) | 217 (2.2%) |
| 35 to 64 Years | 653 (4.3%) | 543 (3.0%) |
| 65 to 74 Years | 54 (2.2%) | 137 (4.3%) |
| 75 Years and over | 145 (14.5%) | 183 (10.0%) |
Disability Class: Ambulatory Difficulty
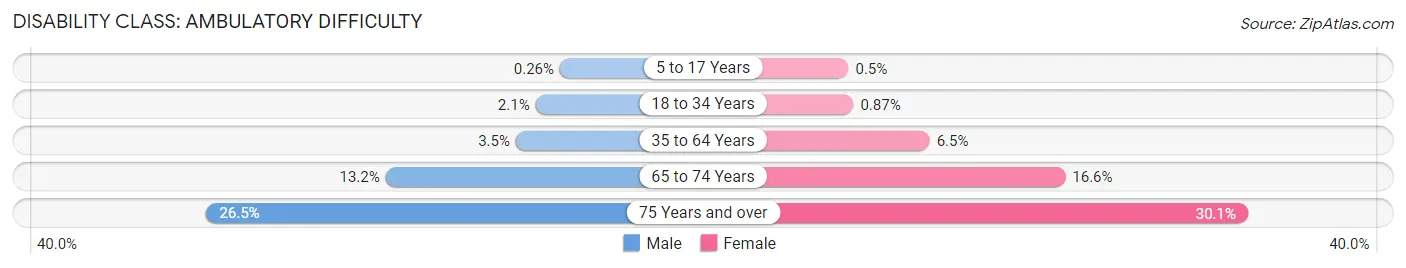
| Age Bracket | Male | Female |
| 5 to 17 Years | 19 (0.3%) | 37 (0.5%) |
| 18 to 34 Years | 179 (2.1%) | 85 (0.9%) |
| 35 to 64 Years | 531 (3.5%) | 1,187 (6.5%) |
| 65 to 74 Years | 320 (13.2%) | 534 (16.6%) |
| 75 Years and over | 265 (26.5%) | 553 (30.1%) |
Disability Class: Self-Care Difficulty
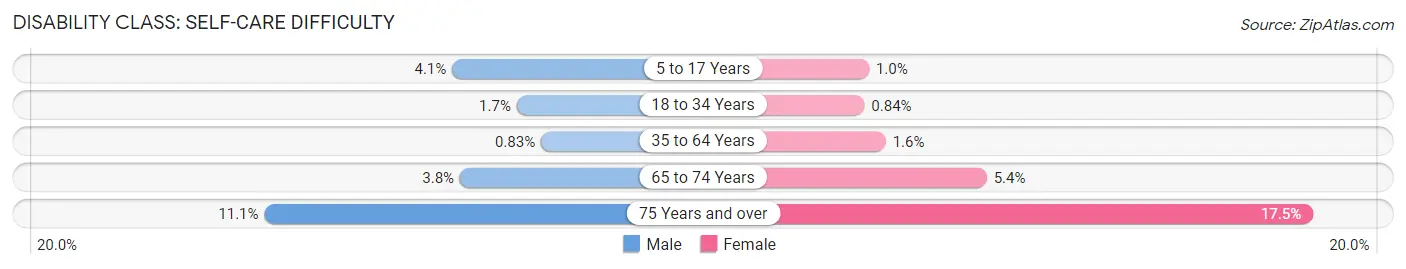
| Age Bracket | Male | Female |
| 5 to 17 Years | 306 (4.1%) | 75 (1.0%) |
| 18 to 34 Years | 149 (1.7%) | 82 (0.8%) |
| 35 to 64 Years | 125 (0.8%) | 296 (1.6%) |
| 65 to 74 Years | 93 (3.8%) | 173 (5.4%) |
| 75 Years and over | 111 (11.1%) | 321 (17.5%) |
Technology Access in Waldorf
Computing Device Access in Waldorf
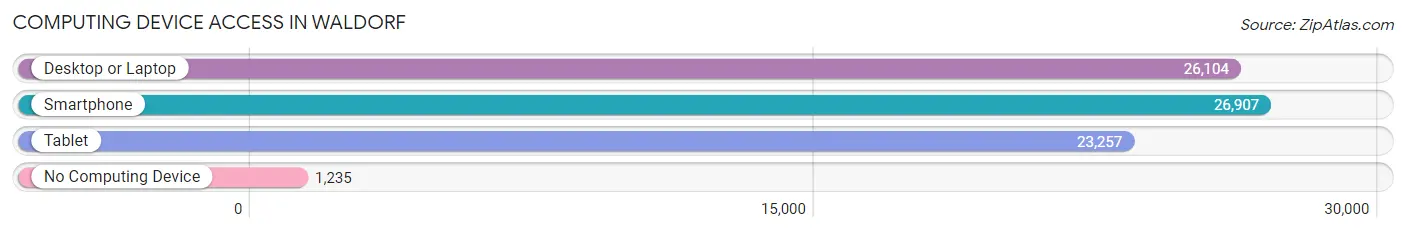
| Device Type | # Households | % Households |
| Desktop or Laptop | 26,104 | 88.5% |
| Smartphone | 26,907 | 91.3% |
| Tablet | 23,257 | 78.9% |
| No Computing Device | 1,235 | 4.2% |
| Total | 29,480 | 100.0% |
Internet Access in Waldorf
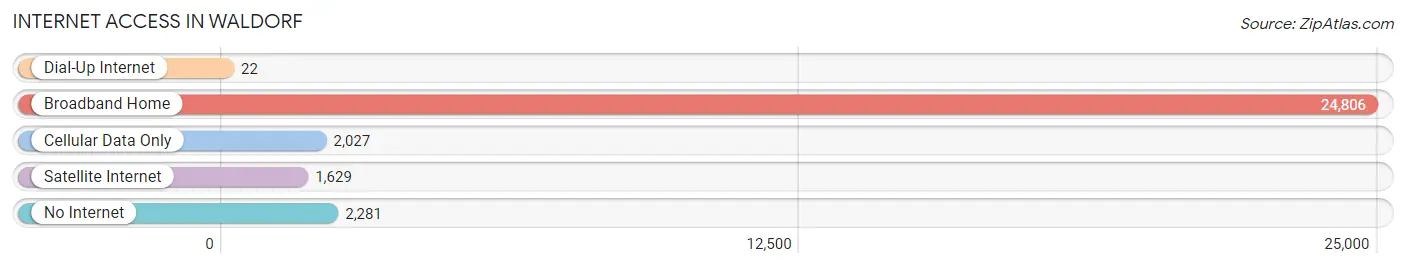
| Internet Type | # Households | % Households |
| Dial-Up Internet | 22 | 0.1% |
| Broadband Home | 24,806 | 84.2% |
| Cellular Data Only | 2,027 | 6.9% |
| Satellite Internet | 1,629 | 5.5% |
| No Internet | 2,281 | 7.7% |
| Total | 29,480 | 100.0% |
Waldorf Summary
Waldorf, Maryland is a census-designated place located in Charles County, Maryland. It is located approximately 25 miles south of Washington, D.C. and is part of the Washington metropolitan area. The population of Waldorf was estimated to be 68,722 in 2019.
History
Waldorf was first settled in the early 1700s by German and English settlers. The area was originally known as Beantown, named after the local Beantown Tavern. In the late 1800s, the area was renamed to Waldorf after the German city of Waldorf. The name was chosen to honor the German settlers who had originally settled in the area.
In the early 1900s, Waldorf began to grow rapidly as a result of the development of the Washington, D.C. metropolitan area. The area was home to a number of farms and small businesses, and the population began to grow. In the 1950s, the area was incorporated as a town and the population continued to grow.
In the late 1970s, Waldorf was designated as a census-designated place. This designation allowed the area to receive federal funding for infrastructure and other services. Since then, Waldorf has continued to grow and develop.
Geography
Waldorf is located in Charles County, Maryland. It is located approximately 25 miles south of Washington, D.C. and is part of the Washington metropolitan area. The area is bordered by the Potomac River to the east and the Patuxent River to the west.
The area is mostly flat, with some rolling hills. The climate is humid subtropical, with hot, humid summers and mild winters. The average annual temperature is around 60 degrees Fahrenheit.
Economy
Waldorf is home to a number of businesses and industries. The area is home to a number of retail stores, restaurants, and other businesses. The area is also home to a number of government agencies, including the U.S. Department of Agriculture and the U.S. Department of Defense.
The area is also home to a number of manufacturing and industrial businesses. The area is home to a number of technology companies, including Northrop Grumman and Lockheed Martin. The area is also home to a number of healthcare providers, including MedStar Health and the University of Maryland Charles Regional Medical Center.
Demographics
As of 2019, the population of Waldorf was estimated to be 68,722. The population is diverse, with a mix of races and ethnicities. The largest racial group is African American, making up 44.3% of the population. White people make up 37.2% of the population, while Hispanic or Latino people make up 11.2%. Other racial groups make up the remaining 7.3%.
The median household income in Waldorf is $87,845, which is higher than the national median of $61,937. The median home value is $310,000, which is higher than the national median of $184,700. The unemployment rate in Waldorf is 3.7%, which is lower than the national average of 3.9%.
Conclusion
Waldorf, Maryland is a census-designated place located in Charles County, Maryland. It is located approximately 25 miles south of Washington, D.C. and is part of the Washington metropolitan area. The population of Waldorf was estimated to be 68,722 in 2019. The area is mostly flat, with some rolling hills, and the climate is humid subtropical. The economy of Waldorf is diverse, with a mix of retail stores, restaurants, government agencies, manufacturing and industrial businesses, and healthcare providers. The population is diverse, with a mix of races and ethnicities. The median household income in Waldorf is $87,845, and the median home value is $310,000. The unemployment rate in Waldorf is 3.7%.
Common Questions
What is the Total Population of Waldorf?
Total Population of Waldorf is 81,077.
What is the Total Male Population of Waldorf?
Total Male Population of Waldorf is 37,948.
What is the Total Female Population of Waldorf?
Total Female Population of Waldorf is 43,129.
What is the Ratio of Males per 100 Females in Waldorf?
There are 87.99 Males per 100 Females in Waldorf.
What is the Ratio of Females per 100 Males in Waldorf?
There are 113.65 Females per 100 Males in Waldorf.
What is the Median Population Age in Waldorf?
Median Population Age in Waldorf is 36.3 Years.
What is the Average Family Size in Waldorf
Average Family Size in Waldorf is 3.2 People.
What is the Average Household Size in Waldorf
Average Household Size in Waldorf is 2.7 People.
What is Per Capita Income in Waldorf?
Per Capita income in Waldorf is $46,663.
What is the Median Family Income in Waldorf?
Median Family Income in Waldorf is $123,252.
What is the Median Household income in Waldorf?
Median Household Income in Waldorf is $111,454.
What is Income or Wage Gap in Waldorf?
Income or Wage Gap in Waldorf is 14.9%.
Women in Waldorf earn 85.1 cents for every dollar earned by a man.
What is Family Income Deficit in Waldorf?
Family Income Deficit in Waldorf is $13,027.
Families that are below poverty line in Waldorf earn $13,027 less on average than the poverty threshold level.
What is Inequality or Gini Index in Waldorf?
Inequality or Gini Index in Waldorf is 0.37.
How Large is the Labor Force in Waldorf?
There are 46,905 People in the Labor Forcein in Waldorf.
What is the Percentage of People in the Labor Force in Waldorf?
73.6% of People are in the Labor Force in Waldorf.
What is the Unemployment Rate in Waldorf?
Unemployment Rate in Waldorf is 5.8%.