Cities with the Highest Percentage of Immigrants from Philippines in Michigan
RELATED REPORTS & OPTIONS
Philippines
Michigan
Compare Cities
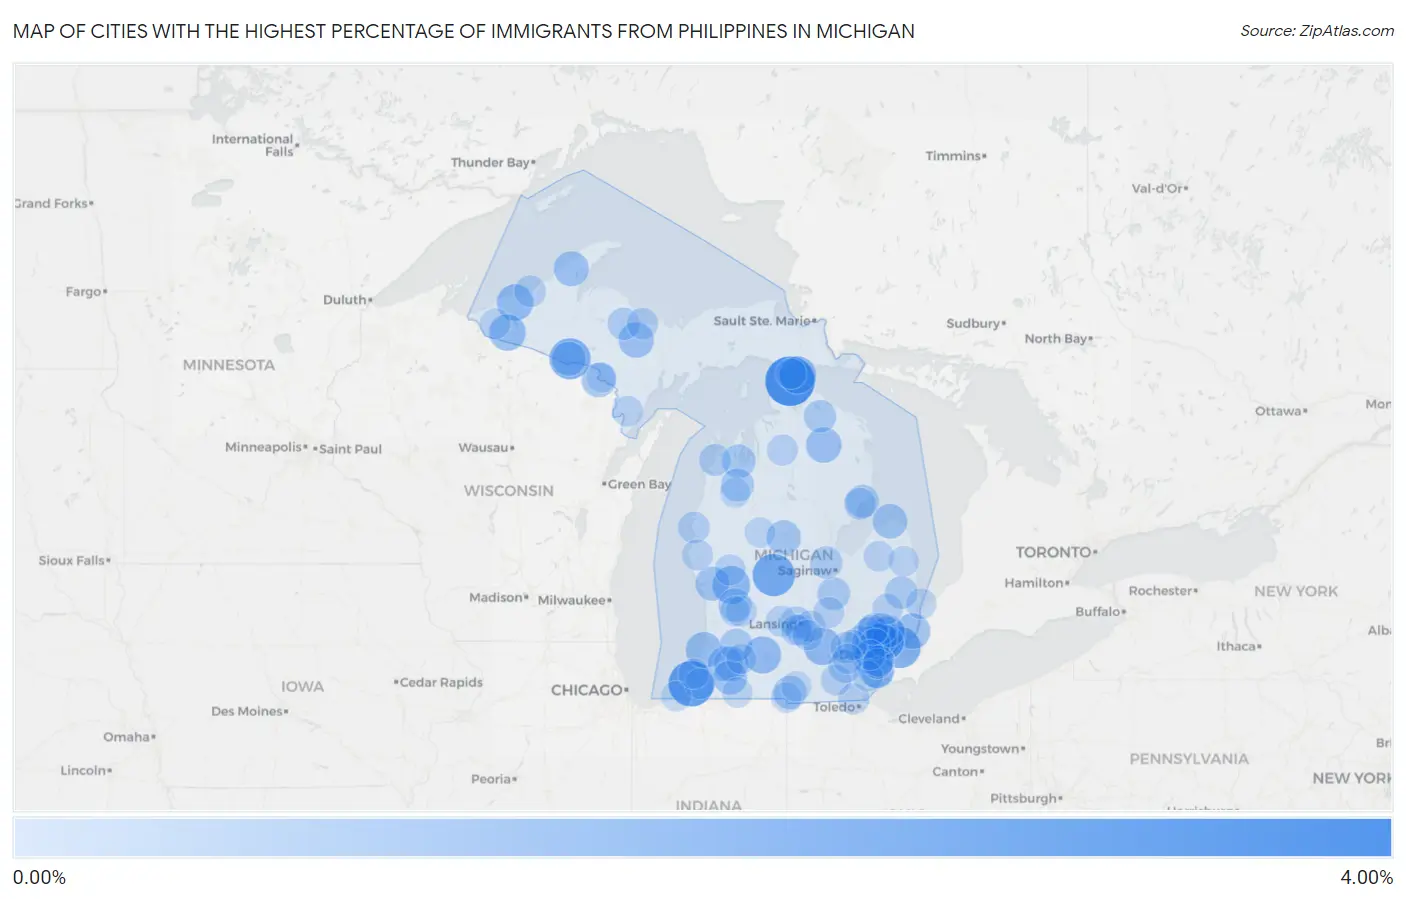
Map of Cities with the Highest Percentage of Immigrants from Philippines in Michigan
0.00%
4.00%
Cities with the Highest Percentage of Immigrants from Philippines in Michigan
| City | Philippines | vs State | vs National | |
| 1. | Mackinaw City | 3.21% | 0.19%(+3.02)#-1 | 0.60%(+2.61)#0 |
| 2. | Baroda | 2.57% | 0.19%(+2.38)#0 | 0.60%(+1.97)#1 |
| 3. | Cambria | 2.09% | 0.19%(+1.90)#1 | 0.60%(+1.49)#2 |
| 4. | Mcbride | 2.08% | 0.19%(+1.89)#2 | 0.60%(+1.48)#3 |
| 5. | Village Of Grosse Pointe Shores | 1.88% | 0.19%(+1.69)#3 | 0.60%(+1.28)#4 |
| 6. | Gaastra | 1.87% | 0.19%(+1.68)#4 | 0.60%(+1.27)#5 |
| 7. | Casnovia | 1.39% | 0.19%(+1.20)#5 | 0.60%(+0.785)#6 |
| 8. | Stockbridge | 1.35% | 0.19%(+1.16)#6 | 0.60%(+0.751)#7 |
| 9. | Mackinac Island | 1.32% | 0.19%(+1.13)#7 | 0.60%(+0.716)#8 |
| 10. | Springfield | 1.29% | 0.19%(+1.10)#8 | 0.60%(+0.691)#32 |
| 11. | White Pine | 1.20% | 0.19%(+1.01)#9 | 0.60%(+0.605)#33 |
| 12. | Marenisco | 1.20% | 0.19%(+1.01)#10 | 0.60%(+0.605)#34 |
| 13. | Sterling Heights | 1.12% | 0.19%(+0.931)#11 | 0.60%(+0.521)#35 |
| 14. | South Haven | 1.10% | 0.19%(+0.910)#12 | 0.60%(+0.501)#36 |
| 15. | Pearl Beach | 1.07% | 0.19%(+0.876)#13 | 0.60%(+0.466)#37 |
| 16. | Atlanta | 1.04% | 0.19%(+0.852)#14 | 0.60%(+0.442)#38 |
| 17. | Gwinn | 1.02% | 0.19%(+0.832)#15 | 0.60%(+0.422)#39 |
| 18. | Woodhaven | 1.01% | 0.19%(+0.820)#16 | 0.60%(+0.411)#40 |
| 19. | Hancock | 0.97% | 0.19%(+0.782)#17 | 0.60%(+0.372)#41 |
| 20. | Paw Paw | 0.93% | 0.19%(+0.744)#18 | 0.60%(+0.335)#42 |
| 21. | Port Austin | 0.90% | 0.19%(+0.710)#19 | 0.60%(+0.300)#43 |
| 22. | Mattawan | 0.90% | 0.19%(+0.706)#20 | 0.60%(+0.297)#44 |
| 23. | Westland | 0.89% | 0.19%(+0.698)#21 | 0.60%(+0.288)#45 |
| 24. | Kingsford | 0.88% | 0.19%(+0.688)#22 | 0.60%(+0.278)#46 |
| 25. | Farwell | 0.87% | 0.19%(+0.681)#23 | 0.60%(+0.272)#47 |
| 26. | Wolf Lake | 0.85% | 0.19%(+0.658)#24 | 0.60%(+0.248)#48 |
| 27. | Marcellus | 0.83% | 0.19%(+0.641)#25 | 0.60%(+0.232)#49 |
| 28. | Caspian | 0.82% | 0.19%(+0.628)#26 | 0.60%(+0.219)#50 |
| 29. | Novi | 0.82% | 0.19%(+0.628)#27 | 0.60%(+0.219)#998 |
| 30. | Greilickville | 0.75% | 0.19%(+0.560)#28 | 0.60%(+0.150)#999 |
| 31. | Reading | 0.75% | 0.19%(+0.556)#29 | 0.60%(+0.146)#1,000 |
| 32. | Madison Heights | 0.74% | 0.19%(+0.550)#30 | 0.60%(+0.140)#1,001 |
| 33. | Keego Harbor | 0.72% | 0.19%(+0.532)#31 | 0.60%(+0.122)#1,002 |
| 34. | Walker | 0.71% | 0.19%(+0.521)#32 | 0.60%(+0.111)#1,003 |
| 35. | Saline | 0.70% | 0.19%(+0.512)#33 | 0.60%(+0.102)#1,004 |
| 36. | Buckley | 0.69% | 0.19%(+0.496)#34 | 0.60%(+0.087)#1,005 |
| 37. | East Tawas | 0.67% | 0.19%(+0.482)#35 | 0.60%(+0.073)#1,006 |
| 38. | Warren | 0.67% | 0.19%(+0.479)#36 | 0.60%(+0.069)#1,191 |
| 39. | New Lothrop | 0.64% | 0.19%(+0.454)#37 | 0.60%(+0.044)#1,192 |
| 40. | Otsego | 0.64% | 0.19%(+0.447)#38 | 0.60%(+0.037)#1,193 |
| 41. | Livonia | 0.63% | 0.19%(+0.444)#39 | 0.60%(+0.034)#1,194 |
| 42. | Yale | 0.63% | 0.19%(+0.444)#40 | 0.60%(+0.034)#1,195 |
| 43. | Troy | 0.62% | 0.19%(+0.432)#41 | 0.60%(+0.022)#1,196 |
| 44. | Onaway | 0.62% | 0.19%(+0.425)#42 | 0.60%(+0.015)#1,197 |
| 45. | Freeland | 0.61% | 0.19%(+0.422)#43 | 0.60%(+0.012)#1,198 |
| 46. | Center Line | 0.59% | 0.19%(+0.399)#44 | 0.60%(-0.011)#1,199 |
| 47. | Ishpeming | 0.57% | 0.19%(+0.375)#45 | 0.60%(-0.034)#1,200 |
| 48. | Allen Park | 0.56% | 0.19%(+0.370)#46 | 0.60%(-0.040)#1,201 |
| 49. | Utica | 0.56% | 0.19%(+0.368)#47 | 0.60%(-0.042)#1,202 |
| 50. | Gibraltar | 0.53% | 0.19%(+0.335)#48 | 0.60%(-0.074)#1,203 |
| 51. | Waverly | 0.52% | 0.19%(+0.328)#49 | 0.60%(-0.081)#1,204 |
| 52. | Tawas City | 0.51% | 0.19%(+0.325)#50 | 0.60%(-0.085)#1,205 |
| 53. | Empire | 0.51% | 0.19%(+0.320)#51 | 0.60%(-0.090)#1,206 |
| 54. | Clawson | 0.50% | 0.19%(+0.311)#52 | 0.60%(-0.099)#1,207 |
| 55. | Farmington Hills | 0.49% | 0.19%(+0.302)#53 | 0.60%(-0.108)#1,208 |
| 56. | Whitmore Lake | 0.48% | 0.19%(+0.290)#54 | 0.60%(-0.119)#1,209 |
| 57. | Ontonagon | 0.47% | 0.19%(+0.275)#55 | 0.60%(-0.135)#1,210 |
| 58. | Ludington | 0.46% | 0.19%(+0.265)#56 | 0.60%(-0.145)#1,211 |
| 59. | Harvey | 0.45% | 0.19%(+0.260)#57 | 0.60%(-0.150)#1,212 |
| 60. | Auburn Hills | 0.45% | 0.19%(+0.257)#58 | 0.60%(-0.152)#1,213 |
| 61. | Rochester Hills | 0.44% | 0.19%(+0.253)#59 | 0.60%(-0.157)#1,214 |
| 62. | Lambertville | 0.42% | 0.19%(+0.226)#60 | 0.60%(-0.183)#1,215 |
| 63. | Okemos | 0.40% | 0.19%(+0.213)#61 | 0.60%(-0.197)#1,216 |
| 64. | Holt | 0.40% | 0.19%(+0.212)#62 | 0.60%(-0.198)#1,217 |
| 65. | Bancroft | 0.40% | 0.19%(+0.210)#63 | 0.60%(-0.200)#1,218 |
| 66. | Lakes Of The North | 0.39% | 0.19%(+0.198)#64 | 0.60%(-0.212)#1,219 |
| 67. | Mulliken | 0.38% | 0.19%(+0.191)#65 | 0.60%(-0.219)#1,220 |
| 68. | Dimondale | 0.37% | 0.19%(+0.181)#66 | 0.60%(-0.229)#1,221 |
| 69. | Tecumseh | 0.37% | 0.19%(+0.179)#67 | 0.60%(-0.231)#1,222 |
| 70. | Newaygo | 0.37% | 0.19%(+0.176)#68 | 0.60%(-0.234)#1,223 |
| 71. | Shelby | 0.36% | 0.19%(+0.167)#69 | 0.60%(-0.243)#1,224 |
| 72. | Kentwood | 0.35% | 0.19%(+0.162)#70 | 0.60%(-0.248)#1,225 |
| 73. | Lincoln Park | 0.35% | 0.19%(+0.159)#71 | 0.60%(-0.251)#1,226 |
| 74. | Kincheloe | 0.33% | 0.19%(+0.144)#72 | 0.60%(-0.265)#1,227 |
| 75. | Wakefield | 0.32% | 0.19%(+0.132)#73 | 0.60%(-0.278)#1,228 |
| 76. | Stephenson | 0.32% | 0.19%(+0.132)#74 | 0.60%(-0.278)#1,229 |
| 77. | Almont | 0.32% | 0.19%(+0.128)#75 | 0.60%(-0.281)#1,230 |
| 78. | Port Huron | 0.31% | 0.19%(+0.122)#76 | 0.60%(-0.288)#1,231 |
| 79. | Cass City | 0.31% | 0.19%(+0.118)#77 | 0.60%(-0.292)#1,232 |
| 80. | Montgomery | 0.31% | 0.19%(+0.116)#78 | 0.60%(-0.294)#1,233 |
| 81. | Mason | 0.30% | 0.19%(+0.112)#79 | 0.60%(-0.298)#1,234 |
| 82. | Carleton | 0.30% | 0.19%(+0.111)#80 | 0.60%(-0.298)#1,235 |
| 83. | Pontiac | 0.30% | 0.19%(+0.109)#81 | 0.60%(-0.301)#1,236 |
| 84. | Berrien Springs | 0.30% | 0.19%(+0.107)#82 | 0.60%(-0.303)#1,237 |
| 85. | New Buffalo | 0.29% | 0.19%(+0.104)#83 | 0.60%(-0.306)#1,238 |
| 86. | Fair Plain | 0.29% | 0.19%(+0.101)#84 | 0.60%(-0.309)#1,239 |
| 87. | Evart | 0.29% | 0.19%(+0.098)#85 | 0.60%(-0.312)#1,240 |
| 88. | Hillsdale | 0.29% | 0.19%(+0.097)#86 | 0.60%(-0.312)#1,241 |
| 89. | Southfield | 0.28% | 0.19%(+0.094)#87 | 0.60%(-0.316)#1,242 |
| 90. | Deckerville | 0.28% | 0.19%(+0.093)#88 | 0.60%(-0.316)#1,243 |
| 91. | Southgate | 0.27% | 0.19%(+0.084)#89 | 0.60%(-0.326)#1,244 |
| 92. | Garden City | 0.27% | 0.19%(+0.082)#90 | 0.60%(-0.328)#1,245 |
| 93. | Constantine | 0.27% | 0.19%(+0.081)#91 | 0.60%(-0.329)#1,246 |
| 94. | St Ignace | 0.27% | 0.19%(+0.079)#92 | 0.60%(-0.331)#1,247 |
| 95. | Mesick | 0.26% | 0.19%(+0.066)#93 | 0.60%(-0.343)#1,248 |
| 96. | South Lyon | 0.25% | 0.19%(+0.064)#94 | 0.60%(-0.345)#1,249 |
| 97. | Wyoming | 0.25% | 0.19%(+0.064)#95 | 0.60%(-0.346)#1,250 |
| 98. | Iron Mountain | 0.25% | 0.19%(+0.063)#96 | 0.60%(-0.347)#1,251 |
| 99. | Kalamazoo | 0.25% | 0.19%(+0.059)#97 | 0.60%(-0.350)#1,252 |
| 100. | Ann Arbor | 0.25% | 0.19%(+0.058)#98 | 0.60%(-0.352)#1,253 |
Common Questions
What are the Top 10 Cities with the Highest Percentage of Immigrants from Philippines in Michigan?
Top 10 Cities with the Highest Percentage of Immigrants from Philippines in Michigan are:
#1
3.21%
#2
2.57%
#3
2.08%
#4
1.88%
#5
1.87%
#6
1.39%
#7
1.35%
#8
1.32%
#9
1.29%
#10
1.20%
What city has the Highest Percentage of Immigrants from Philippines in Michigan?
Mackinaw City has the Highest Percentage of Immigrants from Philippines in Michigan with 3.21%.
What is the Percentage of Immigrants from Philippines in the State of Michigan?
Percentage of Immigrants from Philippines in Michigan is 0.19%.
What is the Percentage of Immigrants from Philippines in the United States?
Percentage of Immigrants from Philippines in the United States is 0.60%.