Cities with the Highest Percentage of Immigrants from Philippines in Minnesota
RELATED REPORTS & OPTIONS
Philippines
Minnesota
Compare Cities
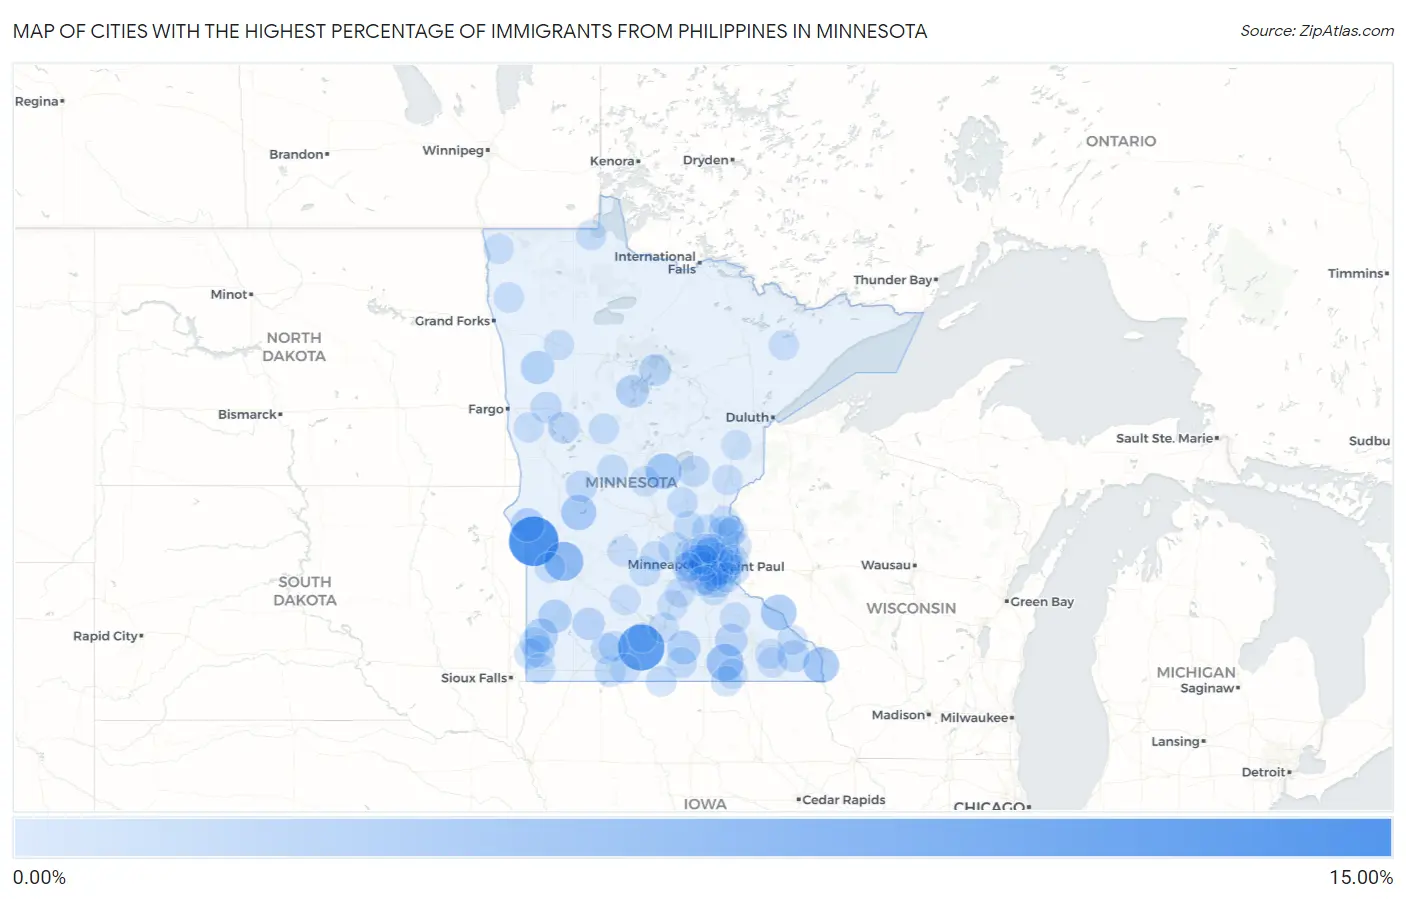
Map of Cities with the Highest Percentage of Immigrants from Philippines in Minnesota
0.00%
15.00%
Cities with the Highest Percentage of Immigrants from Philippines in Minnesota
| City | Philippines | vs State | vs National | |
| 1. | Odessa | 12.37% | 0.17%(+12.2)#-1 | 0.60%(+11.8)#0 |
| 2. | Lewisville | 10.26% | 0.17%(+10.1)#0 | 0.60%(+9.66)#1 |
| 3. | Watson | 5.76% | 0.17%(+5.59)#1 | 0.60%(+5.16)#2 |
| 4. | Lansing | 4.40% | 0.17%(+4.23)#2 | 0.60%(+3.80)#3 |
| 5. | Brownsville | 3.63% | 0.17%(+3.46)#3 | 0.60%(+3.03)#4 |
| 6. | Landfall | 3.61% | 0.17%(+3.44)#4 | 0.60%(+3.01)#5 |
| 7. | Harding | 3.60% | 0.17%(+3.42)#5 | 0.60%(+3.00)#6 |
| 8. | Wabasha | 3.59% | 0.17%(+3.42)#6 | 0.60%(+2.99)#7 |
| 9. | Starbuck | 3.31% | 0.17%(+3.14)#7 | 0.60%(+2.71)#8 |
| 10. | Clinton | 2.46% | 0.17%(+2.29)#8 | 0.60%(+1.87)#9 |
| 11. | Russell | 2.30% | 0.17%(+2.13)#9 | 0.60%(+1.70)#10 |
| 12. | Waldorf | 2.27% | 0.17%(+2.10)#10 | 0.60%(+1.67)#11 |
| 13. | Gary | 2.17% | 0.17%(+1.99)#11 | 0.60%(+1.57)#12 |
| 14. | Holland | 2.17% | 0.17%(+1.99)#12 | 0.60%(+1.57)#13 |
| 15. | Walker | 1.92% | 0.17%(+1.75)#13 | 0.60%(+1.32)#14 |
| 16. | Dodge Center | 1.70% | 0.17%(+1.52)#14 | 0.60%(+1.10)#15 |
| 17. | Revere | 1.56% | 0.17%(+1.39)#15 | 0.60%(+0.963)#16 |
| 18. | Trosky | 1.47% | 0.17%(+1.30)#16 | 0.60%(+0.871)#17 |
| 19. | Rushford | 1.43% | 0.17%(+1.26)#17 | 0.60%(+0.832)#18 |
| 20. | Bena | 1.37% | 0.17%(+1.20)#18 | 0.60%(+0.770)#19 |
| 21. | Pine Springs | 1.35% | 0.17%(+1.18)#19 | 0.60%(+0.755)#20 |
| 22. | Wayzata | 1.35% | 0.17%(+1.18)#20 | 0.60%(+0.752)#21 |
| 23. | Vergas | 1.24% | 0.17%(+1.07)#21 | 0.60%(+0.640)#22 |
| 24. | Wahkon | 1.11% | 0.17%(+0.934)#22 | 0.60%(+0.507)#23 |
| 25. | Mounds View | 1.03% | 0.17%(+0.858)#23 | 0.60%(+0.431)#345 |
| 26. | Lake Park | 1.00% | 0.17%(+0.824)#24 | 0.60%(+0.397)#346 |
| 27. | Garfield | 0.97% | 0.17%(+0.801)#25 | 0.60%(+0.374)#347 |
| 28. | Jackson | 0.91% | 0.17%(+0.736)#26 | 0.60%(+0.309)#348 |
| 29. | Clarissa | 0.89% | 0.17%(+0.715)#27 | 0.60%(+0.288)#349 |
| 30. | Bethel | 0.85% | 0.17%(+0.678)#28 | 0.60%(+0.251)#350 |
| 31. | St Anthony City Hennepin And Ramsey Counties | 0.81% | 0.17%(+0.641)#29 | 0.60%(+0.215)#351 |
| 32. | Bingham Lake | 0.80% | 0.17%(+0.627)#30 | 0.60%(+0.200)#352 |
| 33. | Wells | 0.75% | 0.17%(+0.573)#31 | 0.60%(+0.147)#353 |
| 34. | Stacy | 0.74% | 0.17%(+0.566)#32 | 0.60%(+0.139)#354 |
| 35. | Sunfish Lake | 0.72% | 0.17%(+0.550)#33 | 0.60%(+0.124)#355 |
| 36. | Marine On St Croix | 0.69% | 0.17%(+0.521)#34 | 0.60%(+0.094)#356 |
| 37. | Elmore | 0.69% | 0.17%(+0.515)#35 | 0.60%(+0.088)#357 |
| 38. | Jasper | 0.68% | 0.17%(+0.505)#36 | 0.60%(+0.078)#358 |
| 39. | Pipestone | 0.67% | 0.17%(+0.498)#37 | 0.60%(+0.072)#359 |
| 40. | Dawson | 0.66% | 0.17%(+0.484)#38 | 0.60%(+0.058)#360 |
| 41. | Afton | 0.64% | 0.17%(+0.471)#39 | 0.60%(+0.044)#361 |
| 42. | Buffalo | 0.63% | 0.17%(+0.453)#40 | 0.60%(+0.026)#362 |
| 43. | Lyle | 0.61% | 0.17%(+0.442)#41 | 0.60%(+0.015)#363 |
| 44. | Hutchinson | 0.61% | 0.17%(+0.437)#42 | 0.60%(+0.010)#364 |
| 45. | Zimmerman | 0.61% | 0.17%(+0.436)#43 | 0.60%(+0.009)#365 |
| 46. | Maplewood | 0.59% | 0.17%(+0.421)#44 | 0.60%(-0.006)#366 |
| 47. | Chisago City | 0.59% | 0.17%(+0.419)#45 | 0.60%(-0.008)#367 |
| 48. | Luverne | 0.59% | 0.17%(+0.418)#46 | 0.60%(-0.009)#368 |
| 49. | Mountain Lake | 0.58% | 0.17%(+0.406)#47 | 0.60%(-0.021)#369 |
| 50. | Foreston | 0.58% | 0.17%(+0.404)#48 | 0.60%(-0.023)#370 |
| 51. | Mendota Heights | 0.57% | 0.17%(+0.394)#49 | 0.60%(-0.033)#371 |
| 52. | Sebeka | 0.55% | 0.17%(+0.380)#50 | 0.60%(-0.047)#372 |
| 53. | Farmington | 0.54% | 0.17%(+0.364)#51 | 0.60%(-0.063)#373 |
| 54. | Apple Valley | 0.52% | 0.17%(+0.343)#52 | 0.60%(-0.083)#836 |
| 55. | Fairfax | 0.51% | 0.17%(+0.340)#53 | 0.60%(-0.086)#837 |
| 56. | Hinckley | 0.51% | 0.17%(+0.339)#54 | 0.60%(-0.088)#838 |
| 57. | Babbitt | 0.51% | 0.17%(+0.335)#55 | 0.60%(-0.091)#839 |
| 58. | Wanamingo | 0.50% | 0.17%(+0.332)#56 | 0.60%(-0.095)#840 |
| 59. | Le Sueur | 0.50% | 0.17%(+0.326)#57 | 0.60%(-0.101)#841 |
| 60. | Crystal | 0.49% | 0.17%(+0.315)#58 | 0.60%(-0.112)#842 |
| 61. | Warren | 0.49% | 0.17%(+0.312)#59 | 0.60%(-0.115)#843 |
| 62. | Warroad | 0.48% | 0.17%(+0.309)#60 | 0.60%(-0.118)#844 |
| 63. | West St Paul | 0.48% | 0.17%(+0.303)#61 | 0.60%(-0.124)#845 |
| 64. | New Hope | 0.46% | 0.17%(+0.290)#62 | 0.60%(-0.137)#846 |
| 65. | North Branch | 0.46% | 0.17%(+0.283)#63 | 0.60%(-0.144)#847 |
| 66. | Cokato | 0.43% | 0.17%(+0.260)#64 | 0.60%(-0.167)#848 |
| 67. | Little Falls | 0.43% | 0.17%(+0.256)#65 | 0.60%(-0.170)#849 |
| 68. | Rose Creek | 0.42% | 0.17%(+0.250)#66 | 0.60%(-0.177)#850 |
| 69. | Stockton | 0.41% | 0.17%(+0.242)#67 | 0.60%(-0.185)#851 |
| 70. | Orono | 0.41% | 0.17%(+0.241)#68 | 0.60%(-0.186)#852 |
| 71. | Atwater | 0.41% | 0.17%(+0.240)#69 | 0.60%(-0.187)#853 |
| 72. | Fountain | 0.41% | 0.17%(+0.240)#70 | 0.60%(-0.187)#854 |
| 73. | Corcoran | 0.41% | 0.17%(+0.239)#71 | 0.60%(-0.187)#855 |
| 74. | Maple Grove | 0.41% | 0.17%(+0.236)#72 | 0.60%(-0.190)#856 |
| 75. | Arden Hills | 0.41% | 0.17%(+0.235)#73 | 0.60%(-0.192)#857 |
| 76. | Rosemount | 0.39% | 0.17%(+0.216)#74 | 0.60%(-0.211)#858 |
| 77. | Spring Lake Park | 0.39% | 0.17%(+0.215)#75 | 0.60%(-0.212)#859 |
| 78. | Sherburn | 0.39% | 0.17%(+0.214)#76 | 0.60%(-0.213)#860 |
| 79. | Burnsville | 0.38% | 0.17%(+0.211)#77 | 0.60%(-0.216)#1,015 |
| 80. | Vadnais Heights | 0.38% | 0.17%(+0.208)#78 | 0.60%(-0.219)#1,016 |
| 81. | Hallock | 0.37% | 0.17%(+0.202)#79 | 0.60%(-0.225)#1,017 |
| 82. | Cottage Grove | 0.37% | 0.17%(+0.196)#80 | 0.60%(-0.231)#1,018 |
| 83. | Lindstrom | 0.37% | 0.17%(+0.195)#81 | 0.60%(-0.232)#1,019 |
| 84. | Chanhassen | 0.37% | 0.17%(+0.194)#82 | 0.60%(-0.232)#1,232 |
| 85. | St Louis Park | 0.36% | 0.17%(+0.187)#83 | 0.60%(-0.240)#1,233 |
| 86. | Eagan | 0.36% | 0.17%(+0.186)#84 | 0.60%(-0.241)#1,234 |
| 87. | Mcintosh | 0.36% | 0.17%(+0.183)#85 | 0.60%(-0.243)#1,235 |
| 88. | Plymouth | 0.35% | 0.17%(+0.180)#86 | 0.60%(-0.247)#1,236 |
| 89. | Robbinsdale | 0.35% | 0.17%(+0.173)#87 | 0.60%(-0.254)#1,237 |
| 90. | North Mankato | 0.34% | 0.17%(+0.171)#88 | 0.60%(-0.256)#1,238 |
| 91. | Madelia | 0.34% | 0.17%(+0.167)#89 | 0.60%(-0.260)#1,239 |
| 92. | Blaine | 0.34% | 0.17%(+0.163)#90 | 0.60%(-0.264)#1,240 |
| 93. | Oak Park Heights | 0.33% | 0.17%(+0.161)#91 | 0.60%(-0.266)#1,241 |
| 94. | Chatfield | 0.33% | 0.17%(+0.153)#92 | 0.60%(-0.273)#1,242 |
| 95. | Belle Plaine | 0.33% | 0.17%(+0.153)#93 | 0.60%(-0.274)#1,243 |
| 96. | Barnesville | 0.32% | 0.17%(+0.152)#94 | 0.60%(-0.275)#1,244 |
| 97. | Coon Rapids | 0.32% | 0.17%(+0.146)#95 | 0.60%(-0.281)#1,245 |
| 98. | Spring Park | 0.31% | 0.17%(+0.140)#96 | 0.60%(-0.287)#1,246 |
| 99. | Savage | 0.31% | 0.17%(+0.132)#97 | 0.60%(-0.295)#1,247 |
| 100. | Moose Lake | 0.30% | 0.17%(+0.132)#98 | 0.60%(-0.295)#1,248 |
Common Questions
What are the Top 10 Cities with the Highest Percentage of Immigrants from Philippines in Minnesota?
Top 10 Cities with the Highest Percentage of Immigrants from Philippines in Minnesota are:
#1
12.37%
#2
10.26%
#3
5.76%
#4
4.40%
#5
3.63%
#6
3.61%
#7
3.60%
#8
3.59%
#9
3.31%
#10
2.46%
What city has the Highest Percentage of Immigrants from Philippines in Minnesota?
Odessa has the Highest Percentage of Immigrants from Philippines in Minnesota with 12.37%.
What is the Percentage of Immigrants from Philippines in the State of Minnesota?
Percentage of Immigrants from Philippines in Minnesota is 0.17%.
What is the Percentage of Immigrants from Philippines in the United States?
Percentage of Immigrants from Philippines in the United States is 0.60%.