Cities with the Highest Percentage of Immigrants from Philippines in Virginia
RELATED REPORTS & OPTIONS
Philippines
Virginia
Compare Cities
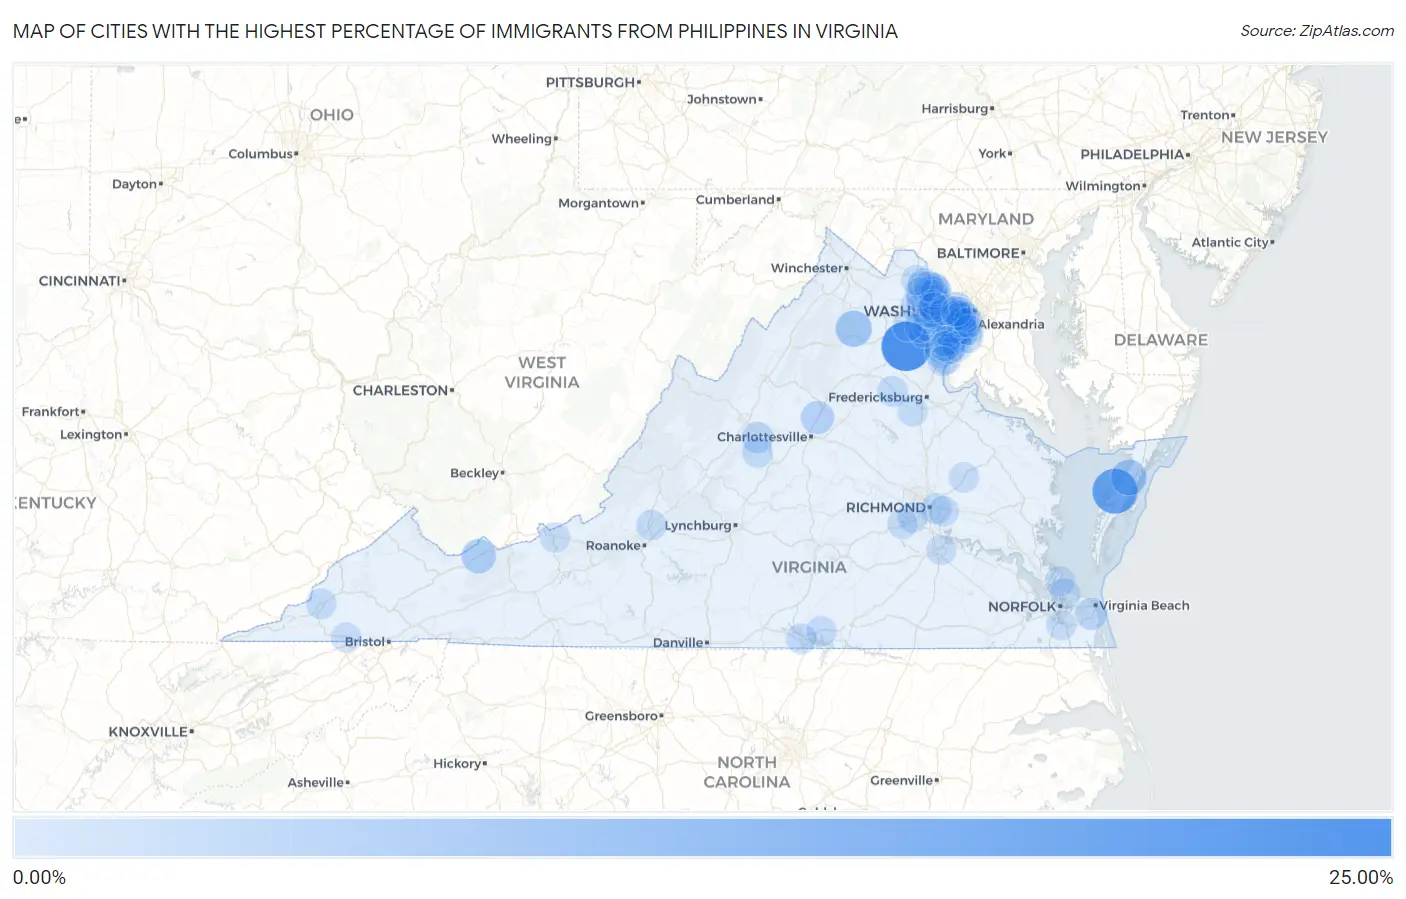
Map of Cities with the Highest Percentage of Immigrants from Philippines in Virginia
0.00%
25.00%
Cities with the Highest Percentage of Immigrants from Philippines in Virginia
| City | Philippines | vs State | vs National | |
| 1. | Catlett | 24.21% | 0.61%(+23.6)#-1 | 0.60%(+23.6)#0 |
| 2. | Bobtown | 18.69% | 0.61%(+18.1)#0 | 0.60%(+18.1)#1 |
| 3. | Flint Hill | 7.84% | 0.61%(+7.23)#1 | 0.60%(+7.24)#2 |
| 4. | Greenbush | 7.38% | 0.61%(+6.77)#2 | 0.60%(+6.78)#3 |
| 5. | Springville | 5.60% | 0.61%(+4.99)#3 | 0.60%(+5.00)#4 |
| 6. | Woodburn | 4.73% | 0.61%(+4.12)#4 | 0.60%(+4.13)#5 |
| 7. | Pimmit Hills | 4.28% | 0.61%(+3.67)#5 | 0.60%(+3.68)#6 |
| 8. | Piney Mountain | 4.18% | 0.61%(+3.57)#6 | 0.60%(+3.58)#7 |
| 9. | North Springfield | 3.17% | 0.61%(+2.56)#7 | 0.60%(+2.57)#11 |
| 10. | Springfield | 3.03% | 0.61%(+2.42)#8 | 0.60%(+2.43)#12 |
| 11. | Rio | 2.89% | 0.61%(+2.28)#9 | 0.60%(+2.29)#13 |
| 12. | Virginia Beach | 2.74% | 0.61%(+2.13)#47 | 0.60%(+2.14)#1,226 |
| 13. | Goose Creek | 2.74% | 0.61%(+2.13)#48 | 0.60%(+2.14)#1,227 |
| 14. | Lorton | 2.70% | 0.61%(+2.09)#49 | 0.60%(+2.10)#1,228 |
| 15. | Oak Grove | 2.61% | 0.61%(+2.00)#50 | 0.60%(+2.01)#1,229 |
| 16. | Stone Ridge | 2.37% | 0.61%(+1.76)#51 | 0.60%(+1.77)#1,230 |
| 17. | Occoquan | 2.33% | 0.61%(+1.72)#52 | 0.60%(+1.73)#1,231 |
| 18. | Lyndhurst | 2.23% | 0.61%(+1.62)#53 | 0.60%(+1.63)#1,232 |
| 19. | Newington | 1.92% | 0.61%(+1.31)#54 | 0.60%(+1.33)#1,233 |
| 20. | Kingstowne | 1.82% | 0.61%(+1.21)#55 | 0.60%(+1.22)#1,234 |
| 21. | Laurel Hill | 1.80% | 0.61%(+1.19)#56 | 0.60%(+1.20)#1,235 |
| 22. | Newington Forest | 1.79% | 0.61%(+1.18)#57 | 0.60%(+1.20)#1,236 |
| 23. | Lansdowne | 1.78% | 0.61%(+1.17)#58 | 0.60%(+1.18)#1,237 |
| 24. | Dulles Town Center | 1.75% | 0.61%(+1.14)#59 | 0.60%(+1.15)#1,238 |
| 25. | Montclair | 1.72% | 0.61%(+1.11)#60 | 0.60%(+1.12)#1,239 |
| 26. | Mount Vernon | 1.67% | 0.61%(+1.06)#61 | 0.60%(+1.07)#1,240 |
| 27. | Kings Park West | 1.66% | 0.61%(+1.05)#62 | 0.60%(+1.06)#1,241 |
| 28. | Leesylvania | 1.62% | 0.61%(+1.01)#63 | 0.60%(+1.02)#1,242 |
| 29. | Franconia | 1.59% | 0.61%(+0.976)#64 | 0.60%(+0.986)#1,243 |
| 30. | Dale City | 1.58% | 0.61%(+0.974)#65 | 0.60%(+0.984)#1,244 |
| 31. | Lake Of The Woods | 1.57% | 0.61%(+0.958)#66 | 0.60%(+0.968)#1,245 |
| 32. | Fairfax | 1.56% | 0.61%(+0.945)#67 | 0.60%(+0.955)#1,246 |
| 33. | The University Of Virginia's College At Wise | 1.54% | 0.61%(+0.928)#68 | 0.60%(+0.939)#1,247 |
| 34. | Montrose | 1.53% | 0.61%(+0.920)#69 | 0.60%(+0.931)#1,248 |
| 35. | Hayfield | 1.53% | 0.61%(+0.916)#70 | 0.60%(+0.926)#1,249 |
| 36. | Norfolk | 1.49% | 0.61%(+0.884)#71 | 0.60%(+0.895)#1,250 |
| 37. | Cherry Hill | 1.49% | 0.61%(+0.883)#72 | 0.60%(+0.893)#1,251 |
| 38. | Merrifield | 1.47% | 0.61%(+0.855)#73 | 0.60%(+0.866)#1,252 |
| 39. | Wintergreen | 1.45% | 0.61%(+0.843)#74 | 0.60%(+0.853)#1,253 |
| 40. | Annandale | 1.41% | 0.61%(+0.798)#75 | 0.60%(+0.808)#1,254 |
| 41. | One Loudoun | 1.37% | 0.61%(+0.757)#76 | 0.60%(+0.768)#1,255 |
| 42. | Countryside | 1.30% | 0.61%(+0.686)#77 | 0.60%(+0.696)#1,256 |
| 43. | West Springfield | 1.28% | 0.61%(+0.669)#78 | 0.60%(+0.680)#1,257 |
| 44. | Woodbridge | 1.23% | 0.61%(+0.622)#79 | 0.60%(+0.632)#1,258 |
| 45. | Falls Church | 1.23% | 0.61%(+0.618)#80 | 0.60%(+0.628)#1,259 |
| 46. | Big Stone Gap | 1.23% | 0.61%(+0.616)#81 | 0.60%(+0.626)#1,260 |
| 47. | Seven Corners | 1.23% | 0.61%(+0.615)#82 | 0.60%(+0.626)#1,261 |
| 48. | Fair Oaks | 1.22% | 0.61%(+0.608)#83 | 0.60%(+0.619)#1,262 |
| 49. | Dunn Loring | 1.21% | 0.61%(+0.596)#84 | 0.60%(+0.606)#1,263 |
| 50. | Rose Hill Cdp Fairfax County | 1.19% | 0.61%(+0.583)#85 | 0.60%(+0.593)#1,264 |
| 51. | Bailey S Crossroads | 1.17% | 0.61%(+0.564)#86 | 0.60%(+0.574)#1,265 |
| 52. | Clarksville | 1.17% | 0.61%(+0.556)#87 | 0.60%(+0.567)#1,266 |
| 53. | Woodlawn Cdp Fairfax County | 1.16% | 0.61%(+0.548)#88 | 0.60%(+0.558)#1,267 |
| 54. | Braddock | 1.15% | 0.61%(+0.538)#89 | 0.60%(+0.548)#1,268 |
| 55. | Long Branch | 1.13% | 0.61%(+0.516)#90 | 0.60%(+0.527)#1,269 |
| 56. | Fair Lakes | 1.12% | 0.61%(+0.511)#91 | 0.60%(+0.522)#1,270 |
| 57. | Manassas | 1.10% | 0.61%(+0.493)#92 | 0.60%(+0.503)#1,271 |
| 58. | Loudoun Valley Estates | 1.08% | 0.61%(+0.474)#93 | 0.60%(+0.485)#1,272 |
| 59. | South Run | 1.08% | 0.61%(+0.470)#94 | 0.60%(+0.481)#1,273 |
| 60. | Boydton | 1.08% | 0.61%(+0.465)#95 | 0.60%(+0.476)#1,274 |
| 61. | Troutville | 1.07% | 0.61%(+0.460)#96 | 0.60%(+0.471)#1,275 |
| 62. | Yorkshire | 1.07% | 0.61%(+0.460)#97 | 0.60%(+0.470)#1,276 |
| 63. | Union Mill | 1.07% | 0.61%(+0.459)#98 | 0.60%(+0.470)#1,277 |
| 64. | Rockwood | 1.05% | 0.61%(+0.442)#99 | 0.60%(+0.453)#1,278 |
| 65. | Centreville | 1.05% | 0.61%(+0.438)#100 | 0.60%(+0.449)#1,279 |
| 66. | Spotsylvania Courthouse | 1.04% | 0.61%(+0.434)#101 | 0.60%(+0.444)#1,280 |
| 67. | Bull Run | 1.01% | 0.61%(+0.401)#102 | 0.60%(+0.411)#1,281 |
| 68. | Lake Barcroft | 0.98% | 0.61%(+0.372)#103 | 0.60%(+0.382)#1,282 |
| 69. | Woodlake | 0.96% | 0.61%(+0.355)#104 | 0.60%(+0.365)#1,283 |
| 70. | Sandston | 0.96% | 0.61%(+0.355)#105 | 0.60%(+0.365)#1,284 |
| 71. | Belmont | 0.95% | 0.61%(+0.340)#106 | 0.60%(+0.351)#1,285 |
| 72. | Central Garage | 0.93% | 0.61%(+0.323)#107 | 0.60%(+0.334)#1,286 |
| 73. | South Riding | 0.92% | 0.61%(+0.313)#108 | 0.60%(+0.324)#1,287 |
| 74. | Greenbriar | 0.92% | 0.61%(+0.309)#109 | 0.60%(+0.319)#1,288 |
| 75. | Sterling | 0.92% | 0.61%(+0.307)#110 | 0.60%(+0.318)#1,289 |
| 76. | Herndon | 0.92% | 0.61%(+0.306)#111 | 0.60%(+0.316)#1,290 |
| 77. | Chantilly | 0.90% | 0.61%(+0.290)#112 | 0.60%(+0.300)#1,291 |
| 78. | Sugarland Run | 0.89% | 0.61%(+0.279)#113 | 0.60%(+0.290)#1,292 |
| 79. | Mason Neck | 0.88% | 0.61%(+0.270)#114 | 0.60%(+0.280)#1,293 |
| 80. | Pearisburg | 0.87% | 0.61%(+0.259)#115 | 0.60%(+0.270)#1,294 |
| 81. | Lincolnia | 0.87% | 0.61%(+0.258)#116 | 0.60%(+0.268)#1,295 |
| 82. | Lake Ridge | 0.85% | 0.61%(+0.240)#117 | 0.60%(+0.250)#1,296 |
| 83. | West Falls Church | 0.84% | 0.61%(+0.228)#118 | 0.60%(+0.239)#1,297 |
| 84. | Triangle | 0.82% | 0.61%(+0.207)#119 | 0.60%(+0.218)#1,298 |
| 85. | Cascades | 0.79% | 0.61%(+0.179)#120 | 0.60%(+0.190)#1,299 |
| 86. | Chesapeake | 0.79% | 0.61%(+0.179)#121 | 0.60%(+0.189)#1,300 |
| 87. | Floris | 0.78% | 0.61%(+0.172)#122 | 0.60%(+0.182)#1,301 |
| 88. | Broadlands | 0.78% | 0.61%(+0.172)#123 | 0.60%(+0.182)#1,302 |
| 89. | University Center | 0.78% | 0.61%(+0.171)#124 | 0.60%(+0.182)#1,303 |
| 90. | Gainesville | 0.76% | 0.61%(+0.150)#125 | 0.60%(+0.160)#1,304 |
| 91. | Leesburg | 0.76% | 0.61%(+0.149)#126 | 0.60%(+0.160)#1,305 |
| 92. | Oakton | 0.76% | 0.61%(+0.148)#127 | 0.60%(+0.159)#1,306 |
| 93. | Weber City | 0.75% | 0.61%(+0.144)#128 | 0.60%(+0.155)#1,307 |
| 94. | Groveton | 0.73% | 0.61%(+0.115)#129 | 0.60%(+0.125)#1,308 |
| 95. | Potomac Mills | 0.72% | 0.61%(+0.112)#130 | 0.60%(+0.122)#1,309 |
| 96. | Franklin Farm | 0.70% | 0.61%(+0.088)#131 | 0.60%(+0.099)#1,310 |
| 97. | Alexandria | 0.70% | 0.61%(+0.087)#132 | 0.60%(+0.098)#1,311 |
| 98. | Hampton | 0.69% | 0.61%(+0.076)#133 | 0.60%(+0.087)#1,312 |
| 99. | Idylwood | 0.67% | 0.61%(+0.064)#134 | 0.60%(+0.075)#1,313 |
| 100. | Fort Lee | 0.66% | 0.61%(+0.050)#135 | 0.60%(+0.060)#1,314 |
Common Questions
What are the Top 10 Cities with the Highest Percentage of Immigrants from Philippines in Virginia?
Top 10 Cities with the Highest Percentage of Immigrants from Philippines in Virginia are:
#1
24.21%
#2
18.69%
#3
7.84%
#4
7.38%
#5
5.60%
#6
4.73%
#7
4.28%
#8
4.18%
#9
3.17%
#10
3.03%
What city has the Highest Percentage of Immigrants from Philippines in Virginia?
Catlett has the Highest Percentage of Immigrants from Philippines in Virginia with 24.21%.
What is the Percentage of Immigrants from Philippines in the State of Virginia?
Percentage of Immigrants from Philippines in Virginia is 0.61%.
What is the Percentage of Immigrants from Philippines in the United States?
Percentage of Immigrants from Philippines in the United States is 0.60%.