Deer Park, MD
Deer Park Map
Deer Park Overview
337
TOTAL POPULATION
159
MALE POPULATION
178
FEMALE POPULATION
89.33
MALES / 100 FEMALES
111.95
FEMALES / 100 MALES
52.5
MEDIAN AGE
2.6
AVG FAMILY SIZE
2.1
AVG HOUSEHOLD SIZE
$27,712
PER CAPITA INCOME
$61,667
AVG FAMILY INCOME
$50,536
AVG HOUSEHOLD INCOME
17.2%
WAGE / INCOME GAP [ % ]
82.8¢/ $1
WAGE / INCOME GAP [ $ ]
$13,993
FAMILY INCOME DEFICIT
0.41
INEQUALITY / GINI INDEX
165
LABOR FORCE [ PEOPLE ]
55.6%
PERCENT IN LABOR FORCE
9.1%
UNEMPLOYMENT RATE
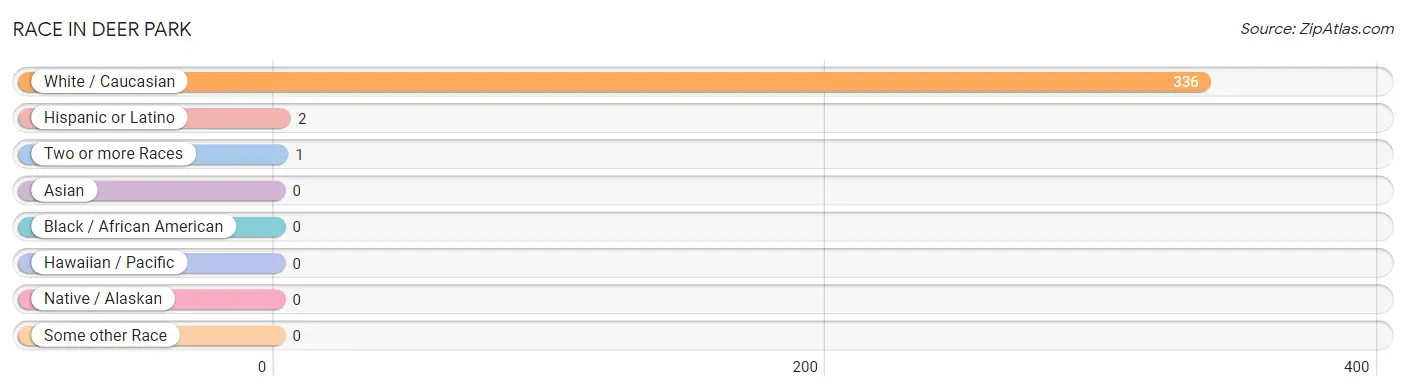
Race in Deer Park
The most populous races in Deer Park are White / Caucasian (336 | 99.7%), Hispanic or Latino (2 | 0.6%), and Two or more Races (1 | 0.3%).
| Race | # Population | % Population |
| Asian | 0 | 0.0% |
| Black / African American | 0 | 0.0% |
| Hawaiian / Pacific | 0 | 0.0% |
| Hispanic or Latino | 2 | 0.6% |
| Native / Alaskan | 0 | 0.0% |
| White / Caucasian | 336 | 99.7% |
| Two or more Races | 1 | 0.3% |
| Some other Race | 0 | 0.0% |
| Total | 337 | 100.0% |
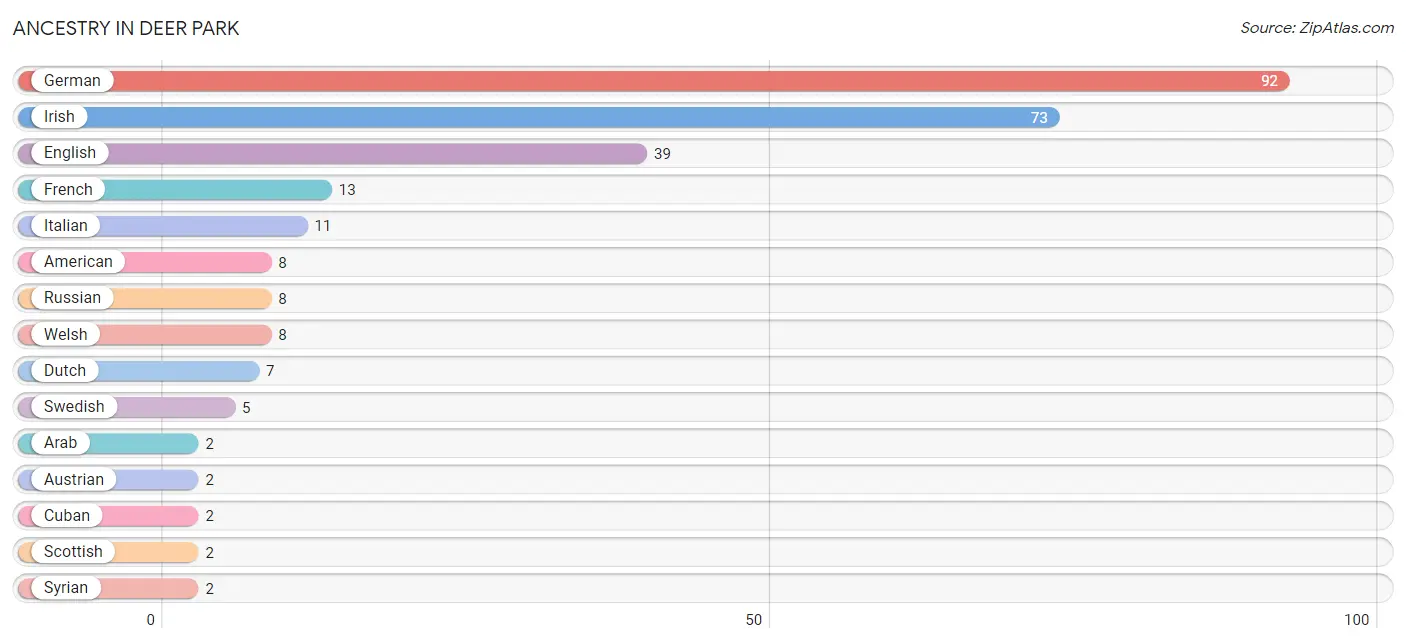
Ancestry in Deer Park
The most populous ancestries reported in Deer Park are German (92 | 27.3%), Irish (73 | 21.7%), English (39 | 11.6%), French (13 | 3.9%), and Italian (11 | 3.3%), together accounting for 67.6% of all Deer Park residents.
| Ancestry | # Population | % Population |
| American | 8 | 2.4% |
| Arab | 2 | 0.6% |
| Austrian | 2 | 0.6% |
| Canadian | 1 | 0.3% |
| Celtic | 1 | 0.3% |
| Cuban | 2 | 0.6% |
| Dutch | 7 | 2.1% |
| English | 39 | 11.6% |
| French | 13 | 3.9% |
| German | 92 | 27.3% |
| Irish | 73 | 21.7% |
| Italian | 11 | 3.3% |
| Norwegian | 1 | 0.3% |
| Russian | 8 | 2.4% |
| Scotch-Irish | 1 | 0.3% |
| Scottish | 2 | 0.6% |
| Slovak | 1 | 0.3% |
| Swedish | 5 | 1.5% |
| Syrian | 2 | 0.6% |
| Ukrainian | 1 | 0.3% |
| Welsh | 8 | 2.4% | View All 21 Rows |
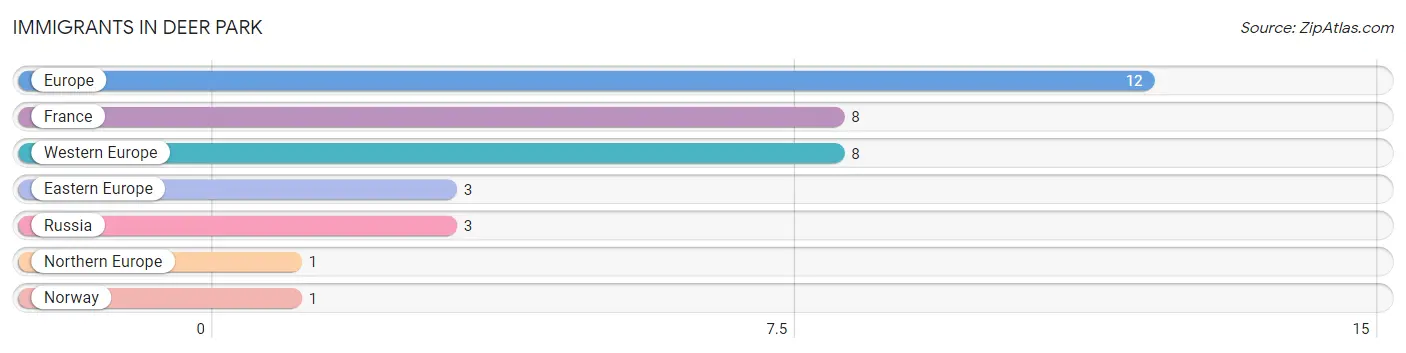
Immigrants in Deer Park
The most numerous immigrant groups reported in Deer Park came from Europe (12 | 3.6%), France (8 | 2.4%), Western Europe (8 | 2.4%), Eastern Europe (3 | 0.9%), and Russia (3 | 0.9%), together accounting for 10.1% of all Deer Park residents.
| Immigration Origin | # Population | % Population |
| Eastern Europe | 3 | 0.9% |
| Europe | 12 | 3.6% |
| France | 8 | 2.4% |
| Northern Europe | 1 | 0.3% |
| Norway | 1 | 0.3% |
| Russia | 3 | 0.9% |
| Western Europe | 8 | 2.4% | View All 7 Rows |
Sex and Age in Deer Park
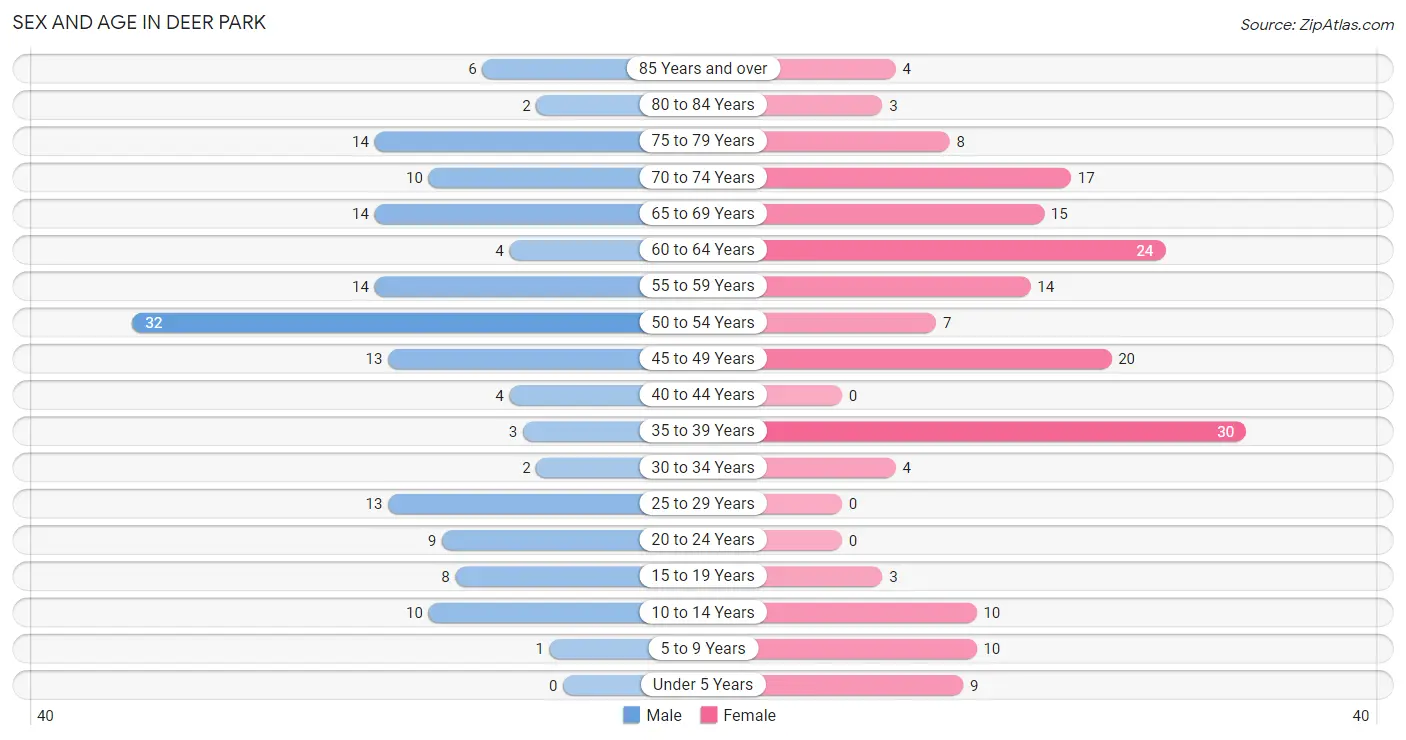
Sex and Age in Deer Park
The most populous age groups in Deer Park are 50 to 54 Years (32 | 20.1%) for men and 35 to 39 Years (30 | 16.9%) for women.
| Age Bracket | Male | Female |
| Under 5 Years | 0 (0.0%) | 9 (5.1%) |
| 5 to 9 Years | 1 (0.6%) | 10 (5.6%) |
| 10 to 14 Years | 10 (6.3%) | 10 (5.6%) |
| 15 to 19 Years | 8 (5.0%) | 3 (1.7%) |
| 20 to 24 Years | 9 (5.7%) | 0 (0.0%) |
| 25 to 29 Years | 13 (8.2%) | 0 (0.0%) |
| 30 to 34 Years | 2 (1.3%) | 4 (2.2%) |
| 35 to 39 Years | 3 (1.9%) | 30 (16.9%) |
| 40 to 44 Years | 4 (2.5%) | 0 (0.0%) |
| 45 to 49 Years | 13 (8.2%) | 20 (11.2%) |
| 50 to 54 Years | 32 (20.1%) | 7 (3.9%) |
| 55 to 59 Years | 14 (8.8%) | 14 (7.9%) |
| 60 to 64 Years | 4 (2.5%) | 24 (13.5%) |
| 65 to 69 Years | 14 (8.8%) | 15 (8.4%) |
| 70 to 74 Years | 10 (6.3%) | 17 (9.6%) |
| 75 to 79 Years | 14 (8.8%) | 8 (4.5%) |
| 80 to 84 Years | 2 (1.3%) | 3 (1.7%) |
| 85 Years and over | 6 (3.8%) | 4 (2.2%) |
| Total | 159 (100.0%) | 178 (100.0%) |
Families and Households in Deer Park
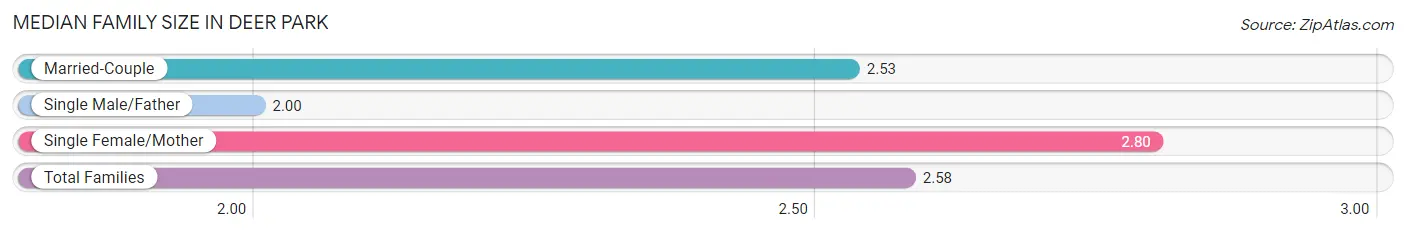
Median Family Size in Deer Park
The median family size in Deer Park is 2.58 persons per family, with single female/mother families (25 | 23.2%) accounting for the largest median family size of 2.8 persons per family. On the other hand, single male/father families (2 | 1.8%) represent the smallest median family size with 2.00 persons per family.
| Family Type | # Families | Family Size |
| Married-Couple | 81 (75.0%) | 2.53 |
| Single Male/Father | 2 (1.8%) | 2.00 |
| Single Female/Mother | 25 (23.2%) | 2.80 |
| Total Families | 108 (100.0%) | 2.58 |
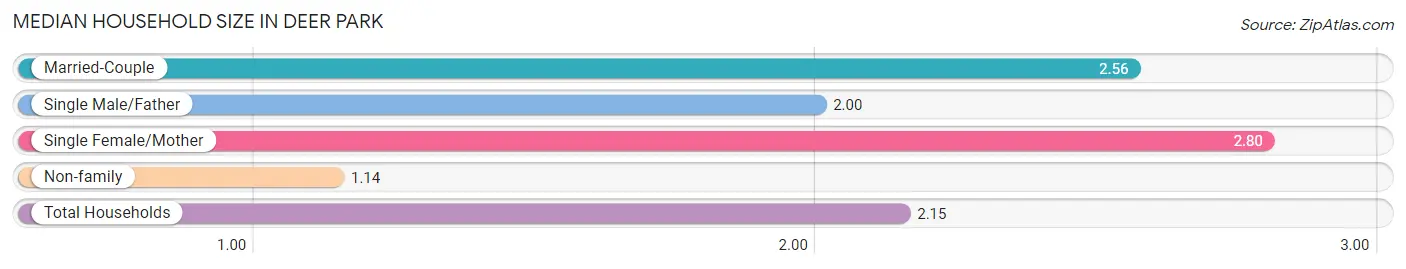
Median Household Size in Deer Park
The median household size in Deer Park is 2.15 persons per household, with single female/mother households (25 | 15.9%) accounting for the largest median household size of 2.8 persons per household. non-family households (49 | 31.2%) represent the smallest median household size with 1.14 persons per household.
| Household Type | # Households | Household Size |
| Married-Couple | 81 (51.6%) | 2.56 |
| Single Male/Father | 2 (1.3%) | 2.00 |
| Single Female/Mother | 25 (15.9%) | 2.80 |
| Non-family | 49 (31.2%) | 1.14 |
| Total Households | 157 (100.0%) | 2.15 |
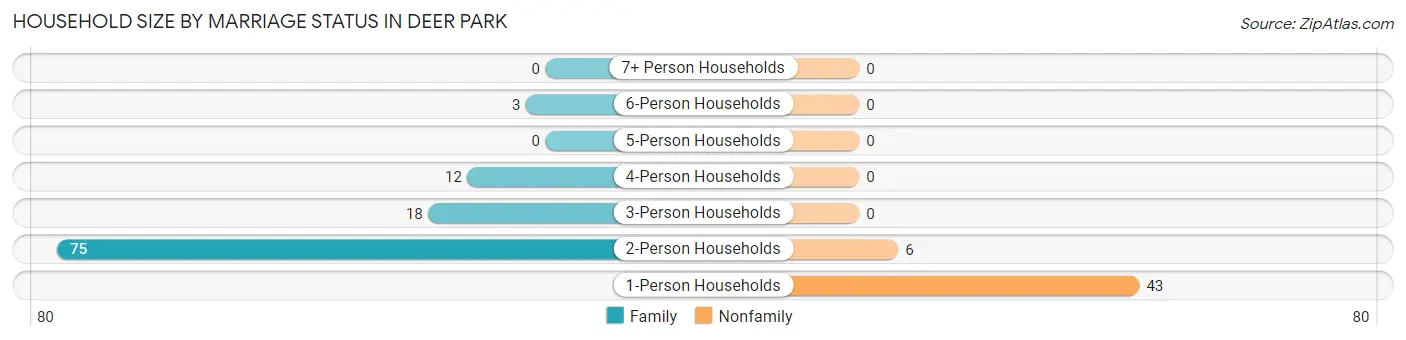
Household Size by Marriage Status in Deer Park
Out of a total of 157 households in Deer Park, 108 (68.8%) are family households, while 49 (31.2%) are nonfamily households. The most numerous type of family households are 2-person households, comprising 75, and the most common type of nonfamily households are 1-person households, comprising 43.
| Household Size | Family Households | Nonfamily Households |
| 1-Person Households | - | 43 (27.4%) |
| 2-Person Households | 75 (47.8%) | 6 (3.8%) |
| 3-Person Households | 18 (11.5%) | 0 (0.0%) |
| 4-Person Households | 12 (7.6%) | 0 (0.0%) |
| 5-Person Households | 0 (0.0%) | 0 (0.0%) |
| 6-Person Households | 3 (1.9%) | 0 (0.0%) |
| 7+ Person Households | 0 (0.0%) | 0 (0.0%) |
| Total | 108 (68.8%) | 49 (31.2%) |
Female Fertility in Deer Park
Fertility by Age in Deer Park
| Age Bracket | Women with Births | Births / 1,000 Women |
| 15 to 19 years | 0 (0.0%) | 0.0 |
| 20 to 34 years | 0 (0.0%) | 0.0 |
| 35 to 50 years | 0 (0.0%) | 0.0 |
| Total | 0 (0.0%) | 0.0 |
Fertility by Age by Marriage Status in Deer Park
| Age Bracket | Married | Unmarried |
| 15 to 19 years | 0 (0.0%) | 0 (0.0%) |
| 20 to 34 years | 0 (0.0%) | 0 (0.0%) |
| 35 to 50 years | 0 (0.0%) | 0 (0.0%) |
| Total | 0 (0.0%) | 0 (0.0%) |
Fertility by Education in Deer Park
| Educational Attainment | Women with Births | Births / 1,000 Women |
| Less than High School | 0 (0.0%) | 0.0 |
| High School Diploma | 0 (0.0%) | 0.0 |
| College or Associate's Degree | 0 (0.0%) | 0.0 |
| Bachelor's Degree | 0 (0.0%) | 0.0 |
| Graduate Degree | 0 (0.0%) | 0.0 |
| Total | 0 (0.0%) | 0.0 |
Fertility by Education by Marriage Status in Deer Park
| Educational Attainment | Married | Unmarried |
| Less than High School | 0 (0.0%) | 0 (0.0%) |
| High School Diploma | 0 (0.0%) | 0 (0.0%) |
| College or Associate's Degree | 0 (0.0%) | 0 (0.0%) |
| Bachelor's Degree | 0 (0.0%) | 0 (0.0%) |
| Graduate Degree | 0 (0.0%) | 0 (0.0%) |
| Total | 0 (0.0%) | 0 (0.0%) |
Income in Deer Park
Income Overview in Deer Park
Per Capita Income in Deer Park is $27,712, while median incomes of families and households are $61,667 and $50,536 respectively.
| Characteristic | Number | Measure |
| Per Capita Income | 337 | $27,712 |
| Median Family Income | 108 | $61,667 |
| Mean Family Income | 108 | $68,973 |
| Median Household Income | 157 | $50,536 |
| Mean Household Income | 157 | $57,703 |
| Income Deficit | 108 | $13,993 |
| Wage / Income Gap (%) | 337 | 17.24% |
| Wage / Income Gap ($) | 337 | 82.76¢ per $1 |
| Gini / Inequality Index | 337 | 0.41 |
Earnings by Sex in Deer Park
Average Earnings in Deer Park are $33,092, $36,250 for men and $30,000 for women, a difference of 17.2%.
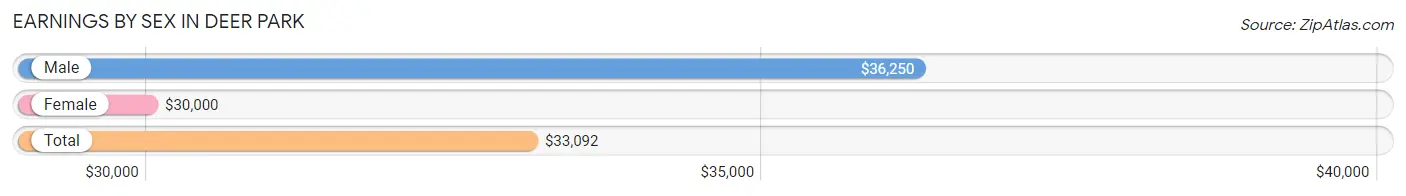
| Sex | Number | Average Earnings |
| Male | 87 (51.5%) | $36,250 |
| Female | 82 (48.5%) | $30,000 |
| Total | 169 (100.0%) | $33,092 |
Earnings by Sex by Income Bracket in Deer Park
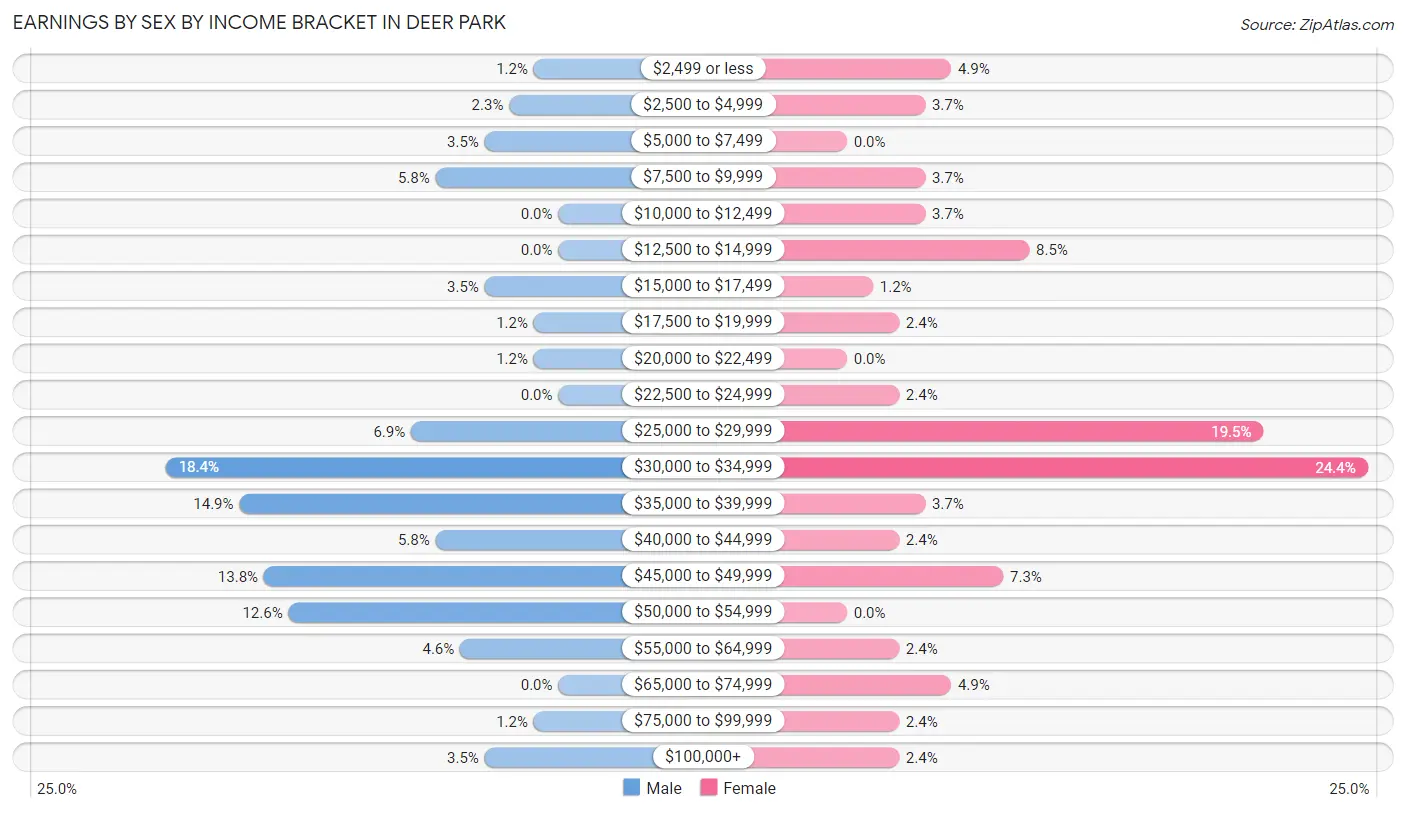
The most common earnings brackets in Deer Park are $30,000 to $34,999 for men (16 | 18.4%) and $30,000 to $34,999 for women (20 | 24.4%).
| Income | Male | Female |
| $2,499 or less | 1 (1.1%) | 4 (4.9%) |
| $2,500 to $4,999 | 2 (2.3%) | 3 (3.7%) |
| $5,000 to $7,499 | 3 (3.5%) | 0 (0.0%) |
| $7,500 to $9,999 | 5 (5.8%) | 3 (3.7%) |
| $10,000 to $12,499 | 0 (0.0%) | 3 (3.7%) |
| $12,500 to $14,999 | 0 (0.0%) | 7 (8.5%) |
| $15,000 to $17,499 | 3 (3.5%) | 1 (1.2%) |
| $17,500 to $19,999 | 1 (1.1%) | 2 (2.4%) |
| $20,000 to $22,499 | 1 (1.1%) | 0 (0.0%) |
| $22,500 to $24,999 | 0 (0.0%) | 2 (2.4%) |
| $25,000 to $29,999 | 6 (6.9%) | 16 (19.5%) |
| $30,000 to $34,999 | 16 (18.4%) | 20 (24.4%) |
| $35,000 to $39,999 | 13 (14.9%) | 3 (3.7%) |
| $40,000 to $44,999 | 5 (5.8%) | 2 (2.4%) |
| $45,000 to $49,999 | 12 (13.8%) | 6 (7.3%) |
| $50,000 to $54,999 | 11 (12.6%) | 0 (0.0%) |
| $55,000 to $64,999 | 4 (4.6%) | 2 (2.4%) |
| $65,000 to $74,999 | 0 (0.0%) | 4 (4.9%) |
| $75,000 to $99,999 | 1 (1.1%) | 2 (2.4%) |
| $100,000+ | 3 (3.5%) | 2 (2.4%) |
| Total | 87 (100.0%) | 82 (100.0%) |
Earnings by Sex by Educational Attainment in Deer Park
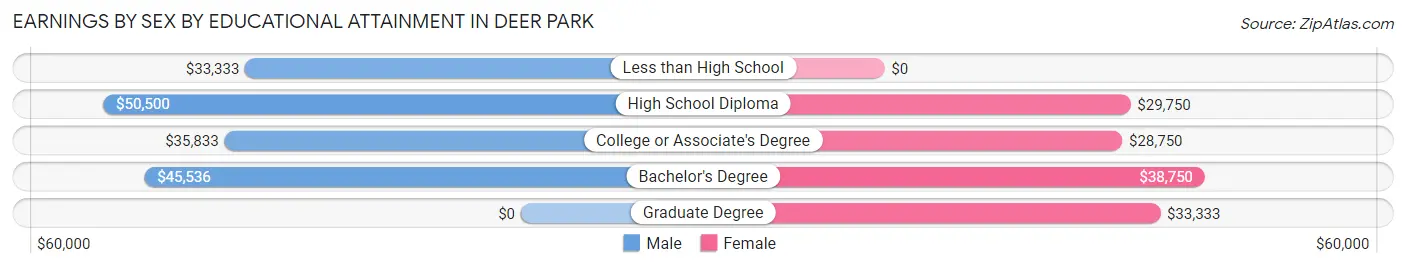
Average earnings in Deer Park are $37,386 for men and $30,000 for women, a difference of 19.8%. Men with an educational attainment of high school diploma enjoy the highest average annual earnings of $50,500, while those with less than high school education earn the least with $33,333. Women with an educational attainment of bachelor's degree earn the most with the average annual earnings of $38,750, while those with college or associate's degree education have the smallest earnings of $28,750.
| Educational Attainment | Male Income | Female Income |
| Less than High School | $33,333 | $0 |
| High School Diploma | $50,500 | $29,750 |
| College or Associate's Degree | $35,833 | $28,750 |
| Bachelor's Degree | $45,536 | $38,750 |
| Graduate Degree | - | - |
| Total | $37,386 | $30,000 |
Family Income in Deer Park
Family Income Brackets in Deer Park
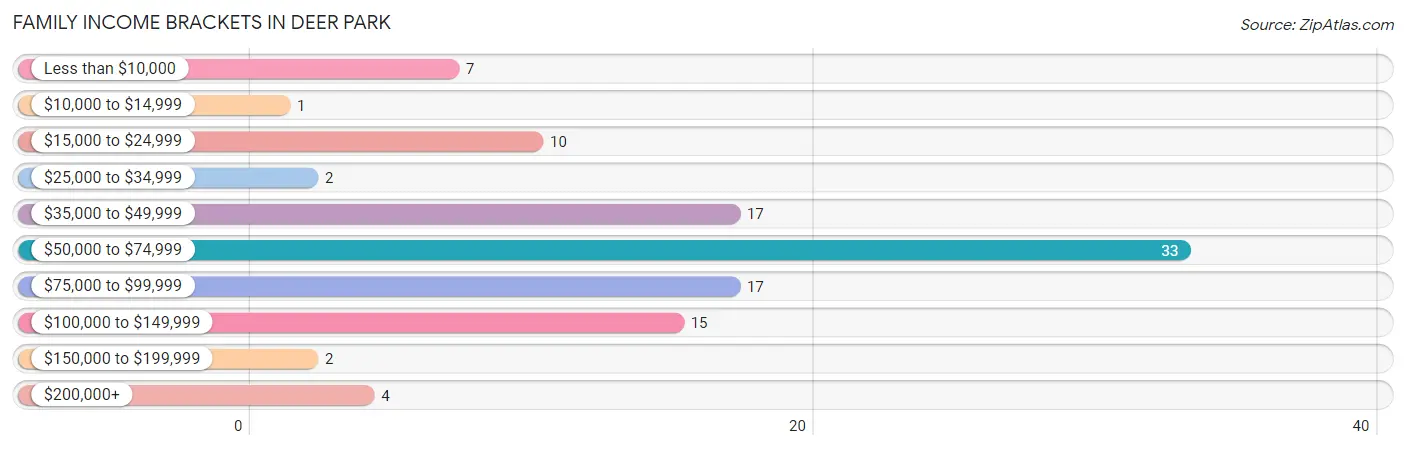
According to the Deer Park family income data, there are 33 families falling into the $50,000 to $74,999 income range, which is the most common income bracket and makes up 30.6% of all families. Conversely, the $10,000 to $14,999 income bracket is the least frequent group with only 1 families (0.9%) belonging to this category.
| Income Bracket | # Families | % Families |
| Less than $10,000 | 7 | 6.5% |
| $10,000 to $14,999 | 1 | 0.9% |
| $15,000 to $24,999 | 10 | 9.3% |
| $25,000 to $34,999 | 2 | 1.9% |
| $35,000 to $49,999 | 17 | 15.7% |
| $50,000 to $74,999 | 33 | 30.6% |
| $75,000 to $99,999 | 17 | 15.7% |
| $100,000 to $149,999 | 15 | 13.9% |
| $150,000 to $199,999 | 2 | 1.9% |
| $200,000+ | 4 | 3.7% |
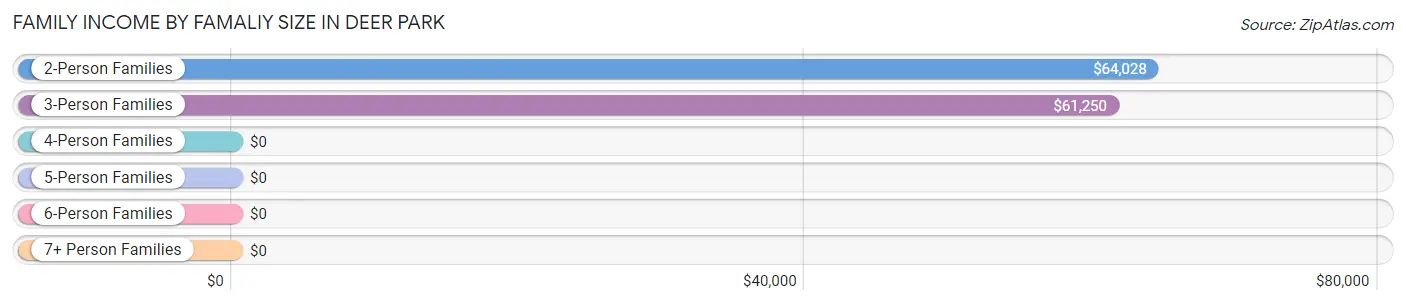
Family Income by Famaliy Size in Deer Park
2-person families (77 | 71.3%) account for the highest median family income in Deer Park with $64,028 per family, while 2-person families (77 | 71.3%) have the highest median income of $32,014 per family member.
| Income Bracket | # Families | Median Income |
| 2-Person Families | 77 (71.3%) | $64,028 |
| 3-Person Families | 16 (14.8%) | $61,250 |
| 4-Person Families | 12 (11.1%) | $0 |
| 5-Person Families | 0 (0.0%) | $0 |
| 6-Person Families | 3 (2.8%) | $0 |
| 7+ Person Families | 0 (0.0%) | $0 |
| Total | 108 (100.0%) | $61,667 |
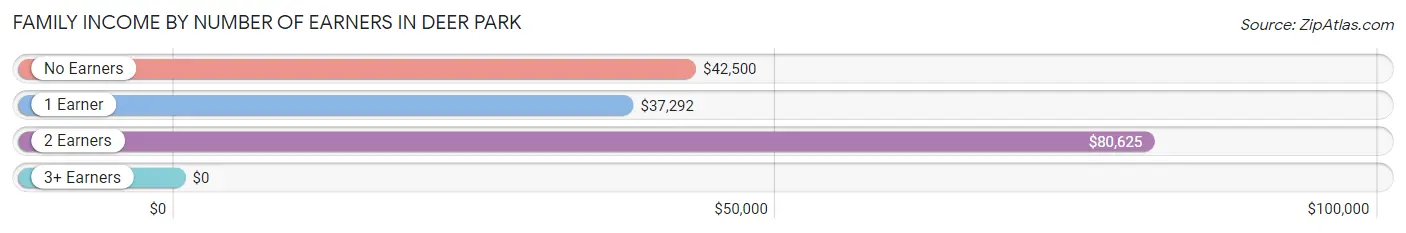
Family Income by Number of Earners in Deer Park
| Number of Earners | # Families | Median Income |
| No Earners | 34 (31.5%) | $42,500 |
| 1 Earner | 21 (19.4%) | $37,292 |
| 2 Earners | 50 (46.3%) | $80,625 |
| 3+ Earners | 3 (2.8%) | $0 |
| Total | 108 (100.0%) | $61,667 |
Household Income in Deer Park
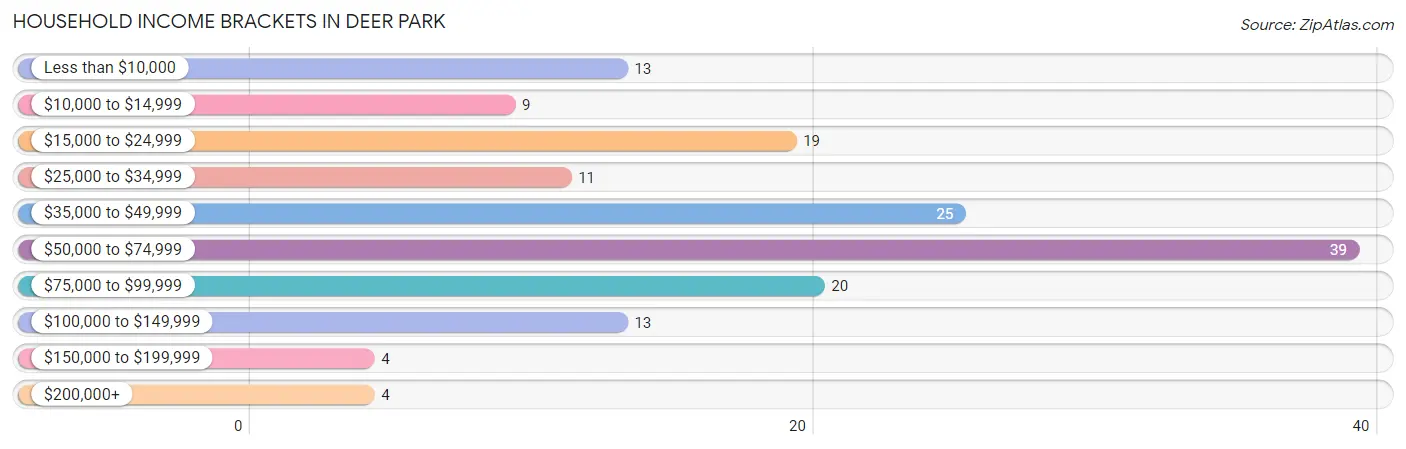
Household Income Brackets in Deer Park
With 39 households falling in the category, the $50,000 to $74,999 income range is the most frequent in Deer Park, accounting for 24.8% of all households. In contrast, only 4 households (2.5%) fall into the $150,000 to $199,999 income bracket, making it the least populous group.
| Income Bracket | # Households | % Households |
| Less than $10,000 | 13 | 8.3% |
| $10,000 to $14,999 | 9 | 5.7% |
| $15,000 to $24,999 | 19 | 12.1% |
| $25,000 to $34,999 | 11 | 7.0% |
| $35,000 to $49,999 | 25 | 15.9% |
| $50,000 to $74,999 | 39 | 24.8% |
| $75,000 to $99,999 | 20 | 12.7% |
| $100,000 to $149,999 | 13 | 8.3% |
| $150,000 to $199,999 | 4 | 2.5% |
| $200,000+ | 4 | 2.5% |
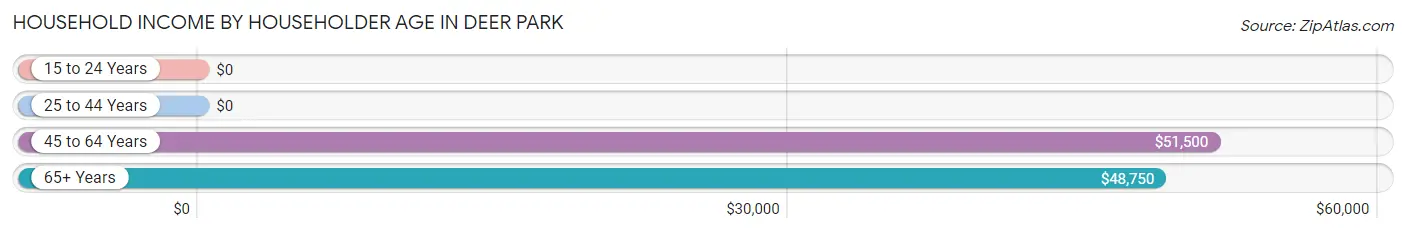
Household Income by Householder Age in Deer Park
The median household income in Deer Park is $50,536, with the highest median household income of $51,500 found in the 45 to 64 years age bracket for the primary householder. A total of 86 households (54.8%) fall into this category.
| Income Bracket | # Households | Median Income |
| 15 to 24 Years | 0 (0.0%) | $0 |
| 25 to 44 Years | 24 (15.3%) | $0 |
| 45 to 64 Years | 86 (54.8%) | $51,500 |
| 65+ Years | 47 (29.9%) | $48,750 |
| Total | 157 (100.0%) | $50,536 |
Poverty in Deer Park
Income Below Poverty by Sex and Age in Deer Park
With 15.7% poverty level for males and 23.6% for females among the residents of Deer Park, 16 and 17 year old males and under 5 year old females are the most vulnerable to poverty, with 3 males (100.0%) and 9 females (100.0%) in their respective age groups living below the poverty level.
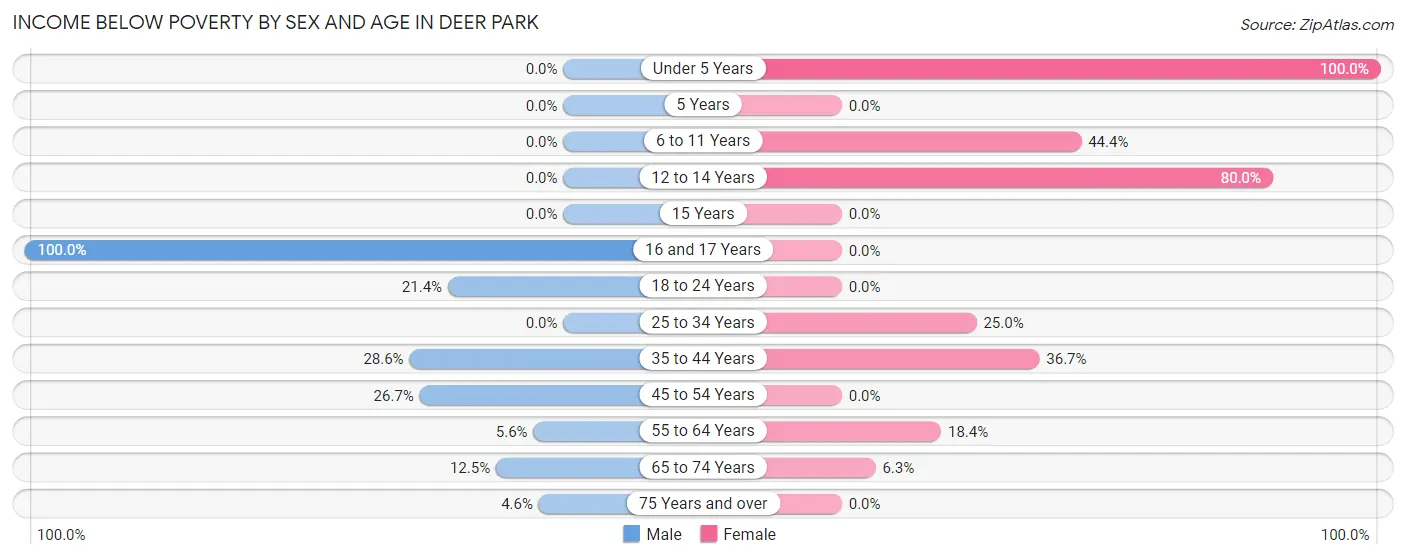
| Age Bracket | Male | Female |
| Under 5 Years | 0 (0.0%) | 9 (100.0%) |
| 5 Years | 0 (0.0%) | 0 (0.0%) |
| 6 to 11 Years | 0 (0.0%) | 4 (44.4%) |
| 12 to 14 Years | 0 (0.0%) | 8 (80.0%) |
| 15 Years | 0 (0.0%) | 0 (0.0%) |
| 16 and 17 Years | 3 (100.0%) | 0 (0.0%) |
| 18 to 24 Years | 3 (21.4%) | 0 (0.0%) |
| 25 to 34 Years | 0 (0.0%) | 1 (25.0%) |
| 35 to 44 Years | 2 (28.6%) | 11 (36.7%) |
| 45 to 54 Years | 12 (26.7%) | 0 (0.0%) |
| 55 to 64 Years | 1 (5.6%) | 7 (18.4%) |
| 65 to 74 Years | 3 (12.5%) | 2 (6.2%) |
| 75 Years and over | 1 (4.5%) | 0 (0.0%) |
| Total | 25 (15.7%) | 42 (23.6%) |
Income Above Poverty by Sex and Age in Deer Park
According to the poverty statistics in Deer Park, males aged 6 to 11 years and females aged 5 years are the age groups that are most secure financially, with 100.0% of males and 100.0% of females in these age groups living above the poverty line.
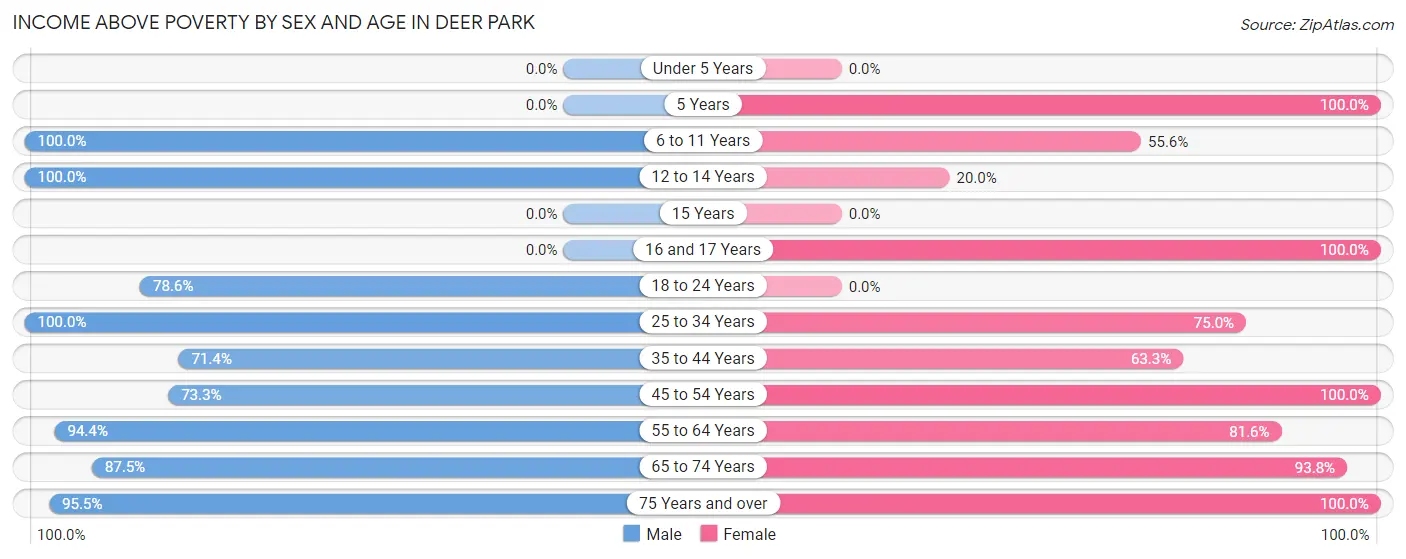
| Age Bracket | Male | Female |
| Under 5 Years | 0 (0.0%) | 0 (0.0%) |
| 5 Years | 0 (0.0%) | 1 (100.0%) |
| 6 to 11 Years | 5 (100.0%) | 5 (55.6%) |
| 12 to 14 Years | 6 (100.0%) | 2 (20.0%) |
| 15 Years | 0 (0.0%) | 0 (0.0%) |
| 16 and 17 Years | 0 (0.0%) | 3 (100.0%) |
| 18 to 24 Years | 11 (78.6%) | 0 (0.0%) |
| 25 to 34 Years | 15 (100.0%) | 3 (75.0%) |
| 35 to 44 Years | 5 (71.4%) | 19 (63.3%) |
| 45 to 54 Years | 33 (73.3%) | 27 (100.0%) |
| 55 to 64 Years | 17 (94.4%) | 31 (81.6%) |
| 65 to 74 Years | 21 (87.5%) | 30 (93.8%) |
| 75 Years and over | 21 (95.5%) | 15 (100.0%) |
| Total | 134 (84.3%) | 136 (76.4%) |
Income Below Poverty Among Married-Couple Families in Deer Park
The poverty statistics for married-couple families in Deer Park show that 8.6% or 7 of the total 81 families live below the poverty line. Families with 3 or 4 children have the highest poverty rate of 100.0%, comprising of 3 families. On the other hand, families with 1 or 2 children have the lowest poverty rate of 0.0%, which includes 0 families.
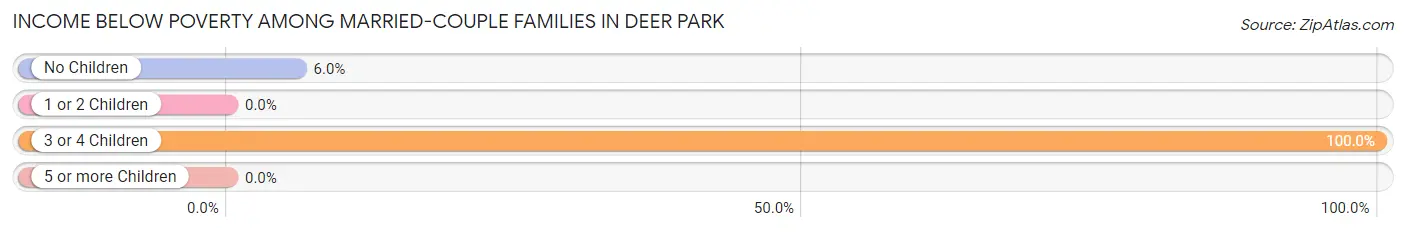
| Children | Above Poverty | Below Poverty |
| No Children | 63 (94.0%) | 4 (6.0%) |
| 1 or 2 Children | 11 (100.0%) | 0 (0.0%) |
| 3 or 4 Children | 0 (0.0%) | 3 (100.0%) |
| 5 or more Children | 0 (0.0%) | 0 (0.0%) |
| Total | 74 (91.4%) | 7 (8.6%) |
Income Below Poverty Among Single-Parent Households in Deer Park
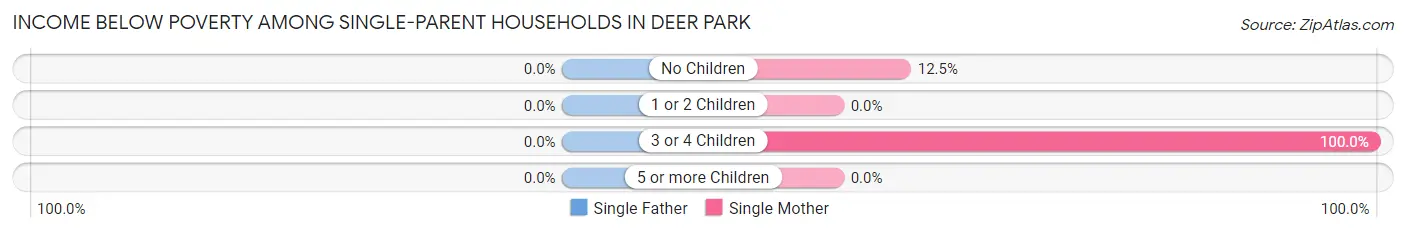
| Children | Single Father | Single Mother |
| No Children | 0 (0.0%) | 2 (12.5%) |
| 1 or 2 Children | 0 (0.0%) | 0 (0.0%) |
| 3 or 4 Children | 0 (0.0%) | 5 (100.0%) |
| 5 or more Children | 0 (0.0%) | 0 (0.0%) |
| Total | 0 (0.0%) | 7 (28.0%) |
Income Below Poverty Among Married-Couple vs Single-Parent Households in Deer Park
The poverty data for Deer Park shows that 7 of the married-couple family households (8.6%) and 7 of the single-parent households (25.9%) are living below the poverty level. Within the married-couple family households, those with 3 or 4 children have the highest poverty rate, with 3 households (100.0%) falling below the poverty line. Among the single-parent households, those with 3 or 4 children have the highest poverty rate, with 5 household (100.0%) living below poverty.
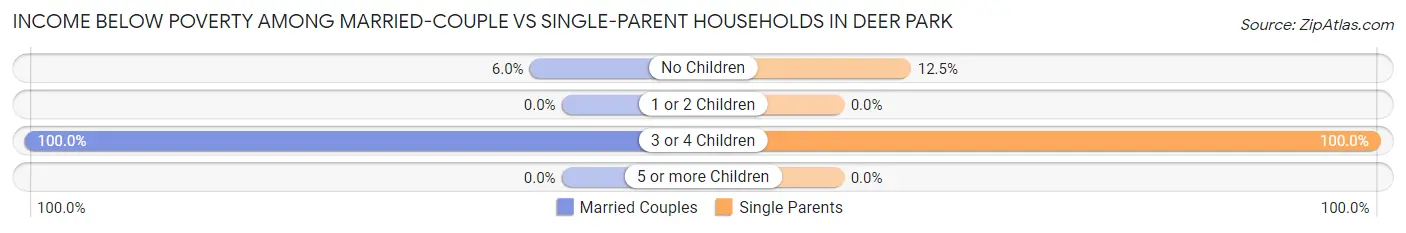
| Children | Married-Couple Families | Single-Parent Households |
| No Children | 4 (6.0%) | 2 (12.5%) |
| 1 or 2 Children | 0 (0.0%) | 0 (0.0%) |
| 3 or 4 Children | 3 (100.0%) | 5 (100.0%) |
| 5 or more Children | 0 (0.0%) | 0 (0.0%) |
| Total | 7 (8.6%) | 7 (25.9%) |
Employment Characteristics in Deer Park
Employment by Class of Employer in Deer Park
Among the 148 employed individuals in Deer Park, private company employees (99 | 66.9%), local government employees (24 | 16.2%), and not-for-profit organizations (10 | 6.8%) make up the most common classes of employment.
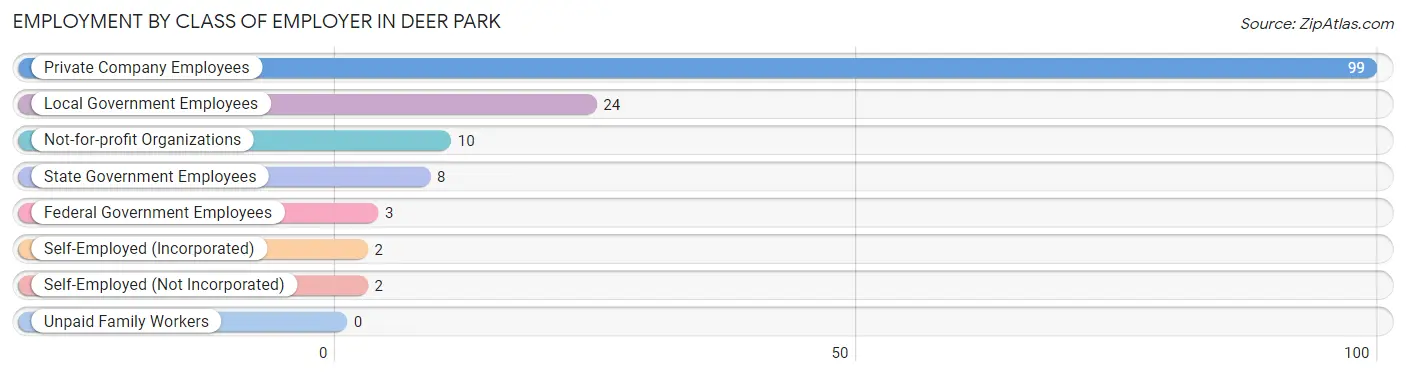
| Employer Class | # Employees | % Employees |
| Private Company Employees | 99 | 66.9% |
| Self-Employed (Incorporated) | 2 | 1.3% |
| Self-Employed (Not Incorporated) | 2 | 1.3% |
| Not-for-profit Organizations | 10 | 6.8% |
| Local Government Employees | 24 | 16.2% |
| State Government Employees | 8 | 5.4% |
| Federal Government Employees | 3 | 2.0% |
| Unpaid Family Workers | 0 | 0.0% |
| Total | 148 | 100.0% |
Employment Status by Age in Deer Park
According to the labor force statistics for Deer Park, out of the total population over 16 years of age (297), 55.6% or 165 individuals are in the labor force, with 9.1% or 15 of them unemployed. The age group with the highest labor force participation rate is 45 to 54 years, with 91.7% or 66 individuals in the labor force. Within the labor force, the 75 years and over age range has the highest percentage of unemployed individuals, with 100.0% or 1 of them being unemployed.
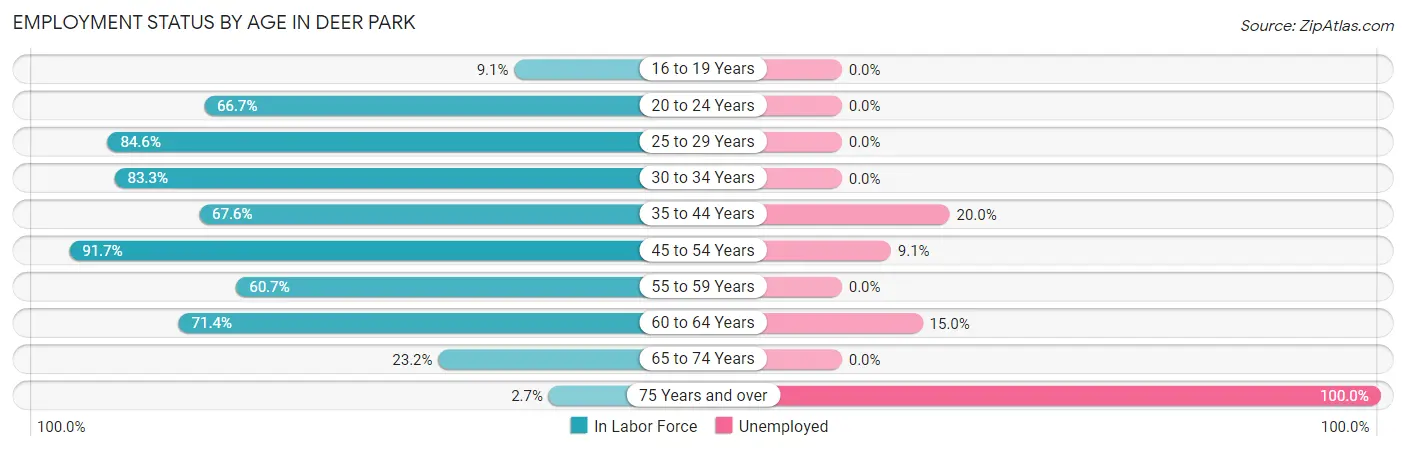
| Age Bracket | In Labor Force | Unemployed |
| 16 to 19 Years | 1 (9.1%) | 0 (0.0%) |
| 20 to 24 Years | 6 (66.7%) | 0 (0.0%) |
| 25 to 29 Years | 11 (84.6%) | 0 (0.0%) |
| 30 to 34 Years | 5 (83.3%) | 0 (0.0%) |
| 35 to 44 Years | 25 (67.6%) | 5 (20.0%) |
| 45 to 54 Years | 66 (91.7%) | 6 (9.1%) |
| 55 to 59 Years | 17 (60.7%) | 0 (0.0%) |
| 60 to 64 Years | 20 (71.4%) | 3 (15.0%) |
| 65 to 74 Years | 13 (23.2%) | 0 (0.0%) |
| 75 Years and over | 1 (2.7%) | 1 (100.0%) |
| Total | 165 (55.6%) | 15 (9.1%) |
Employment Status by Educational Attainment in Deer Park
According to labor force statistics for Deer Park, 78.3% of individuals (144) out of the total population between 25 and 64 years of age (184) are in the labor force, with 9.7% or 14 of them being unemployed. The group with the highest labor force participation rate are those with the educational attainment of bachelor's degree or higher, with 100.0% or 26 individuals in the labor force. Within the labor force, individuals with high school diploma education have the highest percentage of unemployment, with 20.0% or 12 of them being unemployed.
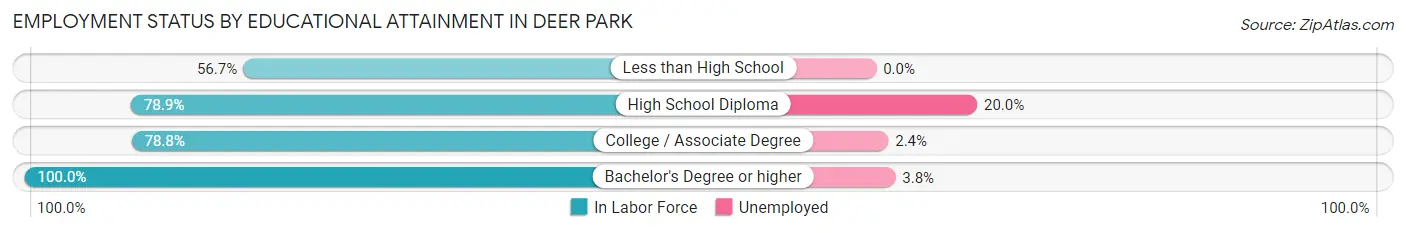
| Educational Attainment | In Labor Force | Unemployed |
| Less than High School | 17 (56.7%) | 0 (0.0%) |
| High School Diploma | 60 (78.9%) | 15 (20.0%) |
| College / Associate Degree | 41 (78.8%) | 1 (2.4%) |
| Bachelor's Degree or higher | 26 (100.0%) | 1 (3.8%) |
| Total | 144 (78.3%) | 18 (9.7%) |
Employment Occupations by Sex in Deer Park
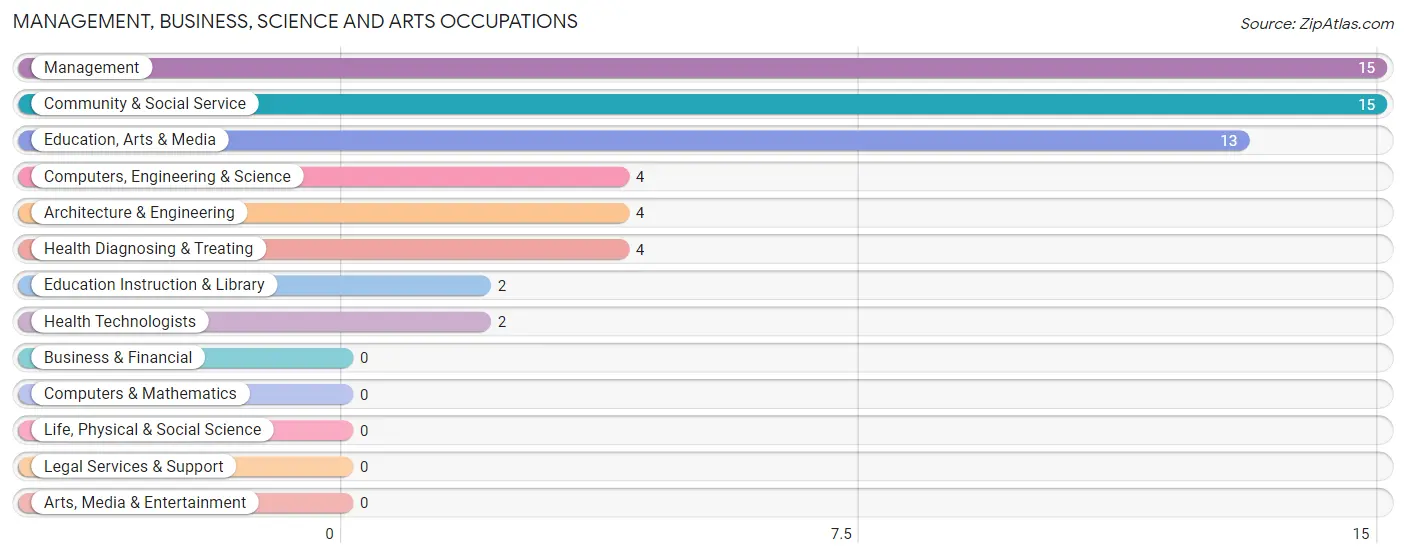
Management, Business, Science and Arts Occupations
The most common Management, Business, Science and Arts occupations in Deer Park are Management (15 | 10.0%), Community & Social Service (15 | 10.0%), Education, Arts & Media (13 | 8.7%), Computers, Engineering & Science (4 | 2.7%), and Architecture & Engineering (4 | 2.7%).
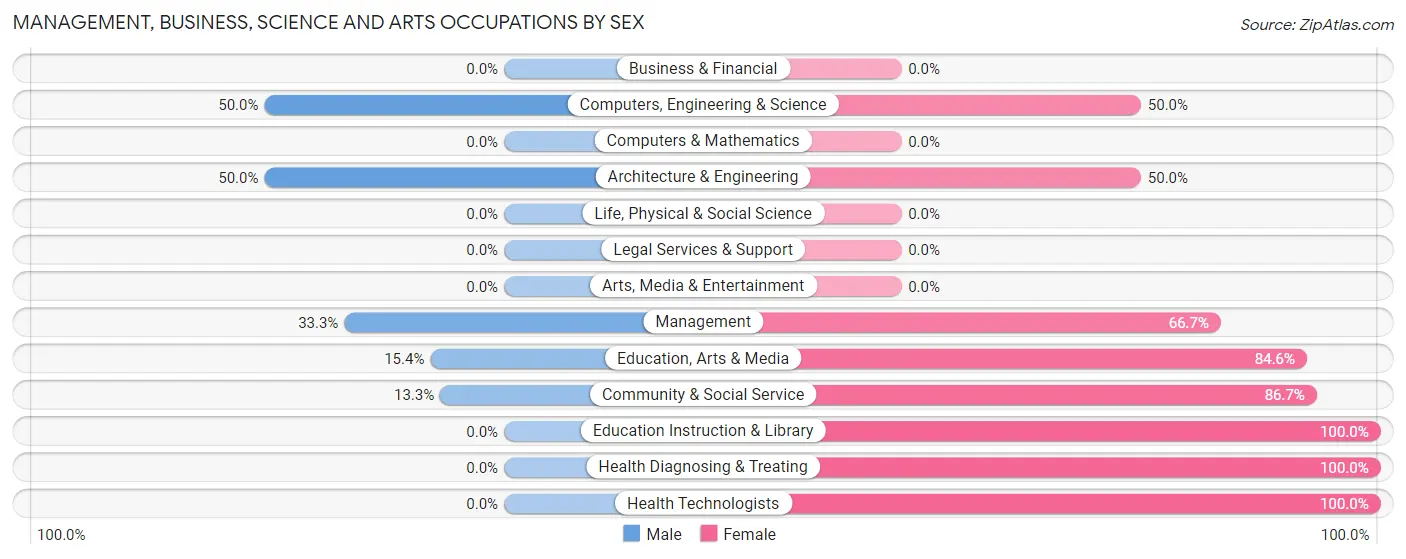
Management, Business, Science and Arts Occupations by Sex
Within the Management, Business, Science and Arts occupations in Deer Park, the most male-oriented occupations are Computers, Engineering & Science (50.0%), Architecture & Engineering (50.0%), and Management (33.3%), while the most female-oriented occupations are Education Instruction & Library (100.0%), Health Diagnosing & Treating (100.0%), and Health Technologists (100.0%).
| Occupation | Male | Female |
| Management | 5 (33.3%) | 10 (66.7%) |
| Business & Financial | 0 (0.0%) | 0 (0.0%) |
| Computers, Engineering & Science | 2 (50.0%) | 2 (50.0%) |
| Computers & Mathematics | 0 (0.0%) | 0 (0.0%) |
| Architecture & Engineering | 2 (50.0%) | 2 (50.0%) |
| Life, Physical & Social Science | 0 (0.0%) | 0 (0.0%) |
| Community & Social Service | 2 (13.3%) | 13 (86.7%) |
| Education, Arts & Media | 2 (15.4%) | 11 (84.6%) |
| Legal Services & Support | 0 (0.0%) | 0 (0.0%) |
| Education Instruction & Library | 0 (0.0%) | 2 (100.0%) |
| Arts, Media & Entertainment | 0 (0.0%) | 0 (0.0%) |
| Health Diagnosing & Treating | 0 (0.0%) | 4 (100.0%) |
| Health Technologists | 0 (0.0%) | 2 (100.0%) |
| Total (Category) | 9 (23.7%) | 29 (76.3%) |
| Total (Overall) | 79 (52.7%) | 71 (47.3%) |
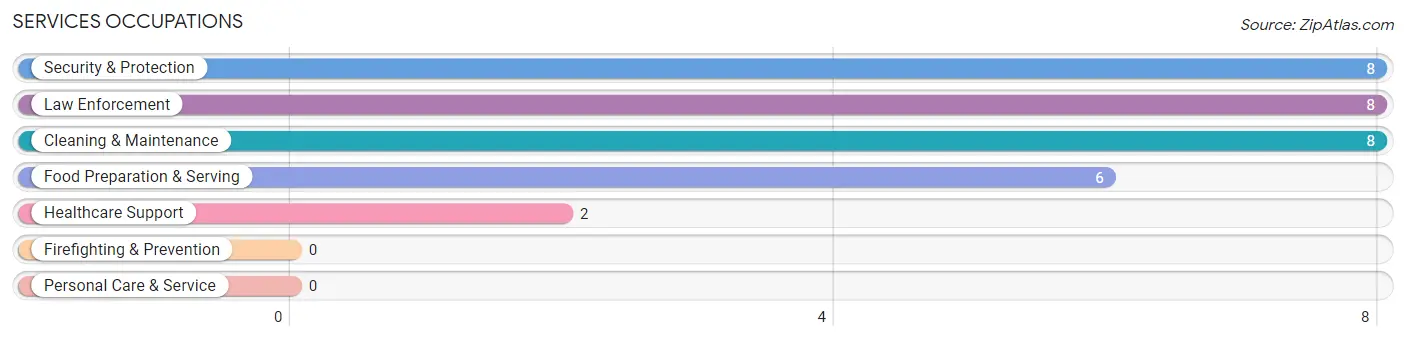
Services Occupations
The most common Services occupations in Deer Park are Security & Protection (8 | 5.3%), Law Enforcement (8 | 5.3%), Cleaning & Maintenance (8 | 5.3%), Food Preparation & Serving (6 | 4.0%), and Healthcare Support (2 | 1.3%).
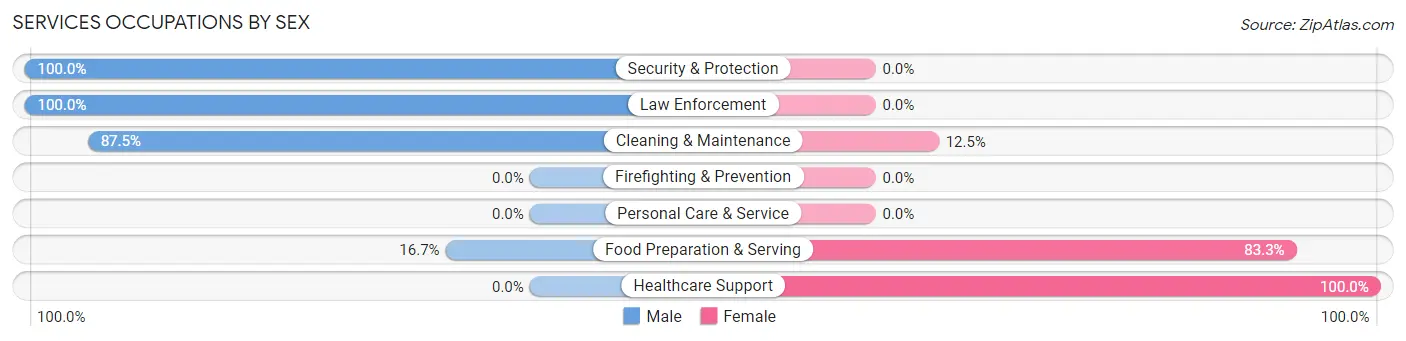
Services Occupations by Sex
Within the Services occupations in Deer Park, the most male-oriented occupations are Security & Protection (100.0%), Law Enforcement (100.0%), and Cleaning & Maintenance (87.5%), while the most female-oriented occupations are Healthcare Support (100.0%), Food Preparation & Serving (83.3%), and Cleaning & Maintenance (12.5%).
| Occupation | Male | Female |
| Healthcare Support | 0 (0.0%) | 2 (100.0%) |
| Security & Protection | 8 (100.0%) | 0 (0.0%) |
| Firefighting & Prevention | 0 (0.0%) | 0 (0.0%) |
| Law Enforcement | 8 (100.0%) | 0 (0.0%) |
| Food Preparation & Serving | 1 (16.7%) | 5 (83.3%) |
| Cleaning & Maintenance | 7 (87.5%) | 1 (12.5%) |
| Personal Care & Service | 0 (0.0%) | 0 (0.0%) |
| Total (Category) | 16 (66.7%) | 8 (33.3%) |
| Total (Overall) | 79 (52.7%) | 71 (47.3%) |
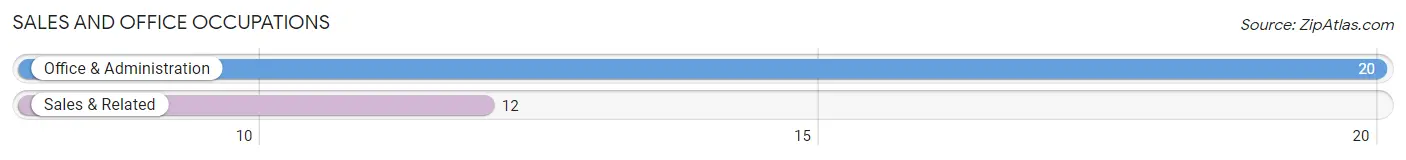
Sales and Office Occupations
The most common Sales and Office occupations in Deer Park are Office & Administration (20 | 13.3%), and Sales & Related (12 | 8.0%).
Sales and Office Occupations by Sex
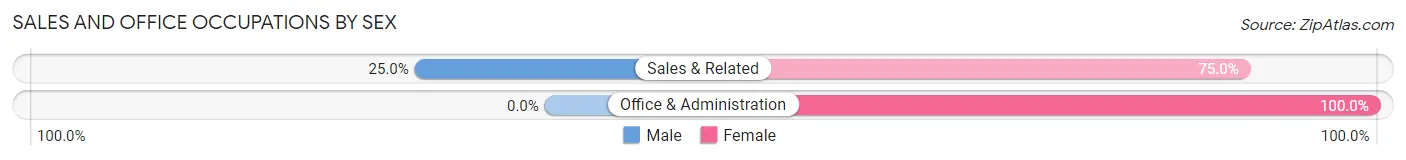
| Occupation | Male | Female |
| Sales & Related | 3 (25.0%) | 9 (75.0%) |
| Office & Administration | 0 (0.0%) | 20 (100.0%) |
| Total (Category) | 3 (9.4%) | 29 (90.6%) |
| Total (Overall) | 79 (52.7%) | 71 (47.3%) |
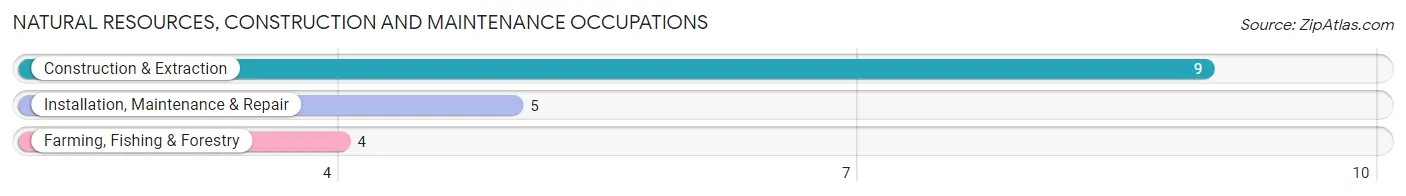
Natural Resources, Construction and Maintenance Occupations
The most common Natural Resources, Construction and Maintenance occupations in Deer Park are Construction & Extraction (9 | 6.0%), Installation, Maintenance & Repair (5 | 3.3%), and Farming, Fishing & Forestry (4 | 2.7%).
Natural Resources, Construction and Maintenance Occupations by Sex
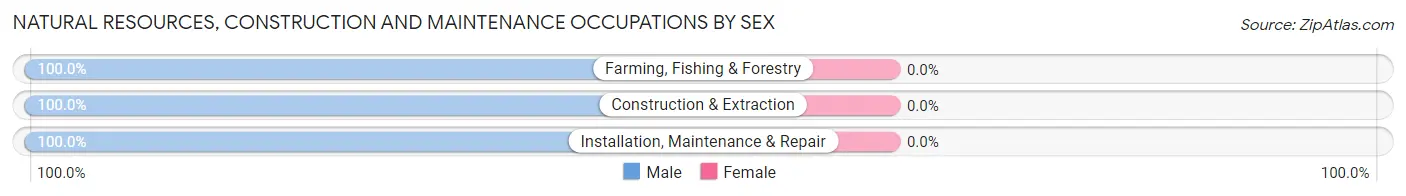
| Occupation | Male | Female |
| Farming, Fishing & Forestry | 4 (100.0%) | 0 (0.0%) |
| Construction & Extraction | 9 (100.0%) | 0 (0.0%) |
| Installation, Maintenance & Repair | 5 (100.0%) | 0 (0.0%) |
| Total (Category) | 18 (100.0%) | 0 (0.0%) |
| Total (Overall) | 79 (52.7%) | 71 (47.3%) |
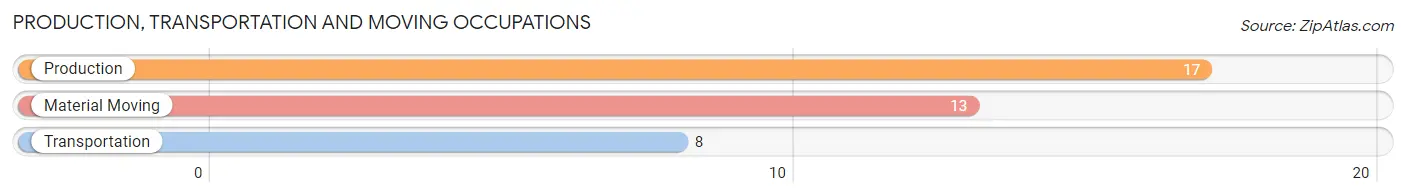
Production, Transportation and Moving Occupations
The most common Production, Transportation and Moving occupations in Deer Park are Production (17 | 11.3%), Material Moving (13 | 8.7%), and Transportation (8 | 5.3%).
Production, Transportation and Moving Occupations by Sex
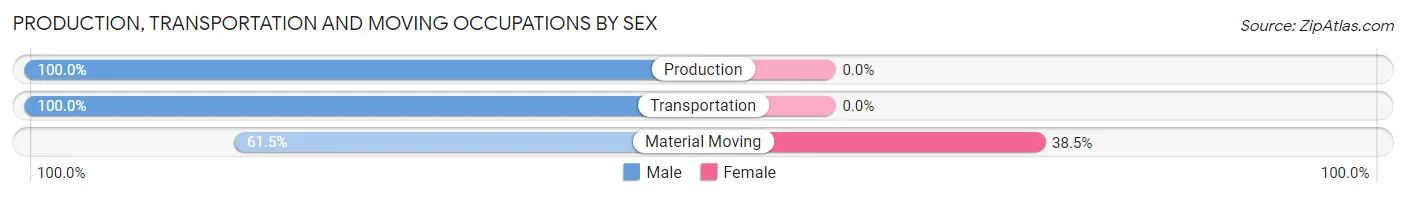
| Occupation | Male | Female |
| Production | 17 (100.0%) | 0 (0.0%) |
| Transportation | 8 (100.0%) | 0 (0.0%) |
| Material Moving | 8 (61.5%) | 5 (38.5%) |
| Total (Category) | 33 (86.8%) | 5 (13.2%) |
| Total (Overall) | 79 (52.7%) | 71 (47.3%) |
Employment Industries by Sex in Deer Park
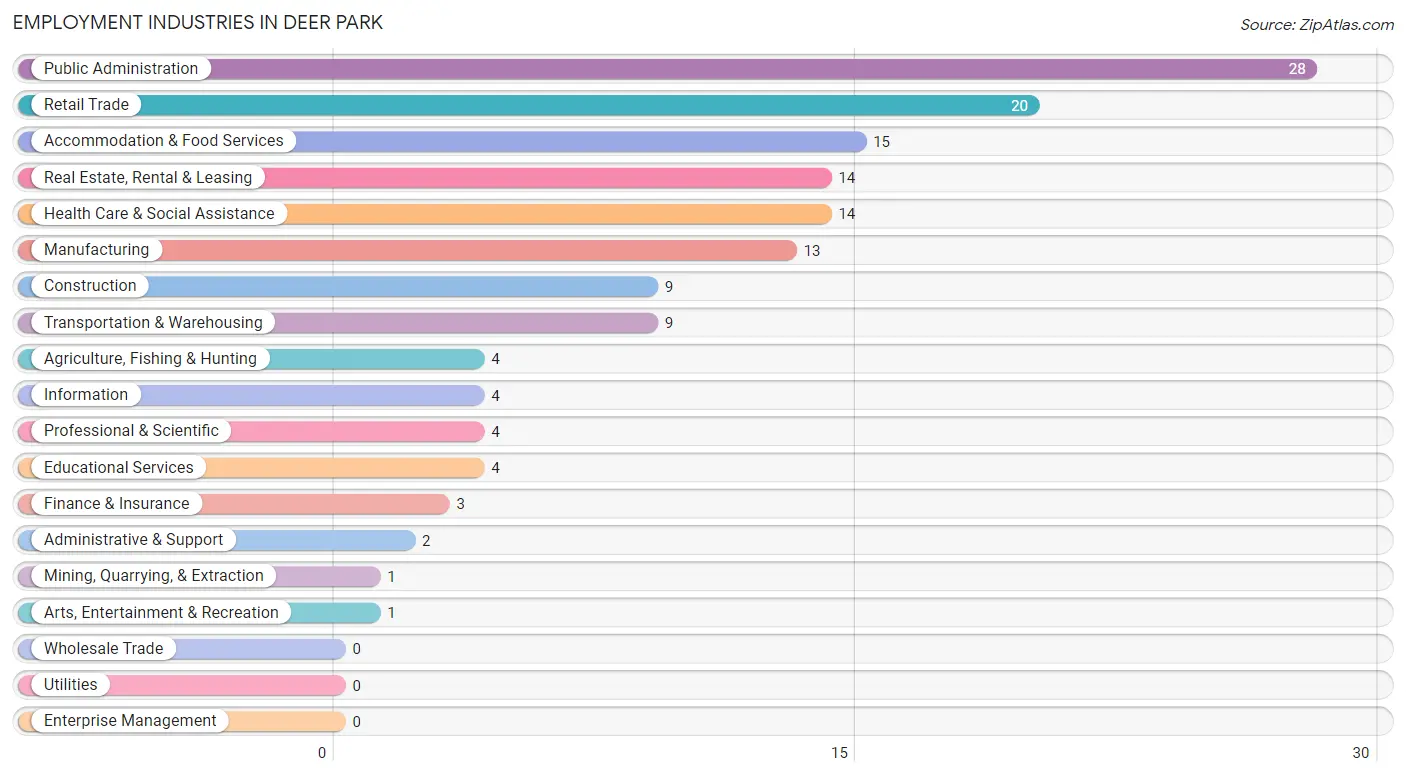
Employment Industries in Deer Park
The major employment industries in Deer Park include Public Administration (28 | 18.7%), Retail Trade (20 | 13.3%), Accommodation & Food Services (15 | 10.0%), Real Estate, Rental & Leasing (14 | 9.3%), and Health Care & Social Assistance (14 | 9.3%).
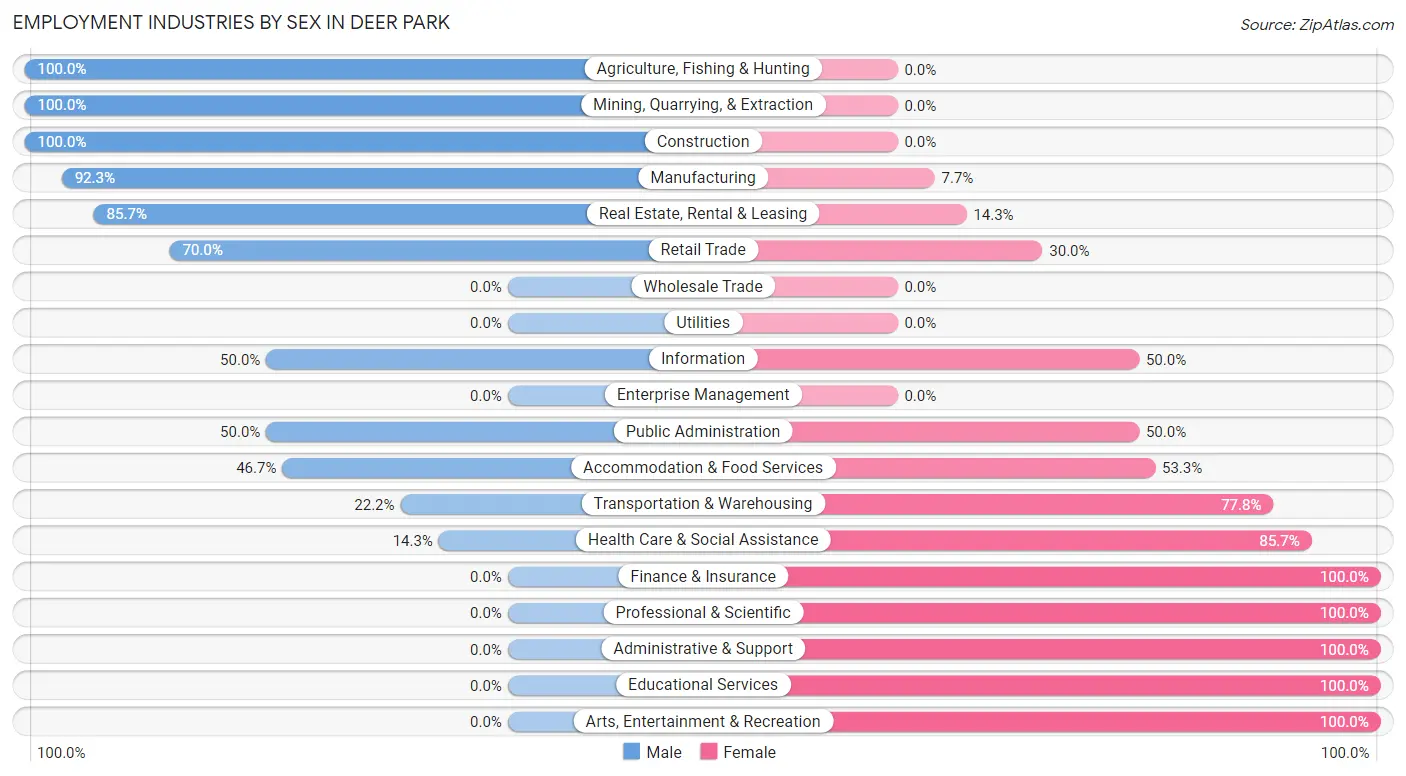
Employment Industries by Sex in Deer Park
The Deer Park industries that see more men than women are Agriculture, Fishing & Hunting (100.0%), Mining, Quarrying, & Extraction (100.0%), and Construction (100.0%), whereas the industries that tend to have a higher number of women are Finance & Insurance (100.0%), Professional & Scientific (100.0%), and Administrative & Support (100.0%).
| Industry | Male | Female |
| Agriculture, Fishing & Hunting | 4 (100.0%) | 0 (0.0%) |
| Mining, Quarrying, & Extraction | 1 (100.0%) | 0 (0.0%) |
| Construction | 9 (100.0%) | 0 (0.0%) |
| Manufacturing | 12 (92.3%) | 1 (7.7%) |
| Wholesale Trade | 0 (0.0%) | 0 (0.0%) |
| Retail Trade | 14 (70.0%) | 6 (30.0%) |
| Transportation & Warehousing | 2 (22.2%) | 7 (77.8%) |
| Utilities | 0 (0.0%) | 0 (0.0%) |
| Information | 2 (50.0%) | 2 (50.0%) |
| Finance & Insurance | 0 (0.0%) | 3 (100.0%) |
| Real Estate, Rental & Leasing | 12 (85.7%) | 2 (14.3%) |
| Professional & Scientific | 0 (0.0%) | 4 (100.0%) |
| Enterprise Management | 0 (0.0%) | 0 (0.0%) |
| Administrative & Support | 0 (0.0%) | 2 (100.0%) |
| Educational Services | 0 (0.0%) | 4 (100.0%) |
| Health Care & Social Assistance | 2 (14.3%) | 12 (85.7%) |
| Arts, Entertainment & Recreation | 0 (0.0%) | 1 (100.0%) |
| Accommodation & Food Services | 7 (46.7%) | 8 (53.3%) |
| Public Administration | 14 (50.0%) | 14 (50.0%) |
| Total | 79 (52.7%) | 71 (47.3%) |
Education in Deer Park
School Enrollment in Deer Park
The most common levels of schooling among the 48 students in Deer Park are high school (14 | 29.2%), middle school (13 | 27.1%), and elementary school (10 | 20.8%).
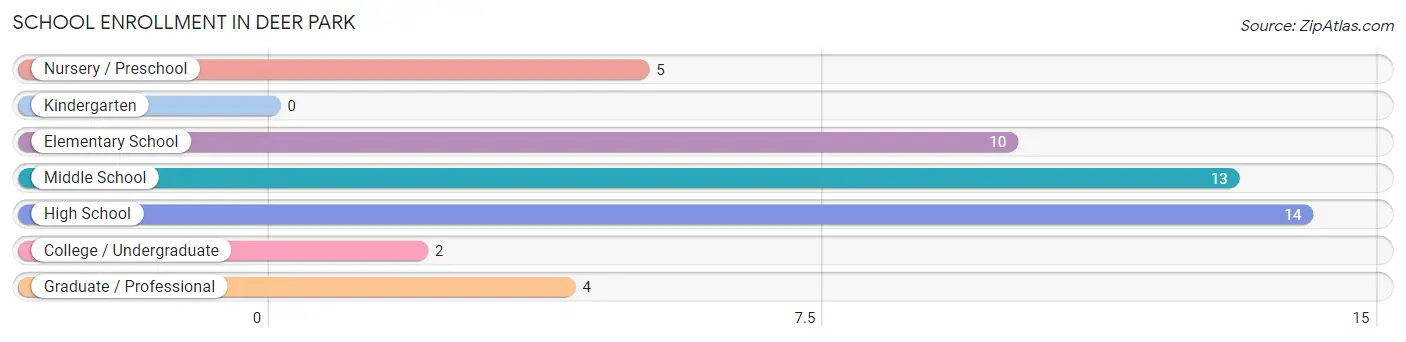
| School Level | # Students | % Students |
| Nursery / Preschool | 5 | 10.4% |
| Kindergarten | 0 | 0.0% |
| Elementary School | 10 | 20.8% |
| Middle School | 13 | 27.1% |
| High School | 14 | 29.2% |
| College / Undergraduate | 2 | 4.2% |
| Graduate / Professional | 4 | 8.3% |
| Total | 48 | 100.0% |
School Enrollment by Age by Funding Source in Deer Park
Out of a total of 48 students who are enrolled in schools in Deer Park, 2 (4.2%) attend a private institution, while the remaining 46 (95.8%) are enrolled in public schools. The age group of 25 to 34 year olds has the highest likelihood of being enrolled in private schools, with 2 (100.0% in the age bracket) enrolled. Conversely, the age group of 3 to 4 year olds has the lowest likelihood of being enrolled in a private school, with 4 (100.0% in the age bracket) attending a public institution.
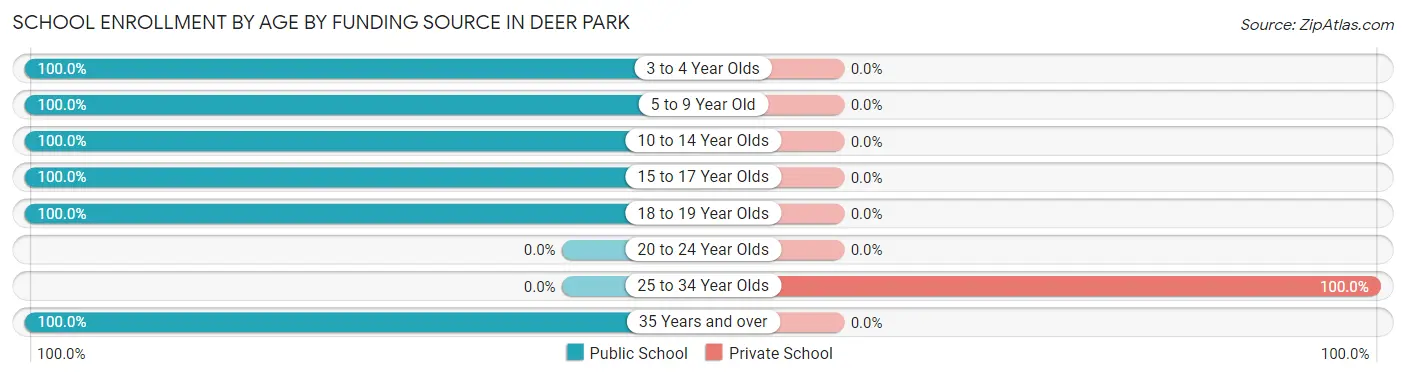
| Age Bracket | Public School | Private School |
| 3 to 4 Year Olds | 4 (100.0%) | 0 (0.0%) |
| 5 to 9 Year Old | 11 (100.0%) | 0 (0.0%) |
| 10 to 14 Year Olds | 20 (100.0%) | 0 (0.0%) |
| 15 to 17 Year Olds | 6 (100.0%) | 0 (0.0%) |
| 18 to 19 Year Olds | 2 (100.0%) | 0 (0.0%) |
| 20 to 24 Year Olds | 0 (0.0%) | 0 (0.0%) |
| 25 to 34 Year Olds | 0 (0.0%) | 2 (100.0%) |
| 35 Years and over | 3 (100.0%) | 0 (0.0%) |
| Total | 46 (95.8%) | 2 (4.2%) |
Educational Attainment by Field of Study in Deer Park
Business (18 | 30.5%), arts & humanities (13 | 22.0%), social sciences (7 | 11.9%), psychology (6 | 10.2%), and computers & mathematics (5 | 8.5%) are the most common fields of study among 59 individuals in Deer Park who have obtained a bachelor's degree or higher.
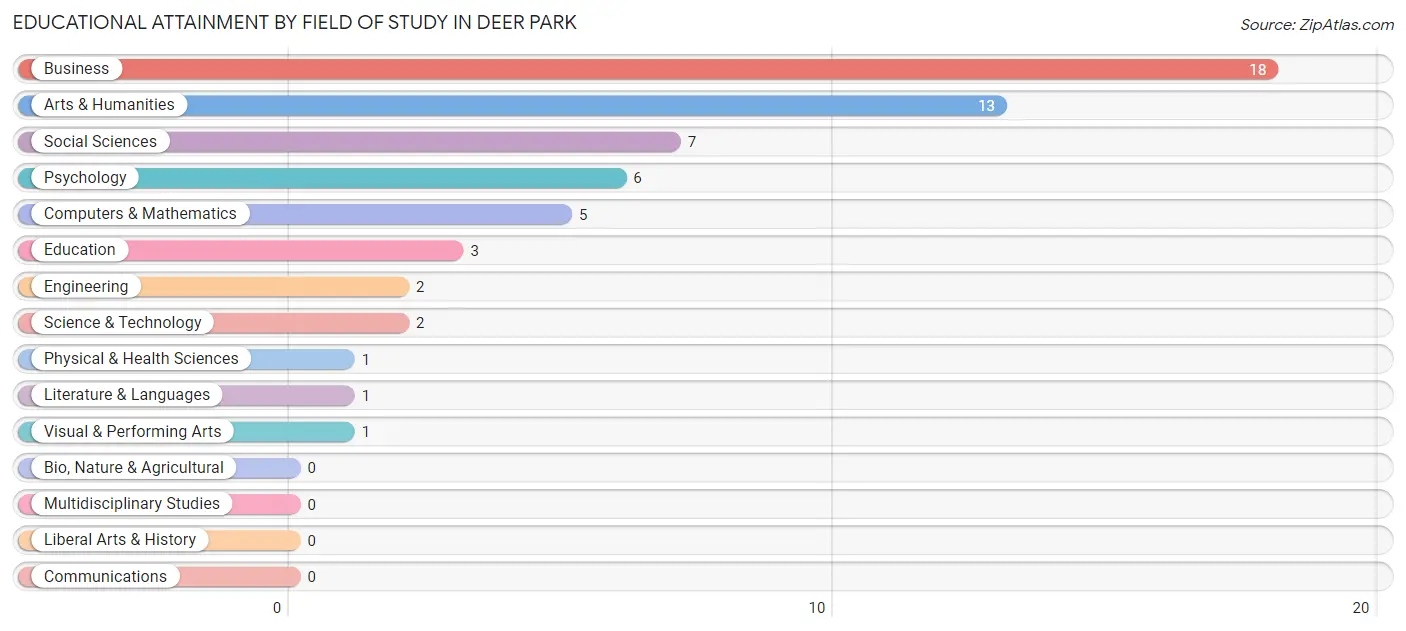
| Field of Study | # Graduates | % Graduates |
| Computers & Mathematics | 5 | 8.5% |
| Bio, Nature & Agricultural | 0 | 0.0% |
| Physical & Health Sciences | 1 | 1.7% |
| Psychology | 6 | 10.2% |
| Social Sciences | 7 | 11.9% |
| Engineering | 2 | 3.4% |
| Multidisciplinary Studies | 0 | 0.0% |
| Science & Technology | 2 | 3.4% |
| Business | 18 | 30.5% |
| Education | 3 | 5.1% |
| Literature & Languages | 1 | 1.7% |
| Liberal Arts & History | 0 | 0.0% |
| Visual & Performing Arts | 1 | 1.7% |
| Communications | 0 | 0.0% |
| Arts & Humanities | 13 | 22.0% |
| Total | 59 | 100.0% |
Transportation & Commute in Deer Park
Vehicle Availability by Sex in Deer Park
The most prevalent vehicle ownership categories in Deer Park are males with 2 vehicles (26, accounting for 33.8%) and females with 2 vehicles (21, making up 36.6%).
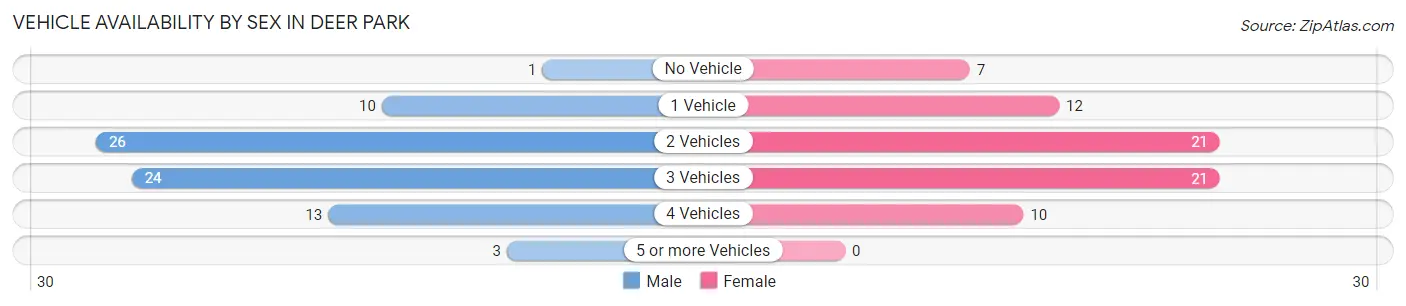
| Vehicles Available | Male | Female |
| No Vehicle | 1 (1.3%) | 7 (9.9%) |
| 1 Vehicle | 10 (13.0%) | 12 (16.9%) |
| 2 Vehicles | 26 (33.8%) | 21 (29.6%) |
| 3 Vehicles | 24 (31.2%) | 21 (29.6%) |
| 4 Vehicles | 13 (16.9%) | 10 (14.1%) |
| 5 or more Vehicles | 3 (3.9%) | 0 (0.0%) |
| Total | 77 (100.0%) | 71 (100.0%) |
Commute Time in Deer Park
The most frequently occuring commute durations in Deer Park are 10 to 14 minutes (56 commuters, 40.0%), 15 to 19 minutes (30 commuters, 21.4%), and 5 to 9 minutes (16 commuters, 11.4%).
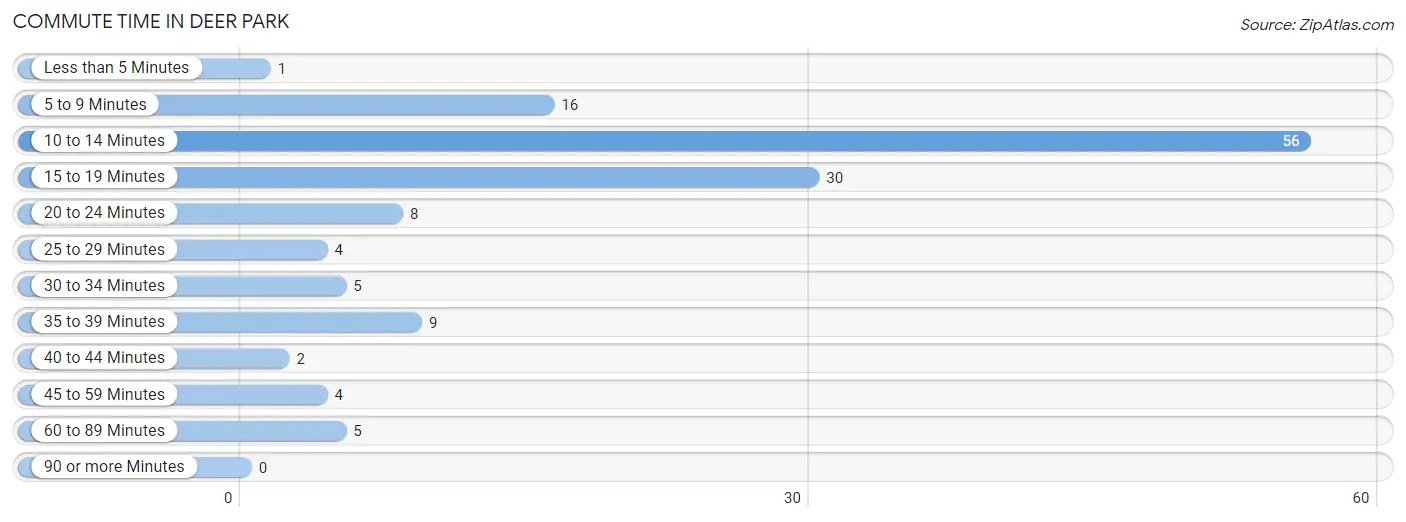
| Commute Time | # Commuters | % Commuters |
| Less than 5 Minutes | 1 | 0.7% |
| 5 to 9 Minutes | 16 | 11.4% |
| 10 to 14 Minutes | 56 | 40.0% |
| 15 to 19 Minutes | 30 | 21.4% |
| 20 to 24 Minutes | 8 | 5.7% |
| 25 to 29 Minutes | 4 | 2.9% |
| 30 to 34 Minutes | 5 | 3.6% |
| 35 to 39 Minutes | 9 | 6.4% |
| 40 to 44 Minutes | 2 | 1.4% |
| 45 to 59 Minutes | 4 | 2.9% |
| 60 to 89 Minutes | 5 | 3.6% |
| 90 or more Minutes | 0 | 0.0% |
Commute Time by Sex in Deer Park
The most common commute times in Deer Park are 10 to 14 minutes (25 commuters, 34.3%) for males and 10 to 14 minutes (31 commuters, 46.3%) for females.
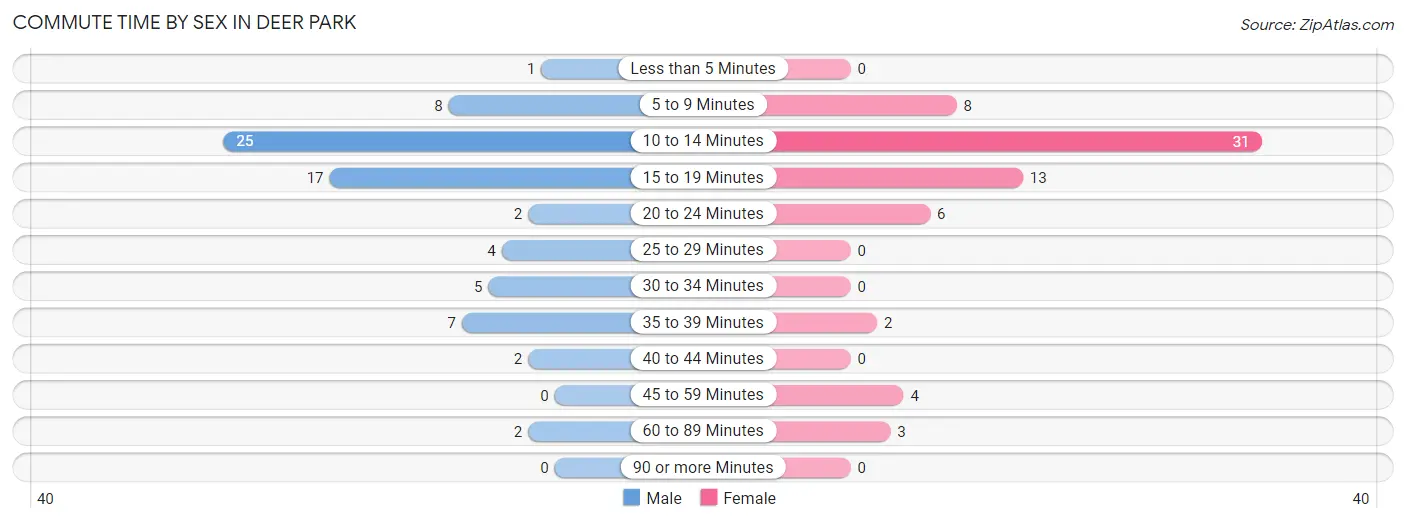
| Commute Time | Male | Female |
| Less than 5 Minutes | 1 (1.4%) | 0 (0.0%) |
| 5 to 9 Minutes | 8 (11.0%) | 8 (11.9%) |
| 10 to 14 Minutes | 25 (34.3%) | 31 (46.3%) |
| 15 to 19 Minutes | 17 (23.3%) | 13 (19.4%) |
| 20 to 24 Minutes | 2 (2.7%) | 6 (9.0%) |
| 25 to 29 Minutes | 4 (5.5%) | 0 (0.0%) |
| 30 to 34 Minutes | 5 (6.9%) | 0 (0.0%) |
| 35 to 39 Minutes | 7 (9.6%) | 2 (3.0%) |
| 40 to 44 Minutes | 2 (2.7%) | 0 (0.0%) |
| 45 to 59 Minutes | 0 (0.0%) | 4 (6.0%) |
| 60 to 89 Minutes | 2 (2.7%) | 3 (4.5%) |
| 90 or more Minutes | 0 (0.0%) | 0 (0.0%) |
Time of Departure to Work by Sex in Deer Park
The most frequent times of departure to work in Deer Park are 5:00 AM to 5:29 AM (13, 17.8%) for males and 7:30 AM to 7:59 AM (21, 31.3%) for females.
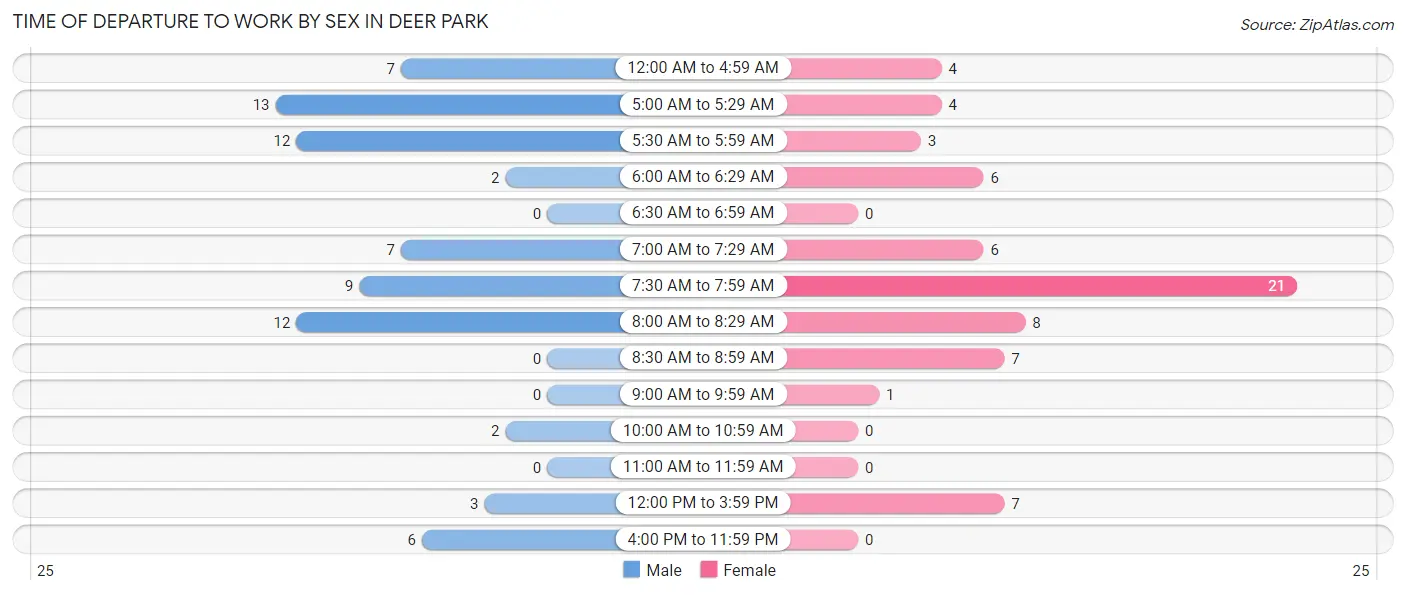
| Time of Departure | Male | Female |
| 12:00 AM to 4:59 AM | 7 (9.6%) | 4 (6.0%) |
| 5:00 AM to 5:29 AM | 13 (17.8%) | 4 (6.0%) |
| 5:30 AM to 5:59 AM | 12 (16.4%) | 3 (4.5%) |
| 6:00 AM to 6:29 AM | 2 (2.7%) | 6 (9.0%) |
| 6:30 AM to 6:59 AM | 0 (0.0%) | 0 (0.0%) |
| 7:00 AM to 7:29 AM | 7 (9.6%) | 6 (9.0%) |
| 7:30 AM to 7:59 AM | 9 (12.3%) | 21 (31.3%) |
| 8:00 AM to 8:29 AM | 12 (16.4%) | 8 (11.9%) |
| 8:30 AM to 8:59 AM | 0 (0.0%) | 7 (10.4%) |
| 9:00 AM to 9:59 AM | 0 (0.0%) | 1 (1.5%) |
| 10:00 AM to 10:59 AM | 2 (2.7%) | 0 (0.0%) |
| 11:00 AM to 11:59 AM | 0 (0.0%) | 0 (0.0%) |
| 12:00 PM to 3:59 PM | 3 (4.1%) | 7 (10.4%) |
| 4:00 PM to 11:59 PM | 6 (8.2%) | 0 (0.0%) |
| Total | 73 (100.0%) | 67 (100.0%) |
Housing Occupancy in Deer Park
Occupancy by Ownership in Deer Park
Of the total 157 dwellings in Deer Park, owner-occupied units account for 116 (73.9%), while renter-occupied units make up 41 (26.1%).
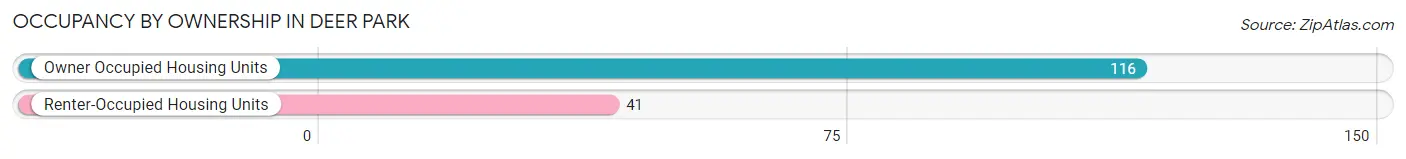
| Occupancy | # Housing Units | % Housing Units |
| Owner Occupied Housing Units | 116 | 73.9% |
| Renter-Occupied Housing Units | 41 | 26.1% |
| Total Occupied Housing Units | 157 | 100.0% |
Occupancy by Household Size in Deer Park
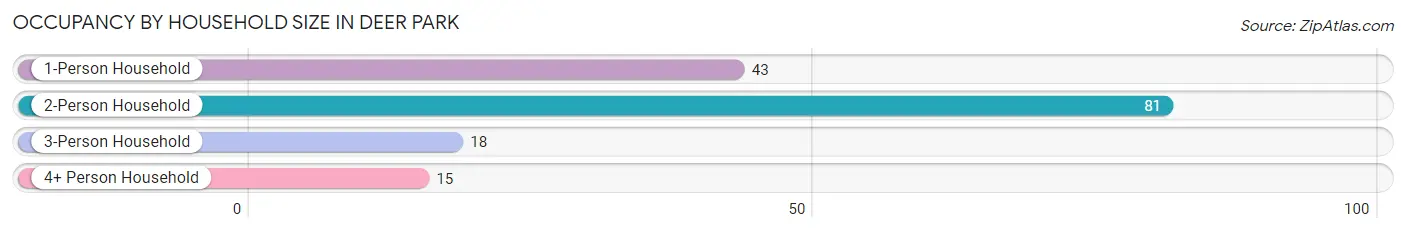
| Household Size | # Housing Units | % Housing Units |
| 1-Person Household | 43 | 27.4% |
| 2-Person Household | 81 | 51.6% |
| 3-Person Household | 18 | 11.5% |
| 4+ Person Household | 15 | 9.6% |
| Total Housing Units | 157 | 100.0% |
Occupancy by Ownership by Household Size in Deer Park
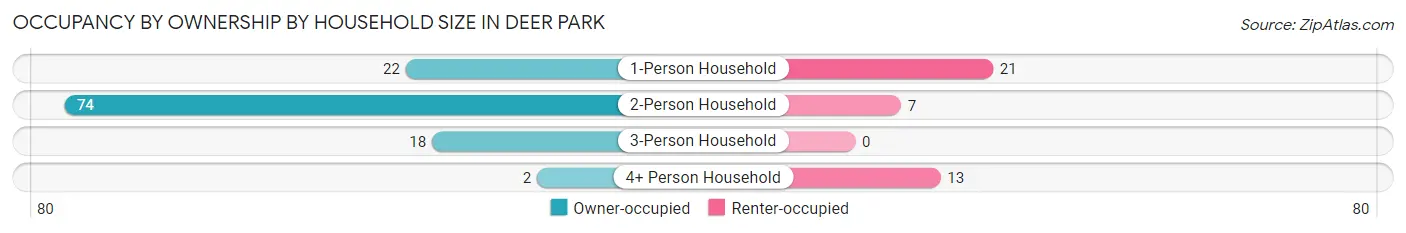
| Household Size | Owner-occupied | Renter-occupied |
| 1-Person Household | 22 (51.2%) | 21 (48.8%) |
| 2-Person Household | 74 (91.4%) | 7 (8.6%) |
| 3-Person Household | 18 (100.0%) | 0 (0.0%) |
| 4+ Person Household | 2 (13.3%) | 13 (86.7%) |
| Total Housing Units | 116 (73.9%) | 41 (26.1%) |
Occupancy by Educational Attainment in Deer Park
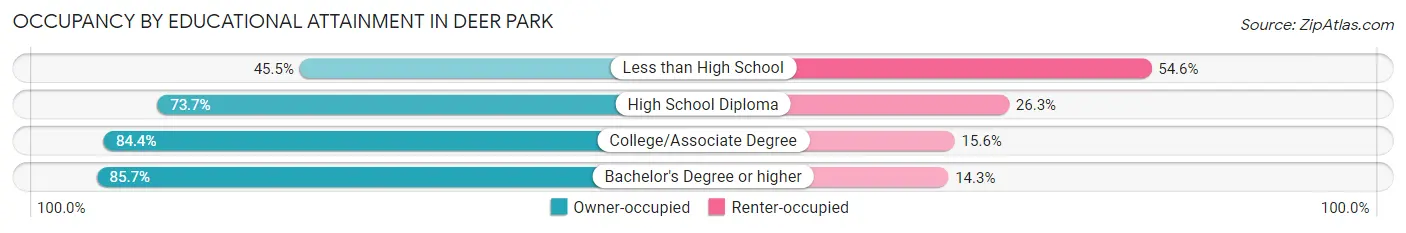
| Household Size | Owner-occupied | Renter-occupied |
| Less than High School | 10 (45.5%) | 12 (54.5%) |
| High School Diploma | 56 (73.7%) | 20 (26.3%) |
| College/Associate Degree | 38 (84.4%) | 7 (15.6%) |
| Bachelor's Degree or higher | 12 (85.7%) | 2 (14.3%) |
Occupancy by Age of Householder in Deer Park
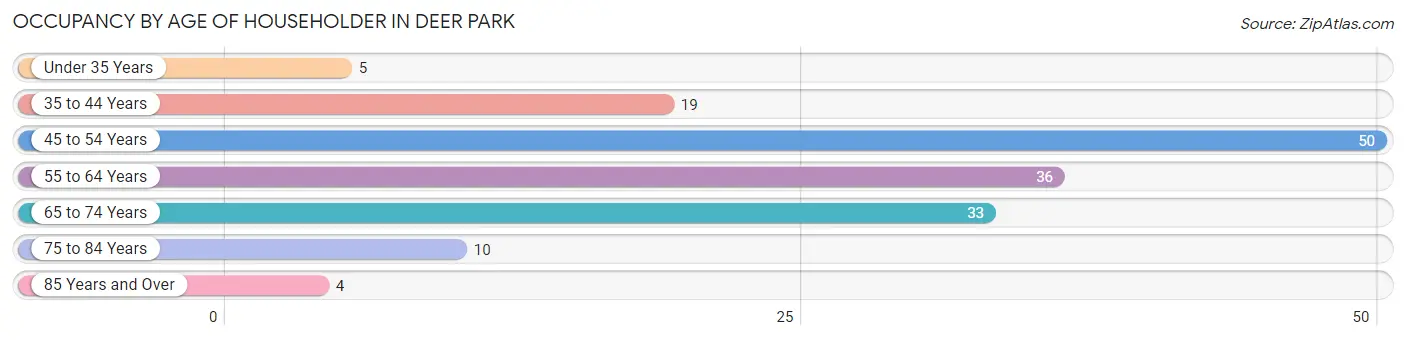
| Age Bracket | # Households | % Households |
| Under 35 Years | 5 | 3.2% |
| 35 to 44 Years | 19 | 12.1% |
| 45 to 54 Years | 50 | 31.9% |
| 55 to 64 Years | 36 | 22.9% |
| 65 to 74 Years | 33 | 21.0% |
| 75 to 84 Years | 10 | 6.4% |
| 85 Years and Over | 4 | 2.5% |
| Total | 157 | 100.0% |
Housing Finances in Deer Park
Median Income by Occupancy in Deer Park
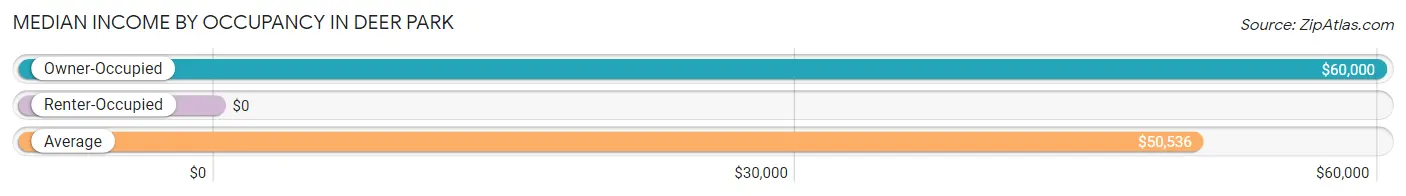
| Occupancy Type | # Households | Median Income |
| Owner-Occupied | 116 (73.9%) | $60,000 |
| Renter-Occupied | 41 (26.1%) | $0 |
| Average | 157 (100.0%) | $50,536 |
Occupancy by Householder Income Bracket in Deer Park
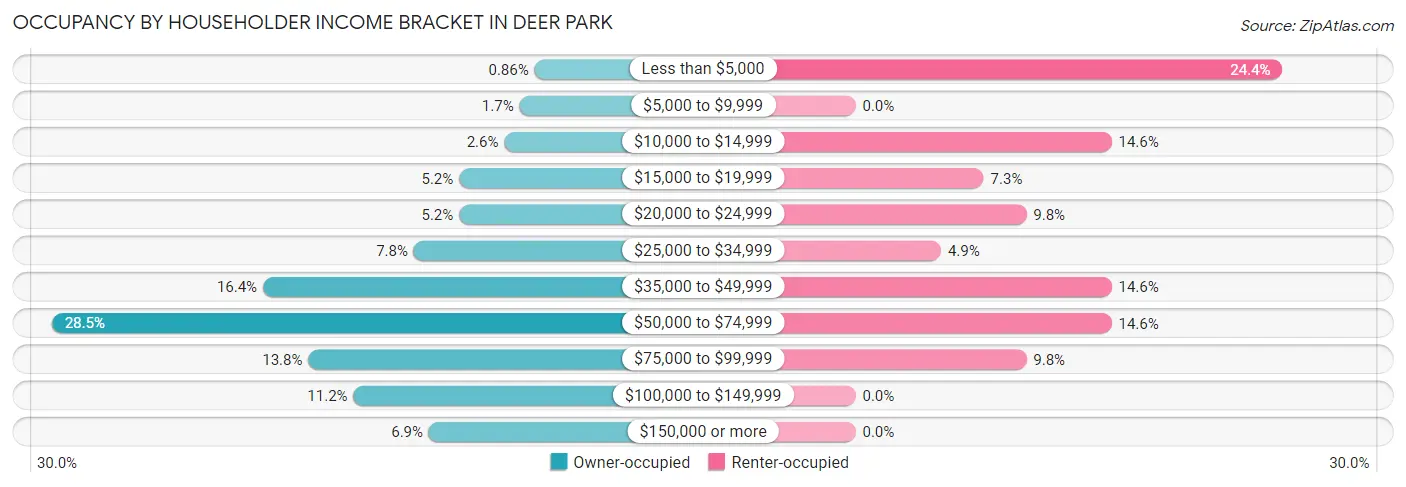
| Income Bracket | Owner-occupied | Renter-occupied |
| Less than $5,000 | 1 (0.9%) | 10 (24.4%) |
| $5,000 to $9,999 | 2 (1.7%) | 0 (0.0%) |
| $10,000 to $14,999 | 3 (2.6%) | 6 (14.6%) |
| $15,000 to $19,999 | 6 (5.2%) | 3 (7.3%) |
| $20,000 to $24,999 | 6 (5.2%) | 4 (9.8%) |
| $25,000 to $34,999 | 9 (7.8%) | 2 (4.9%) |
| $35,000 to $49,999 | 19 (16.4%) | 6 (14.6%) |
| $50,000 to $74,999 | 33 (28.4%) | 6 (14.6%) |
| $75,000 to $99,999 | 16 (13.8%) | 4 (9.8%) |
| $100,000 to $149,999 | 13 (11.2%) | 0 (0.0%) |
| $150,000 or more | 8 (6.9%) | 0 (0.0%) |
| Total | 116 (100.0%) | 41 (100.0%) |
Monthly Housing Cost Tiers in Deer Park
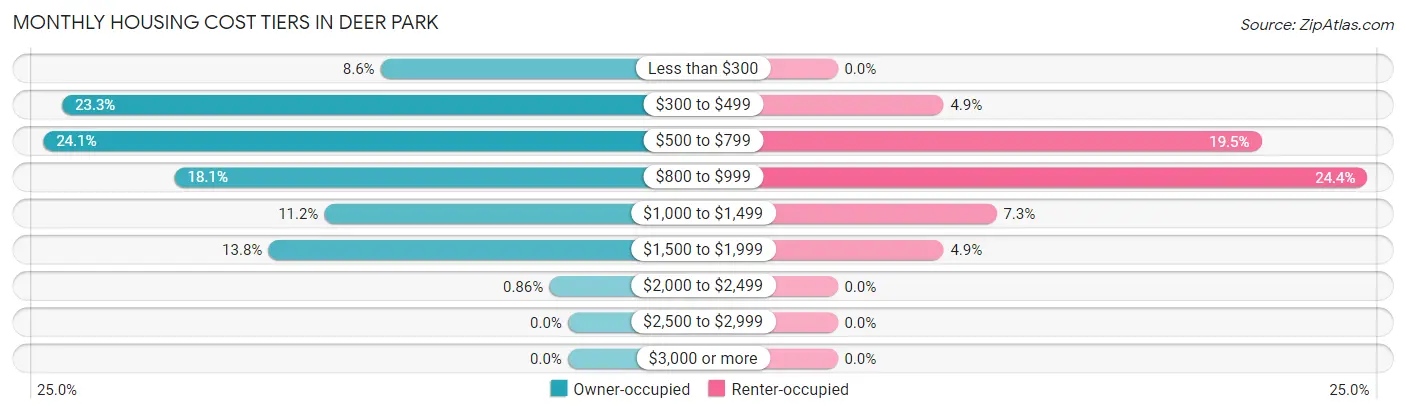
| Monthly Cost | Owner-occupied | Renter-occupied |
| Less than $300 | 10 (8.6%) | 0 (0.0%) |
| $300 to $499 | 27 (23.3%) | 2 (4.9%) |
| $500 to $799 | 28 (24.1%) | 8 (19.5%) |
| $800 to $999 | 21 (18.1%) | 10 (24.4%) |
| $1,000 to $1,499 | 13 (11.2%) | 3 (7.3%) |
| $1,500 to $1,999 | 16 (13.8%) | 2 (4.9%) |
| $2,000 to $2,499 | 1 (0.9%) | 0 (0.0%) |
| $2,500 to $2,999 | 0 (0.0%) | 0 (0.0%) |
| $3,000 or more | 0 (0.0%) | 0 (0.0%) |
| Total | 116 (100.0%) | 41 (100.0%) |
Physical Housing Characteristics in Deer Park
Housing Structures in Deer Park
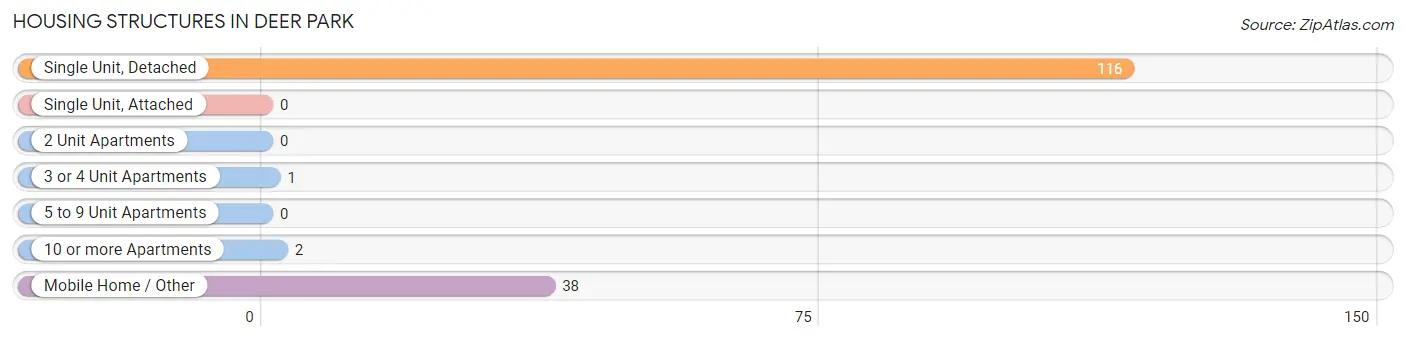
| Structure Type | # Housing Units | % Housing Units |
| Single Unit, Detached | 116 | 73.9% |
| Single Unit, Attached | 0 | 0.0% |
| 2 Unit Apartments | 0 | 0.0% |
| 3 or 4 Unit Apartments | 1 | 0.6% |
| 5 to 9 Unit Apartments | 0 | 0.0% |
| 10 or more Apartments | 2 | 1.3% |
| Mobile Home / Other | 38 | 24.2% |
| Total | 157 | 100.0% |
Housing Structures by Occupancy in Deer Park
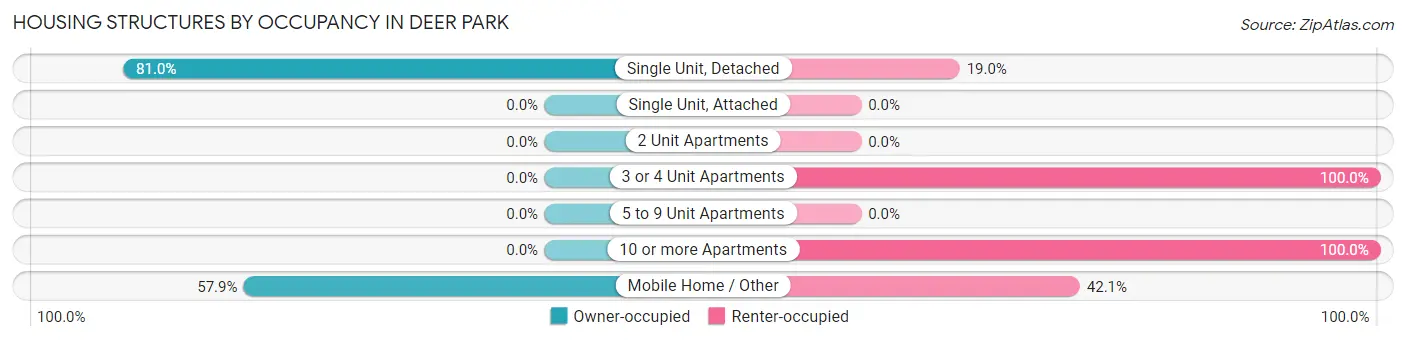
| Structure Type | Owner-occupied | Renter-occupied |
| Single Unit, Detached | 94 (81.0%) | 22 (19.0%) |
| Single Unit, Attached | 0 (0.0%) | 0 (0.0%) |
| 2 Unit Apartments | 0 (0.0%) | 0 (0.0%) |
| 3 or 4 Unit Apartments | 0 (0.0%) | 1 (100.0%) |
| 5 to 9 Unit Apartments | 0 (0.0%) | 0 (0.0%) |
| 10 or more Apartments | 0 (0.0%) | 2 (100.0%) |
| Mobile Home / Other | 22 (57.9%) | 16 (42.1%) |
| Total | 116 (73.9%) | 41 (26.1%) |
Housing Structures by Number of Rooms in Deer Park
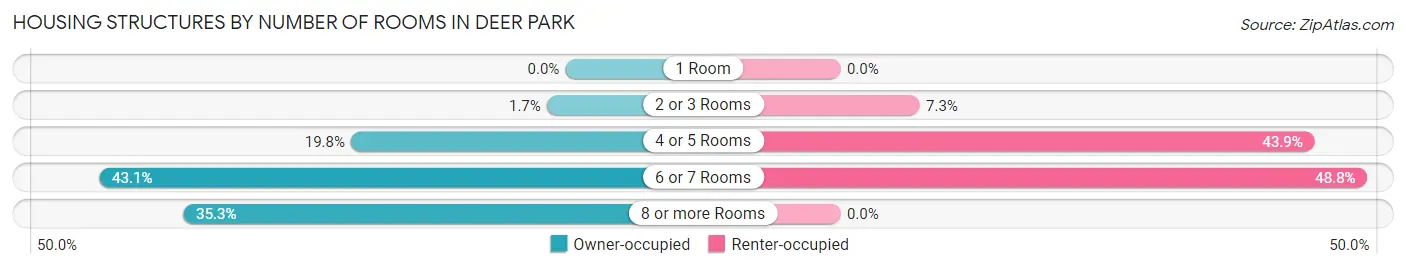
| Number of Rooms | Owner-occupied | Renter-occupied |
| 1 Room | 0 (0.0%) | 0 (0.0%) |
| 2 or 3 Rooms | 2 (1.7%) | 3 (7.3%) |
| 4 or 5 Rooms | 23 (19.8%) | 18 (43.9%) |
| 6 or 7 Rooms | 50 (43.1%) | 20 (48.8%) |
| 8 or more Rooms | 41 (35.3%) | 0 (0.0%) |
| Total | 116 (100.0%) | 41 (100.0%) |
Housing Structure by Heating Type in Deer Park
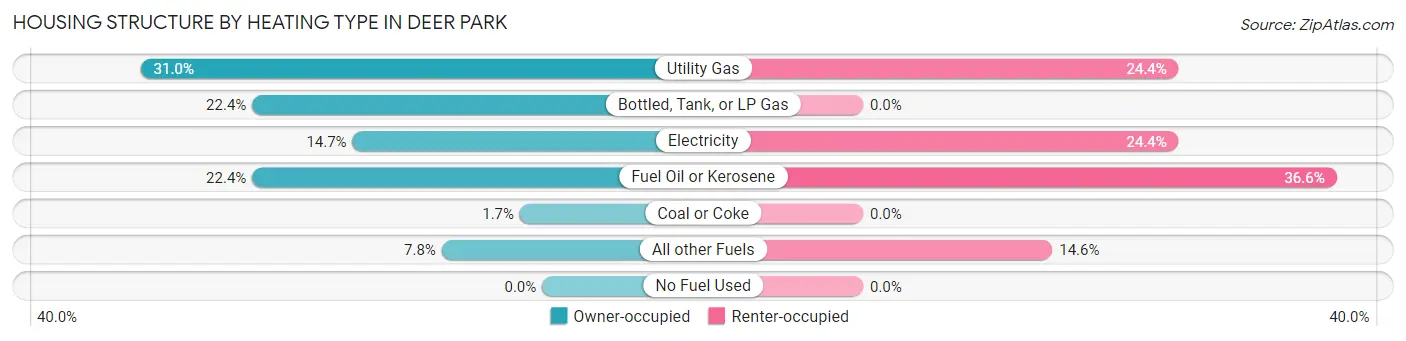
| Heating Type | Owner-occupied | Renter-occupied |
| Utility Gas | 36 (31.0%) | 10 (24.4%) |
| Bottled, Tank, or LP Gas | 26 (22.4%) | 0 (0.0%) |
| Electricity | 17 (14.7%) | 10 (24.4%) |
| Fuel Oil or Kerosene | 26 (22.4%) | 15 (36.6%) |
| Coal or Coke | 2 (1.7%) | 0 (0.0%) |
| All other Fuels | 9 (7.8%) | 6 (14.6%) |
| No Fuel Used | 0 (0.0%) | 0 (0.0%) |
| Total | 116 (100.0%) | 41 (100.0%) |
Household Vehicle Usage in Deer Park
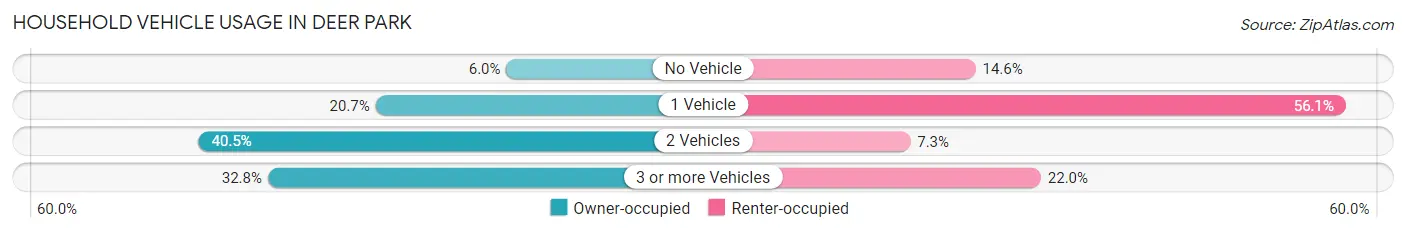
| Vehicles per Household | Owner-occupied | Renter-occupied |
| No Vehicle | 7 (6.0%) | 6 (14.6%) |
| 1 Vehicle | 24 (20.7%) | 23 (56.1%) |
| 2 Vehicles | 47 (40.5%) | 3 (7.3%) |
| 3 or more Vehicles | 38 (32.8%) | 9 (22.0%) |
| Total | 116 (100.0%) | 41 (100.0%) |
Real Estate & Mortgages in Deer Park
Real Estate and Mortgage Overview in Deer Park
| Characteristic | Without Mortgage | With Mortgage |
| Housing Units | 69 | 47 |
| Median Property Value | $159,800 | $159,700 |
| Median Household Income | $46,250 | $4 |
| Monthly Housing Costs | $485 | $0 |
| Real Estate Taxes | $1,577 | $0 |
Property Value by Mortgage Status in Deer Park
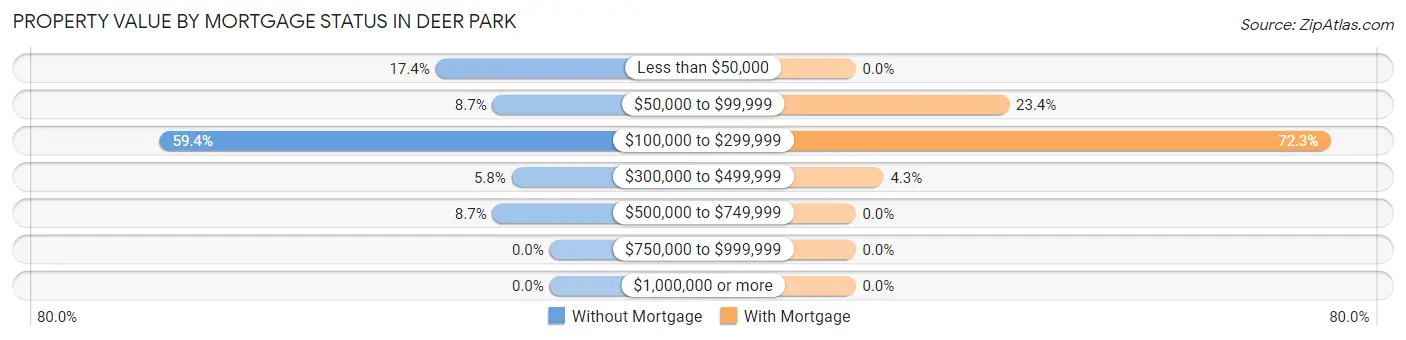
| Property Value | Without Mortgage | With Mortgage |
| Less than $50,000 | 12 (17.4%) | 0 (0.0%) |
| $50,000 to $99,999 | 6 (8.7%) | 11 (23.4%) |
| $100,000 to $299,999 | 41 (59.4%) | 34 (72.3%) |
| $300,000 to $499,999 | 4 (5.8%) | 2 (4.3%) |
| $500,000 to $749,999 | 6 (8.7%) | 0 (0.0%) |
| $750,000 to $999,999 | 0 (0.0%) | 0 (0.0%) |
| $1,000,000 or more | 0 (0.0%) | 0 (0.0%) |
| Total | 69 (100.0%) | 47 (100.0%) |
Household Income by Mortgage Status in Deer Park
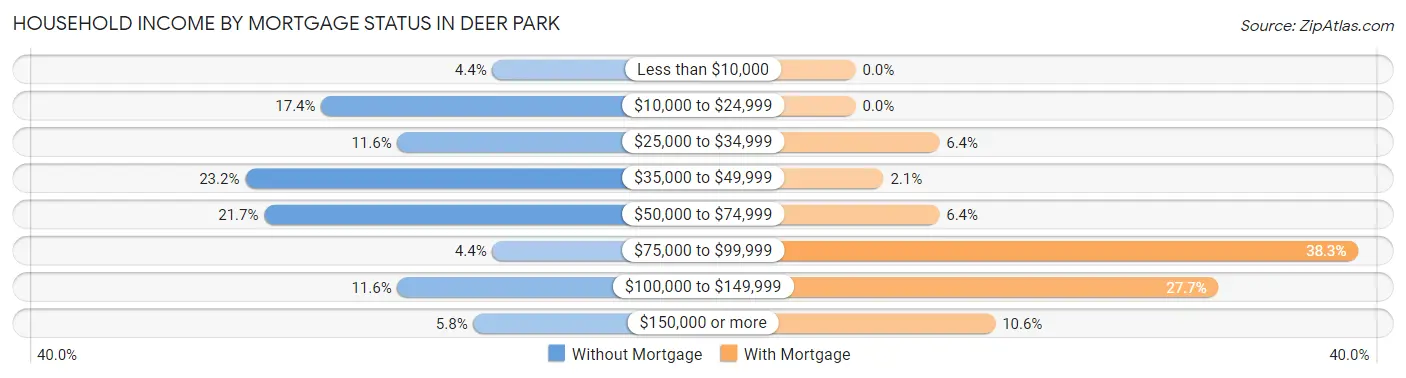
| Household Income | Without Mortgage | With Mortgage |
| Less than $10,000 | 3 (4.3%) | 0 (0.0%) |
| $10,000 to $24,999 | 12 (17.4%) | 0 (0.0%) |
| $25,000 to $34,999 | 8 (11.6%) | 3 (6.4%) |
| $35,000 to $49,999 | 16 (23.2%) | 1 (2.1%) |
| $50,000 to $74,999 | 15 (21.7%) | 3 (6.4%) |
| $75,000 to $99,999 | 3 (4.3%) | 18 (38.3%) |
| $100,000 to $149,999 | 8 (11.6%) | 13 (27.7%) |
| $150,000 or more | 4 (5.8%) | 5 (10.6%) |
| Total | 69 (100.0%) | 47 (100.0%) |
Property Value to Household Income Ratio in Deer Park
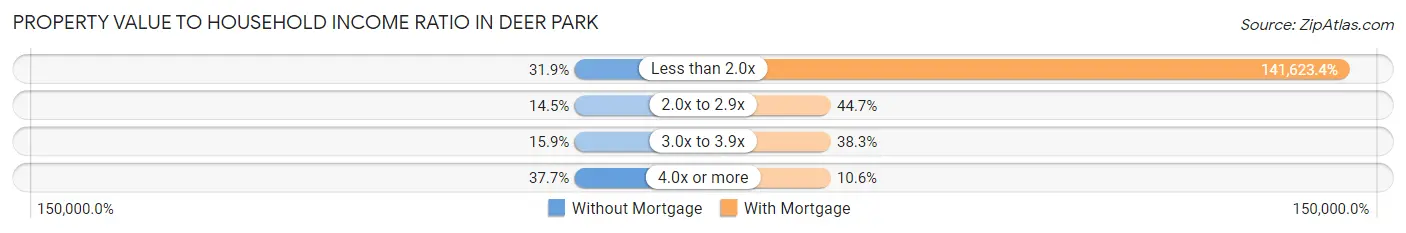
| Value-to-Income Ratio | Without Mortgage | With Mortgage |
| Less than 2.0x | 22 (31.9%) | 66,563 (141,623.4%) |
| 2.0x to 2.9x | 10 (14.5%) | 21 (44.7%) |
| 3.0x to 3.9x | 11 (15.9%) | 18 (38.3%) |
| 4.0x or more | 26 (37.7%) | 5 (10.6%) |
| Total | 69 (100.0%) | 47 (100.0%) |
Real Estate Taxes by Mortgage Status in Deer Park
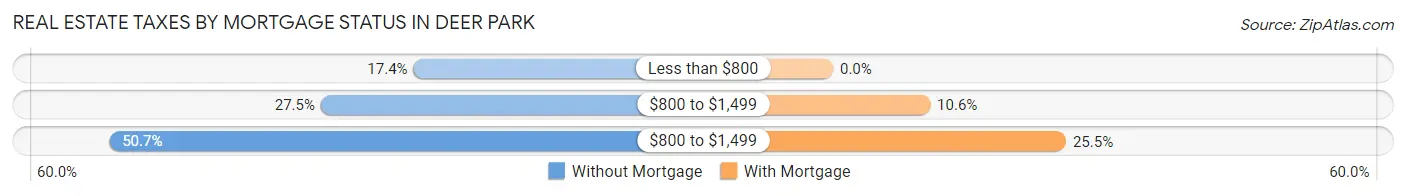
| Property Taxes | Without Mortgage | With Mortgage |
| Less than $800 | 12 (17.4%) | 0 (0.0%) |
| $800 to $1,499 | 19 (27.5%) | 5 (10.6%) |
| $800 to $1,499 | 35 (50.7%) | 12 (25.5%) |
| Total | 69 (100.0%) | 47 (100.0%) |
Health & Disability in Deer Park
Health Insurance Coverage by Age in Deer Park
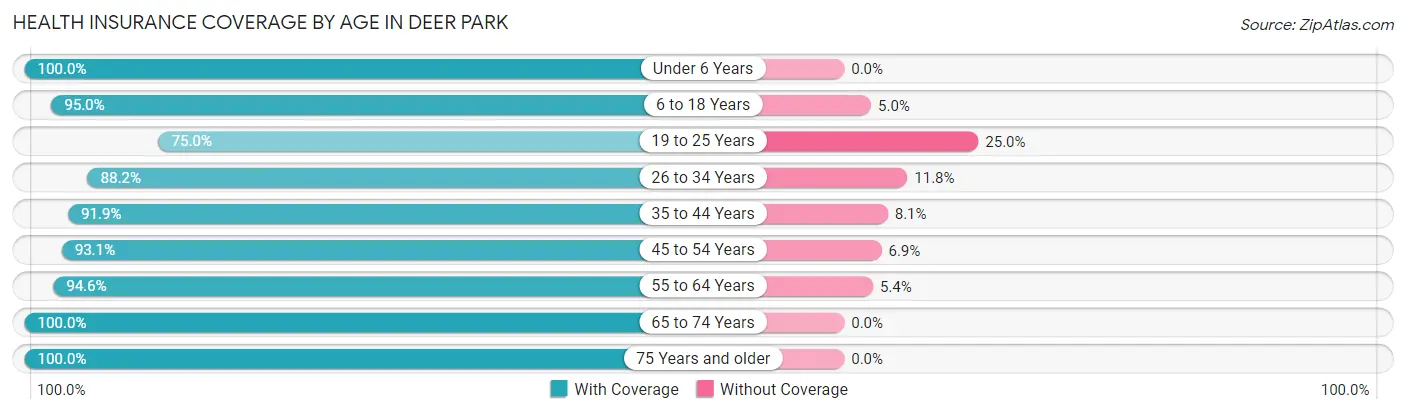
| Age Bracket | With Coverage | Without Coverage |
| Under 6 Years | 10 (100.0%) | 0 (0.0%) |
| 6 to 18 Years | 38 (95.0%) | 2 (5.0%) |
| 19 to 25 Years | 9 (75.0%) | 3 (25.0%) |
| 26 to 34 Years | 15 (88.2%) | 2 (11.8%) |
| 35 to 44 Years | 34 (91.9%) | 3 (8.1%) |
| 45 to 54 Years | 67 (93.1%) | 5 (6.9%) |
| 55 to 64 Years | 53 (94.6%) | 3 (5.4%) |
| 65 to 74 Years | 56 (100.0%) | 0 (0.0%) |
| 75 Years and older | 37 (100.0%) | 0 (0.0%) |
| Total | 319 (94.7%) | 18 (5.3%) |
Health Insurance Coverage by Citizenship Status in Deer Park
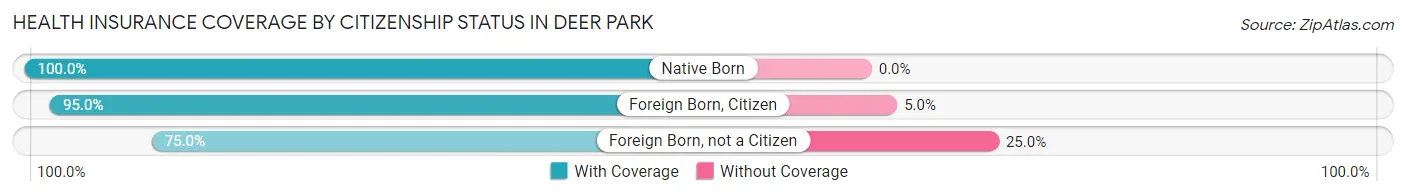
| Citizenship Status | With Coverage | Without Coverage |
| Native Born | 10 (100.0%) | 0 (0.0%) |
| Foreign Born, Citizen | 38 (95.0%) | 2 (5.0%) |
| Foreign Born, not a Citizen | 9 (75.0%) | 3 (25.0%) |
Health Insurance Coverage by Household Income in Deer Park
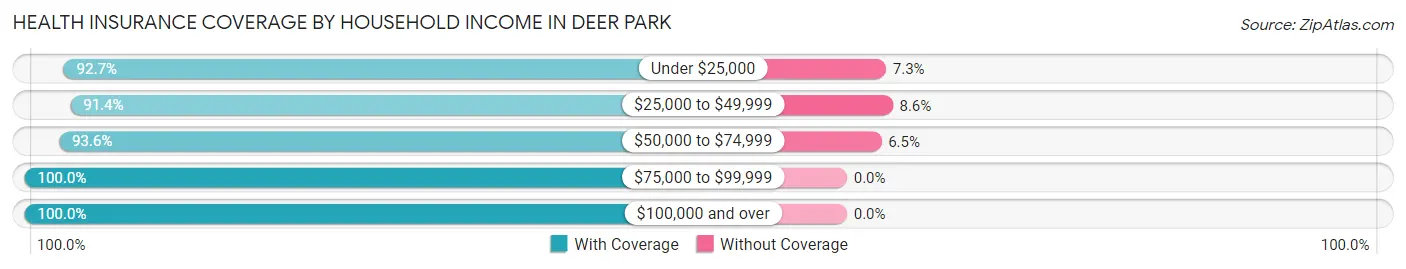
| Household Income | With Coverage | Without Coverage |
| Under $25,000 | 76 (92.7%) | 6 (7.3%) |
| $25,000 to $49,999 | 64 (91.4%) | 6 (8.6%) |
| $50,000 to $74,999 | 87 (93.5%) | 6 (6.5%) |
| $75,000 to $99,999 | 41 (100.0%) | 0 (0.0%) |
| $100,000 and over | 51 (100.0%) | 0 (0.0%) |
Public vs Private Health Insurance Coverage by Age in Deer Park
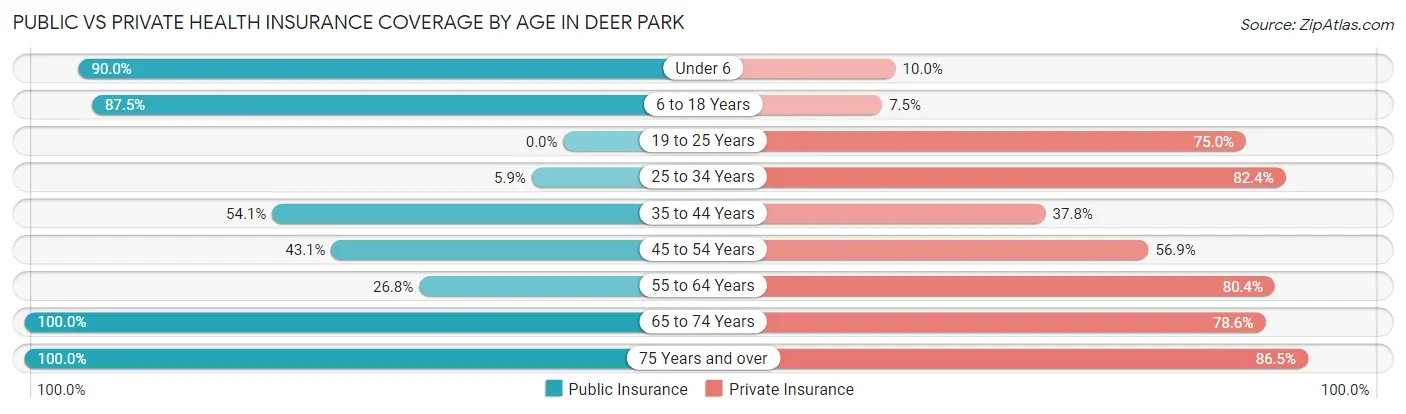
| Age Bracket | Public Insurance | Private Insurance |
| Under 6 | 9 (90.0%) | 1 (10.0%) |
| 6 to 18 Years | 35 (87.5%) | 3 (7.5%) |
| 19 to 25 Years | 0 (0.0%) | 9 (75.0%) |
| 25 to 34 Years | 1 (5.9%) | 14 (82.4%) |
| 35 to 44 Years | 20 (54.0%) | 14 (37.8%) |
| 45 to 54 Years | 31 (43.1%) | 41 (56.9%) |
| 55 to 64 Years | 15 (26.8%) | 45 (80.4%) |
| 65 to 74 Years | 56 (100.0%) | 44 (78.6%) |
| 75 Years and over | 37 (100.0%) | 32 (86.5%) |
| Total | 204 (60.5%) | 203 (60.2%) |
Disability Status by Sex by Age in Deer Park
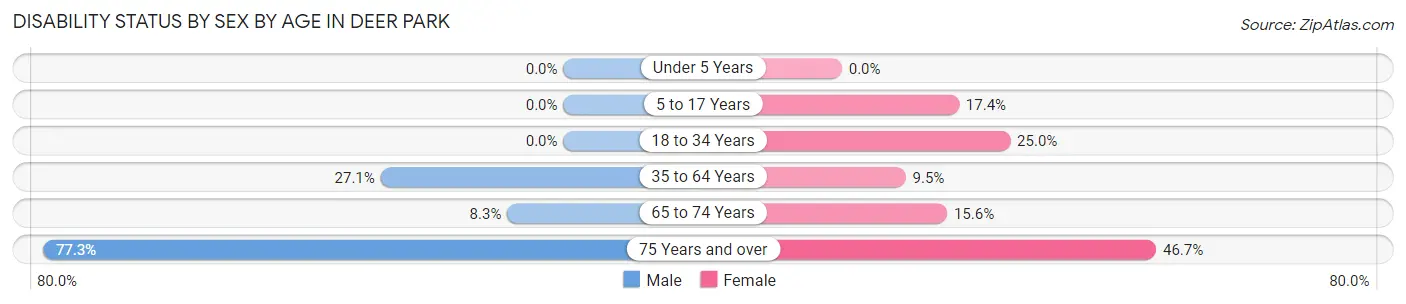
| Age Bracket | Male | Female |
| Under 5 Years | 0 (0.0%) | 0 (0.0%) |
| 5 to 17 Years | 0 (0.0%) | 4 (17.4%) |
| 18 to 34 Years | 0 (0.0%) | 1 (25.0%) |
| 35 to 64 Years | 19 (27.1%) | 9 (9.5%) |
| 65 to 74 Years | 2 (8.3%) | 5 (15.6%) |
| 75 Years and over | 17 (77.3%) | 7 (46.7%) |
Disability Class by Sex by Age in Deer Park
Disability Class: Hearing Difficulty
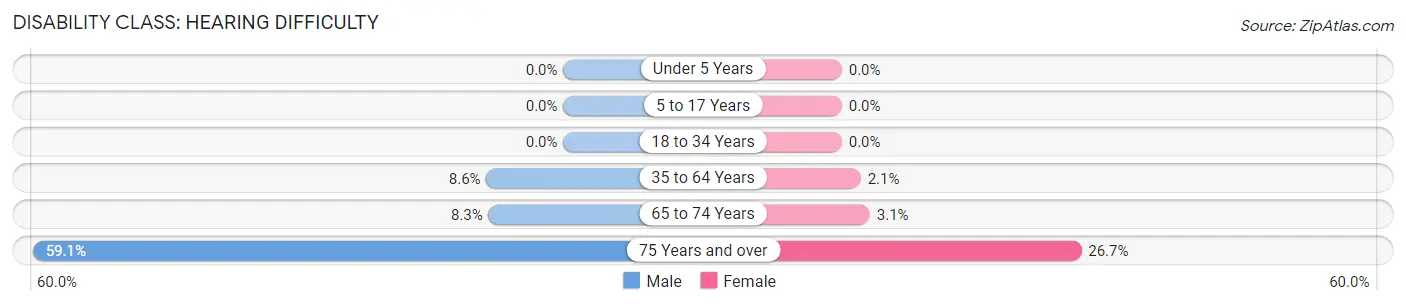
| Age Bracket | Male | Female |
| Under 5 Years | 0 (0.0%) | 0 (0.0%) |
| 5 to 17 Years | 0 (0.0%) | 0 (0.0%) |
| 18 to 34 Years | 0 (0.0%) | 0 (0.0%) |
| 35 to 64 Years | 6 (8.6%) | 2 (2.1%) |
| 65 to 74 Years | 2 (8.3%) | 1 (3.1%) |
| 75 Years and over | 13 (59.1%) | 4 (26.7%) |
Disability Class: Vision Difficulty
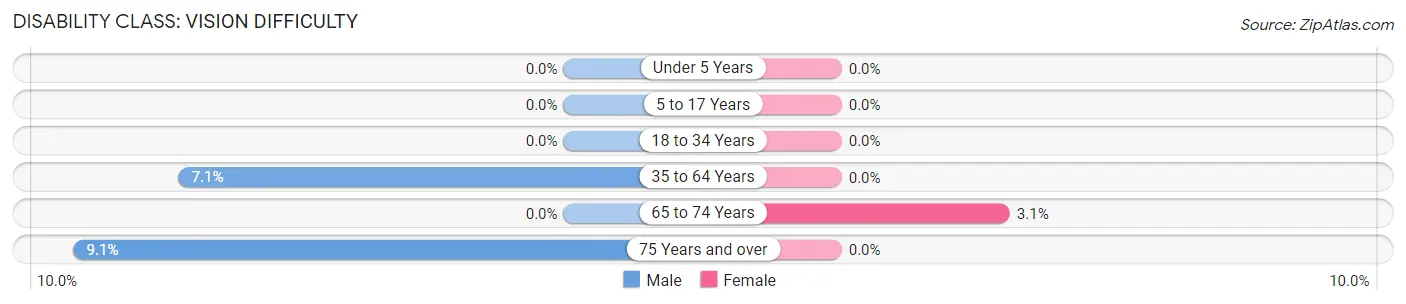
| Age Bracket | Male | Female |
| Under 5 Years | 0 (0.0%) | 0 (0.0%) |
| 5 to 17 Years | 0 (0.0%) | 0 (0.0%) |
| 18 to 34 Years | 0 (0.0%) | 0 (0.0%) |
| 35 to 64 Years | 5 (7.1%) | 0 (0.0%) |
| 65 to 74 Years | 0 (0.0%) | 1 (3.1%) |
| 75 Years and over | 2 (9.1%) | 0 (0.0%) |
Disability Class: Cognitive Difficulty
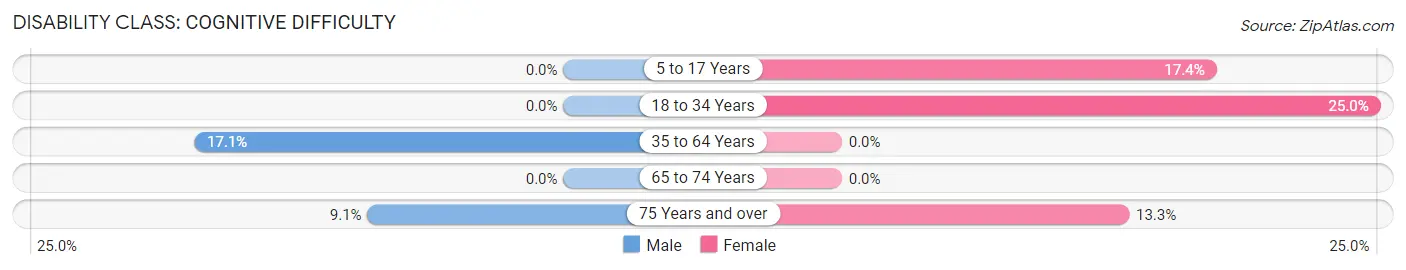
| Age Bracket | Male | Female |
| 5 to 17 Years | 0 (0.0%) | 4 (17.4%) |
| 18 to 34 Years | 0 (0.0%) | 1 (25.0%) |
| 35 to 64 Years | 12 (17.1%) | 0 (0.0%) |
| 65 to 74 Years | 0 (0.0%) | 0 (0.0%) |
| 75 Years and over | 2 (9.1%) | 2 (13.3%) |
Disability Class: Ambulatory Difficulty
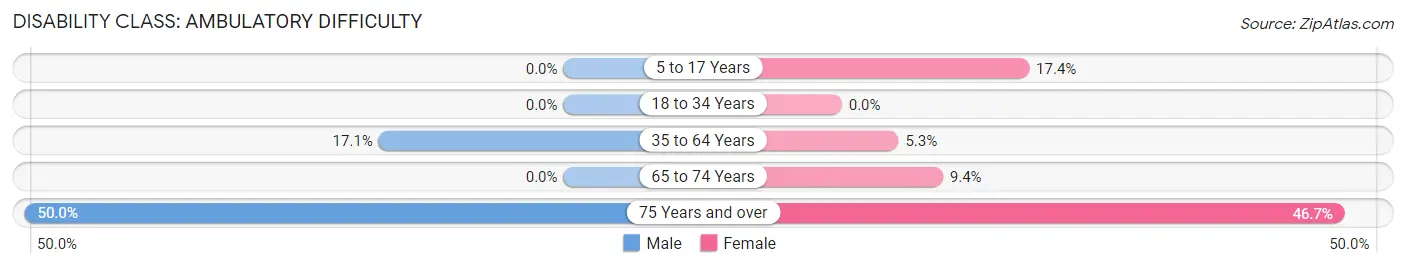
| Age Bracket | Male | Female |
| 5 to 17 Years | 0 (0.0%) | 4 (17.4%) |
| 18 to 34 Years | 0 (0.0%) | 0 (0.0%) |
| 35 to 64 Years | 12 (17.1%) | 5 (5.3%) |
| 65 to 74 Years | 0 (0.0%) | 3 (9.4%) |
| 75 Years and over | 11 (50.0%) | 7 (46.7%) |
Disability Class: Self-Care Difficulty
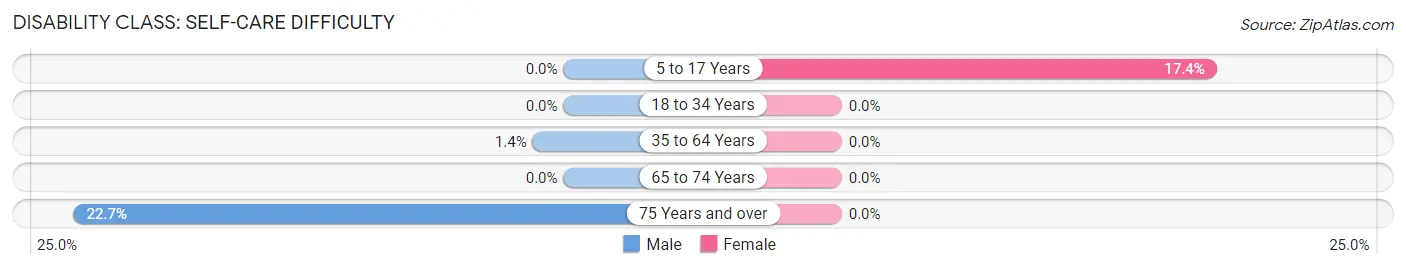
| Age Bracket | Male | Female |
| 5 to 17 Years | 0 (0.0%) | 4 (17.4%) |
| 18 to 34 Years | 0 (0.0%) | 0 (0.0%) |
| 35 to 64 Years | 1 (1.4%) | 0 (0.0%) |
| 65 to 74 Years | 0 (0.0%) | 0 (0.0%) |
| 75 Years and over | 5 (22.7%) | 0 (0.0%) |
Technology Access in Deer Park
Computing Device Access in Deer Park
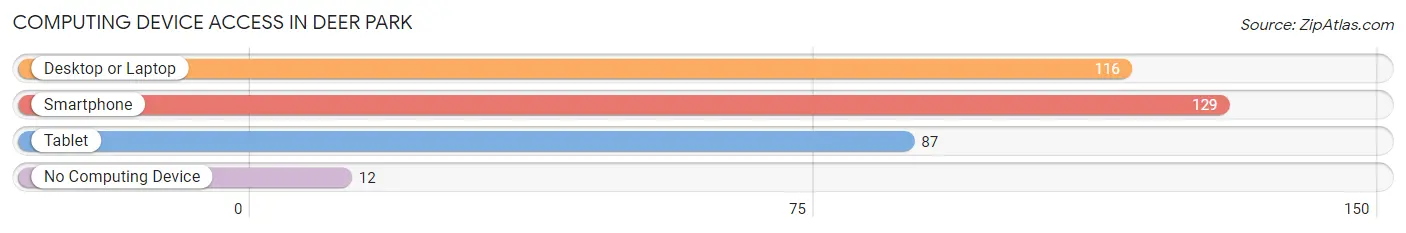
| Device Type | # Households | % Households |
| Desktop or Laptop | 116 | 73.9% |
| Smartphone | 129 | 82.2% |
| Tablet | 87 | 55.4% |
| No Computing Device | 12 | 7.6% |
| Total | 157 | 100.0% |
Internet Access in Deer Park
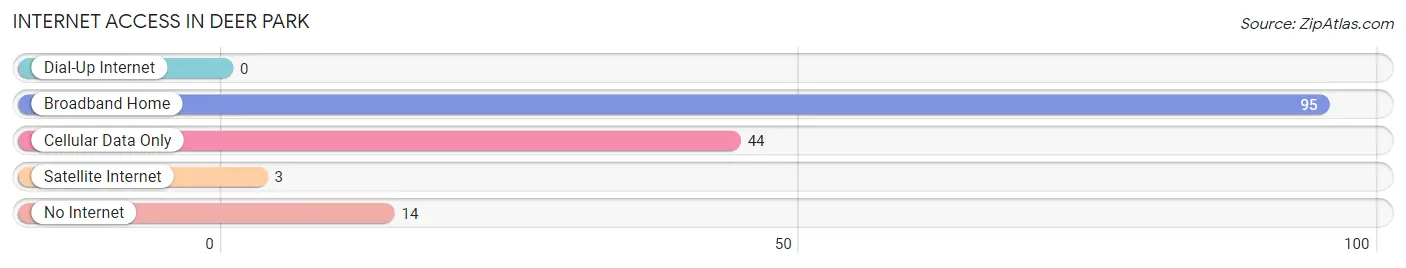
| Internet Type | # Households | % Households |
| Dial-Up Internet | 0 | 0.0% |
| Broadband Home | 95 | 60.5% |
| Cellular Data Only | 44 | 28.0% |
| Satellite Internet | 3 | 1.9% |
| No Internet | 14 | 8.9% |
| Total | 157 | 100.0% |
Deer Park Summary
Deer Park is a small unincorporated community located in Anne Arundel County, Maryland. It is situated on the western shore of the Chesapeake Bay, approximately 25 miles south of Baltimore and 40 miles east of Washington, D.C. The community is bordered by the Patuxent River to the north, the Magothy River to the east, and the Chesapeake Bay to the south and west.
History
Deer Park was first settled in the early 1700s by English settlers. The community was originally known as “Deer Park Plantation” and was owned by the prominent Calvert family. The plantation was used for farming and hunting, and the area was known for its abundance of deer. In the late 1700s, the plantation was divided into smaller parcels and sold to various families.
In the early 1800s, the area was home to a number of small farms and businesses. The community was known for its oyster harvesting and fishing industry. In the late 1800s, the area began to develop as a resort destination. The area was known for its beautiful beaches and scenic views of the Chesapeake Bay.
In the early 1900s, the area began to develop as a residential community. The community was home to a number of summer cottages and vacation homes. In the mid-1900s, the area began to develop as a year-round residential community. The community was home to a number of small businesses, including a post office, a general store, and a gas station.
Geography
Deer Park is located in Anne Arundel County, Maryland. It is situated on the western shore of the Chesapeake Bay, approximately 25 miles south of Baltimore and 40 miles east of Washington, D.C. The community is bordered by the Patuxent River to the north, the Magothy River to the east, and the Chesapeake Bay to the south and west.
The community is located in a rural area and is surrounded by farmland and wooded areas. The area is known for its scenic views of the Chesapeake Bay and its abundance of wildlife. The community is home to a number of parks and recreational areas, including the Patuxent River State Park and the Magothy River State Park.
Economy
Deer Park is a small, rural community with a limited economy. The area is home to a number of small businesses, including a post office, a general store, and a gas station. The community is also home to a number of small farms and agricultural businesses.
The area is also home to a number of recreational businesses, including marinas, boat rentals, and charter fishing services. The area is also home to a number of restaurants and bars.
Demographics
As of the 2010 census, the population of Deer Park was 1,845. The population is primarily white (94.3%) and the median age is 44. The median household income is $76,250 and the median home value is $346,000. The area is home to a number of families and retirees.
Conclusion
Deer Park is a small, rural community located in Anne Arundel County, Maryland. It is situated on the western shore of the Chesapeake Bay, approximately 25 miles south of Baltimore and 40 miles east of Washington, D.C. The community is bordered by the Patuxent River to the north, the Magothy River to the east, and the Chesapeake Bay to the south and west. The area is known for its scenic views of the Chesapeake Bay and its abundance of wildlife. The community is home to a number of small businesses, including a post office, a general store, and a gas station. The area is also home to a number of recreational businesses, including marinas, boat rentals, and charter fishing services. The population of Deer Park is primarily white (94.3%) and the median age is 44. The median household income is $76,250 and the median home value is $346,000.
Common Questions
What is the Total Population of Deer Park?
Total Population of Deer Park is 337.
What is the Total Male Population of Deer Park?
Total Male Population of Deer Park is 159.
What is the Total Female Population of Deer Park?
Total Female Population of Deer Park is 178.
What is the Ratio of Males per 100 Females in Deer Park?
There are 89.33 Males per 100 Females in Deer Park.
What is the Ratio of Females per 100 Males in Deer Park?
There are 111.95 Females per 100 Males in Deer Park.
What is the Median Population Age in Deer Park?
Median Population Age in Deer Park is 52.5 Years.
What is the Average Family Size in Deer Park
Average Family Size in Deer Park is 2.6 People.
What is the Average Household Size in Deer Park
Average Household Size in Deer Park is 2.1 People.
What is Per Capita Income in Deer Park?
Per Capita income in Deer Park is $27,712.
What is the Median Family Income in Deer Park?
Median Family Income in Deer Park is $61,667.
What is the Median Household income in Deer Park?
Median Household Income in Deer Park is $50,536.
What is Income or Wage Gap in Deer Park?
Income or Wage Gap in Deer Park is 17.2%.
Women in Deer Park earn 82.8 cents for every dollar earned by a man.
What is Family Income Deficit in Deer Park?
Family Income Deficit in Deer Park is $13,993.
Families that are below poverty line in Deer Park earn $13,993 less on average than the poverty threshold level.
What is Inequality or Gini Index in Deer Park?
Inequality or Gini Index in Deer Park is 0.41.
How Large is the Labor Force in Deer Park?
There are 165 People in the Labor Forcein in Deer Park.
What is the Percentage of People in the Labor Force in Deer Park?
55.6% of People are in the Labor Force in Deer Park.
What is the Unemployment Rate in Deer Park?
Unemployment Rate in Deer Park is 9.1%.