Cities with the Highest Percentage of Immigrants from Eastern Europe in Iowa
RELATED REPORTS & OPTIONS
Eastern Europe
Iowa
Compare Cities
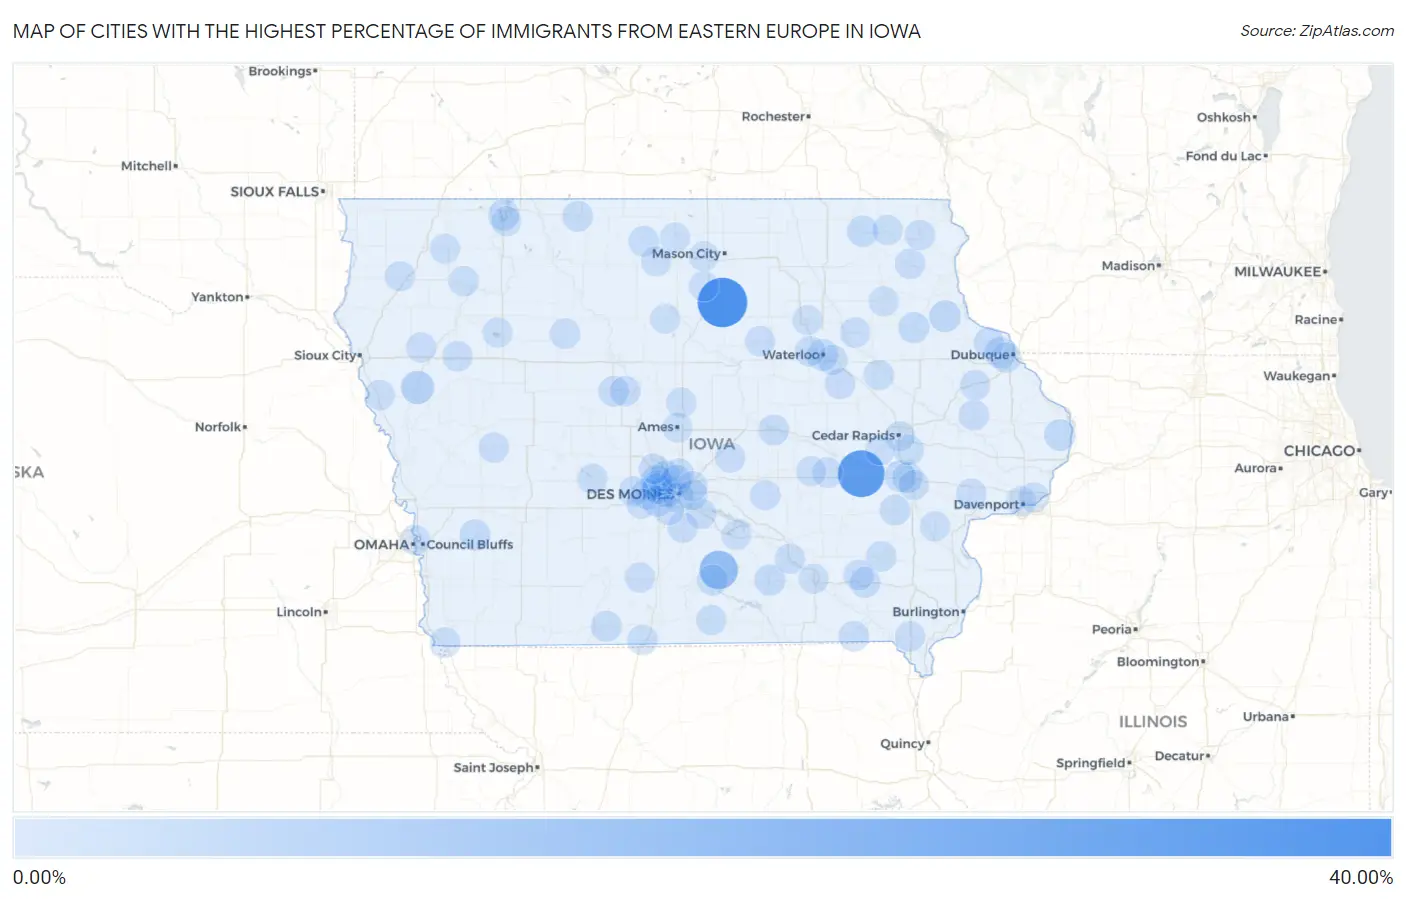
Map of Cities with the Highest Percentage of Immigrants from Eastern Europe in Iowa
0.00%
40.00%
Cities with the Highest Percentage of Immigrants from Eastern Europe in Iowa
| City | Eastern Europe | vs State | vs National | |
| 1. | Chapin | 34.31% | 0.35%(+34.0)#1 | 0.67%(+33.6)#4 |
| 2. | Conroy | 29.41% | 0.35%(+29.1)#2 | 0.67%(+28.7)#9 |
| 3. | Williamson | 14.39% | 0.35%(+14.0)#3 | 0.67%(+13.7)#32 |
| 4. | Oto | 5.00% | 0.35%(+4.65)#4 | 0.67%(+4.33)#266 |
| 5. | Windsor Heights | 3.10% | 0.35%(+2.74)#5 | 0.67%(+2.43)#574 |
| 6. | Garber | 2.91% | 0.35%(+2.56)#6 | 0.67%(+2.24)#633 |
| 7. | Grimes | 2.76% | 0.35%(+2.41)#7 | 0.67%(+2.09)#685 |
| 8. | Andover | 2.48% | 0.35%(+2.13)#8 | 0.67%(+1.81)#812 |
| 9. | Urbandale | 2.38% | 0.35%(+2.02)#9 | 0.67%(+1.71)#866 |
| 10. | Waterloo | 2.29% | 0.35%(+1.94)#10 | 0.67%(+1.62)#917 |
| 11. | Ridgeway | 1.98% | 0.35%(+1.62)#11 | 0.67%(+1.31)#1,113 |
| 12. | Asbury | 1.90% | 0.35%(+1.55)#12 | 0.67%(+1.23)#1,173 |
| 13. | Tiffin | 1.84% | 0.35%(+1.49)#13 | 0.67%(+1.17)#1,229 |
| 14. | Okoboji | 1.66% | 0.35%(+1.31)#14 | 0.67%(+0.991)#1,407 |
| 15. | Oakland | 1.55% | 0.35%(+1.20)#15 | 0.67%(+0.882)#1,538 |
| 16. | Albia | 1.54% | 0.35%(+1.19)#16 | 0.67%(+0.871)#1,553 |
| 17. | Johnston | 1.49% | 0.35%(+1.14)#17 | 0.67%(+0.821)#1,625 |
| 18. | Strawberry Point | 1.47% | 0.35%(+1.12)#18 | 0.67%(+0.805)#1,642 |
| 19. | Waukee | 1.39% | 0.35%(+1.04)#19 | 0.67%(+0.722)#1,754 |
| 20. | West Des Moines | 1.29% | 0.35%(+0.943)#20 | 0.67%(+0.628)#1,877 |
| 21. | Chariton | 1.28% | 0.35%(+0.933)#21 | 0.67%(+0.618)#1,898 |
| 22. | Clive | 1.28% | 0.35%(+0.924)#22 | 0.67%(+0.609)#1,914 |
| 23. | Mount Ayr | 1.20% | 0.35%(+0.845)#23 | 0.67%(+0.530)#2,064 |
| 24. | Woden | 1.12% | 0.35%(+0.772)#24 | 0.67%(+0.456)#2,195 |
| 25. | Coralville | 1.04% | 0.35%(+0.684)#25 | 0.67%(+0.369)#2,387 |
| 26. | Harcourt | 1.02% | 0.35%(+0.664)#26 | 0.67%(+0.348)#2,429 |
| 27. | Ankeny | 1.01% | 0.35%(+0.663)#27 | 0.67%(+0.348)#2,431 |
| 28. | Saylorville | 0.99% | 0.35%(+0.635)#28 | 0.67%(+0.320)#2,493 |
| 29. | Fairfield | 0.97% | 0.35%(+0.619)#29 | 0.67%(+0.304)#2,532 |
| 30. | Kalona | 0.95% | 0.35%(+0.596)#30 | 0.67%(+0.281)#2,591 |
| 31. | Armstrong | 0.93% | 0.35%(+0.575)#31 | 0.67%(+0.260)#2,649 |
| 32. | Le Grand | 0.89% | 0.35%(+0.534)#32 | 0.67%(+0.219)#2,758 |
| 33. | Kent Estates | 0.83% | 0.35%(+0.480)#33 | 0.67%(+0.165)#2,921 |
| 34. | Palmer | 0.79% | 0.35%(+0.436)#34 | 0.67%(+0.120)#3,062 |
| 35. | Wilton | 0.75% | 0.35%(+0.397)#35 | 0.67%(+0.081)#3,193 |
| 36. | Cantril | 0.74% | 0.35%(+0.389)#36 | 0.67%(+0.074)#3,211 |
| 37. | Maharishi Vedic City | 0.73% | 0.35%(+0.376)#37 | 0.67%(+0.060)#3,257 |
| 38. | Granger | 0.72% | 0.35%(+0.366)#38 | 0.67%(+0.051)#3,297 |
| 39. | Lamoni | 0.66% | 0.35%(+0.305)#39 | 0.67%(-0.010)#3,547 |
| 40. | Holstein | 0.64% | 0.35%(+0.289)#40 | 0.67%(-0.026)#3,607 |
| 41. | Postville | 0.64% | 0.35%(+0.289)#41 | 0.67%(-0.026)#3,610 |
| 42. | La Porte City | 0.64% | 0.35%(+0.287)#42 | 0.67%(-0.028)#3,620 |
| 43. | Victor | 0.63% | 0.35%(+0.283)#43 | 0.67%(-0.033)#3,644 |
| 44. | Onslow | 0.63% | 0.35%(+0.275)#44 | 0.67%(-0.040)#3,668 |
| 45. | Rowley | 0.57% | 0.35%(+0.215)#45 | 0.67%(-0.101)#3,931 |
| 46. | Indianola | 0.56% | 0.35%(+0.210)#46 | 0.67%(-0.105)#3,951 |
| 47. | Dubuque | 0.55% | 0.35%(+0.203)#47 | 0.67%(-0.112)#3,980 |
| 48. | Des Moines | 0.50% | 0.35%(+0.153)#48 | 0.67%(-0.162)#4,221 |
| 49. | Sully | 0.49% | 0.35%(+0.138)#49 | 0.67%(-0.178)#4,297 |
| 50. | Corydon | 0.47% | 0.35%(+0.122)#50 | 0.67%(-0.193)#4,377 |
| 51. | Hartford | 0.46% | 0.35%(+0.105)#51 | 0.67%(-0.210)#4,468 |
| 52. | Iowa City | 0.45% | 0.35%(+0.102)#52 | 0.67%(-0.213)#4,479 |
| 53. | Pleasant Hill | 0.45% | 0.35%(+0.098)#53 | 0.67%(-0.218)#4,513 |
| 54. | Murray | 0.44% | 0.35%(+0.089)#54 | 0.67%(-0.227)#4,553 |
| 55. | Donnellson | 0.43% | 0.35%(+0.083)#55 | 0.67%(-0.232)#4,593 |
| 56. | Brighton | 0.42% | 0.35%(+0.070)#56 | 0.67%(-0.245)#4,670 |
| 57. | Altoona | 0.42% | 0.35%(+0.068)#57 | 0.67%(-0.247)#4,685 |
| 58. | Orange City | 0.41% | 0.35%(+0.062)#58 | 0.67%(-0.253)#4,719 |
| 59. | Manilla | 0.41% | 0.35%(+0.058)#59 | 0.67%(-0.258)#4,751 |
| 60. | Fairbank | 0.40% | 0.35%(+0.051)#60 | 0.67%(-0.264)#4,790 |
| 61. | Bettendorf | 0.40% | 0.35%(+0.048)#61 | 0.67%(-0.267)#4,804 |
| 62. | Waukon | 0.39% | 0.35%(+0.041)#62 | 0.67%(-0.274)#4,857 |
| 63. | Rickardsville | 0.39% | 0.35%(+0.036)#63 | 0.67%(-0.280)#4,891 |
| 64. | Sutherland | 0.39% | 0.35%(+0.034)#64 | 0.67%(-0.281)#4,898 |
| 65. | Dayton | 0.36% | 0.35%(+0.012)#65 | 0.67%(-0.303)#5,052 |
| 66. | Cascade | 0.35% | 0.35%(-0.006)#66 | 0.67%(-0.321)#5,175 |
| 67. | Decorah | 0.34% | 0.35%(-0.010)#67 | 0.67%(-0.326)#5,202 |
| 68. | Elk Run Heights | 0.34% | 0.35%(-0.013)#68 | 0.67%(-0.329)#5,218 |
| 69. | Eddyville | 0.34% | 0.35%(-0.015)#69 | 0.67%(-0.330)#5,228 |
| 70. | Panora | 0.34% | 0.35%(-0.016)#70 | 0.67%(-0.332)#5,236 |
| 71. | Aplington | 0.33% | 0.35%(-0.021)#71 | 0.67%(-0.336)#5,267 |
| 72. | Carter Lake | 0.32% | 0.35%(-0.034)#72 | 0.67%(-0.350)#5,356 |
| 73. | Cedar Falls | 0.31% | 0.35%(-0.037)#73 | 0.67%(-0.353)#5,373 |
| 74. | Pierson | 0.31% | 0.35%(-0.044)#74 | 0.67%(-0.359)#5,426 |
| 75. | Ely | 0.29% | 0.35%(-0.058)#75 | 0.67%(-0.374)#5,545 |
| 76. | Baxter | 0.29% | 0.35%(-0.062)#76 | 0.67%(-0.378)#5,591 |
| 77. | Sloan | 0.29% | 0.35%(-0.066)#77 | 0.67%(-0.382)#5,619 |
| 78. | Davenport | 0.28% | 0.35%(-0.069)#78 | 0.67%(-0.384)#5,645 |
| 79. | Adel | 0.28% | 0.35%(-0.073)#79 | 0.67%(-0.388)#5,689 |
| 80. | Story City | 0.27% | 0.35%(-0.083)#80 | 0.67%(-0.399)#5,797 |
| 81. | Sanborn | 0.26% | 0.35%(-0.091)#81 | 0.67%(-0.407)#5,875 |
| 82. | Britt | 0.26% | 0.35%(-0.091)#82 | 0.67%(-0.407)#5,877 |
| 83. | Knoxville | 0.25% | 0.35%(-0.099)#83 | 0.67%(-0.415)#5,946 |
| 84. | Brooklyn | 0.25% | 0.35%(-0.102)#84 | 0.67%(-0.417)#5,975 |
| 85. | Ames | 0.23% | 0.35%(-0.122)#85 | 0.67%(-0.438)#6,176 |
| 86. | Cedar Rapids | 0.22% | 0.35%(-0.127)#86 | 0.67%(-0.442)#6,217 |
| 87. | Ottumwa | 0.22% | 0.35%(-0.135)#87 | 0.67%(-0.450)#6,298 |
| 88. | Thornton | 0.21% | 0.35%(-0.137)#88 | 0.67%(-0.453)#6,315 |
| 89. | Storm Lake | 0.21% | 0.35%(-0.137)#89 | 0.67%(-0.453)#6,318 |
| 90. | Conesville | 0.21% | 0.35%(-0.138)#90 | 0.67%(-0.453)#6,320 |
| 91. | Forest City | 0.21% | 0.35%(-0.140)#91 | 0.67%(-0.456)#6,345 |
| 92. | Walford | 0.21% | 0.35%(-0.142)#92 | 0.67%(-0.458)#6,367 |
| 93. | Van Meter | 0.20% | 0.35%(-0.147)#93 | 0.67%(-0.463)#6,417 |
| 94. | Arnolds Park | 0.20% | 0.35%(-0.149)#94 | 0.67%(-0.465)#6,435 |
| 95. | Hamburg | 0.18% | 0.35%(-0.168)#95 | 0.67%(-0.483)#6,618 |
| 96. | Norwalk | 0.18% | 0.35%(-0.168)#96 | 0.67%(-0.483)#6,619 |
| 97. | Clear Lake | 0.18% | 0.35%(-0.168)#97 | 0.67%(-0.484)#6,629 |
| 98. | Clarion | 0.18% | 0.35%(-0.173)#98 | 0.67%(-0.488)#6,675 |
| 99. | Waverly | 0.17% | 0.35%(-0.179)#99 | 0.67%(-0.494)#6,718 |
| 100. | Fayette | 0.17% | 0.35%(-0.182)#100 | 0.67%(-0.497)#6,748 |
Common Questions
What are the Top 10 Cities with the Highest Percentage of Immigrants from Eastern Europe in Iowa?
Top 10 Cities with the Highest Percentage of Immigrants from Eastern Europe in Iowa are:
#1
34.31%
#2
29.41%
#3
14.39%
#4
5.00%
#5
3.10%
#6
2.91%
#7
2.76%
#8
2.48%
#9
2.38%
#10
2.29%
What city has the Highest Percentage of Immigrants from Eastern Europe in Iowa?
Chapin has the Highest Percentage of Immigrants from Eastern Europe in Iowa with 34.31%.
What is the Percentage of Immigrants from Eastern Europe in the State of Iowa?
Percentage of Immigrants from Eastern Europe in Iowa is 0.35%.
What is the Percentage of Immigrants from Eastern Europe in the United States?
Percentage of Immigrants from Eastern Europe in the United States is 0.67%.