Cities with the Highest Percentage of Immigrants from Eastern Europe in North Carolina
RELATED REPORTS & OPTIONS
Eastern Europe
North Carolina
Compare Cities
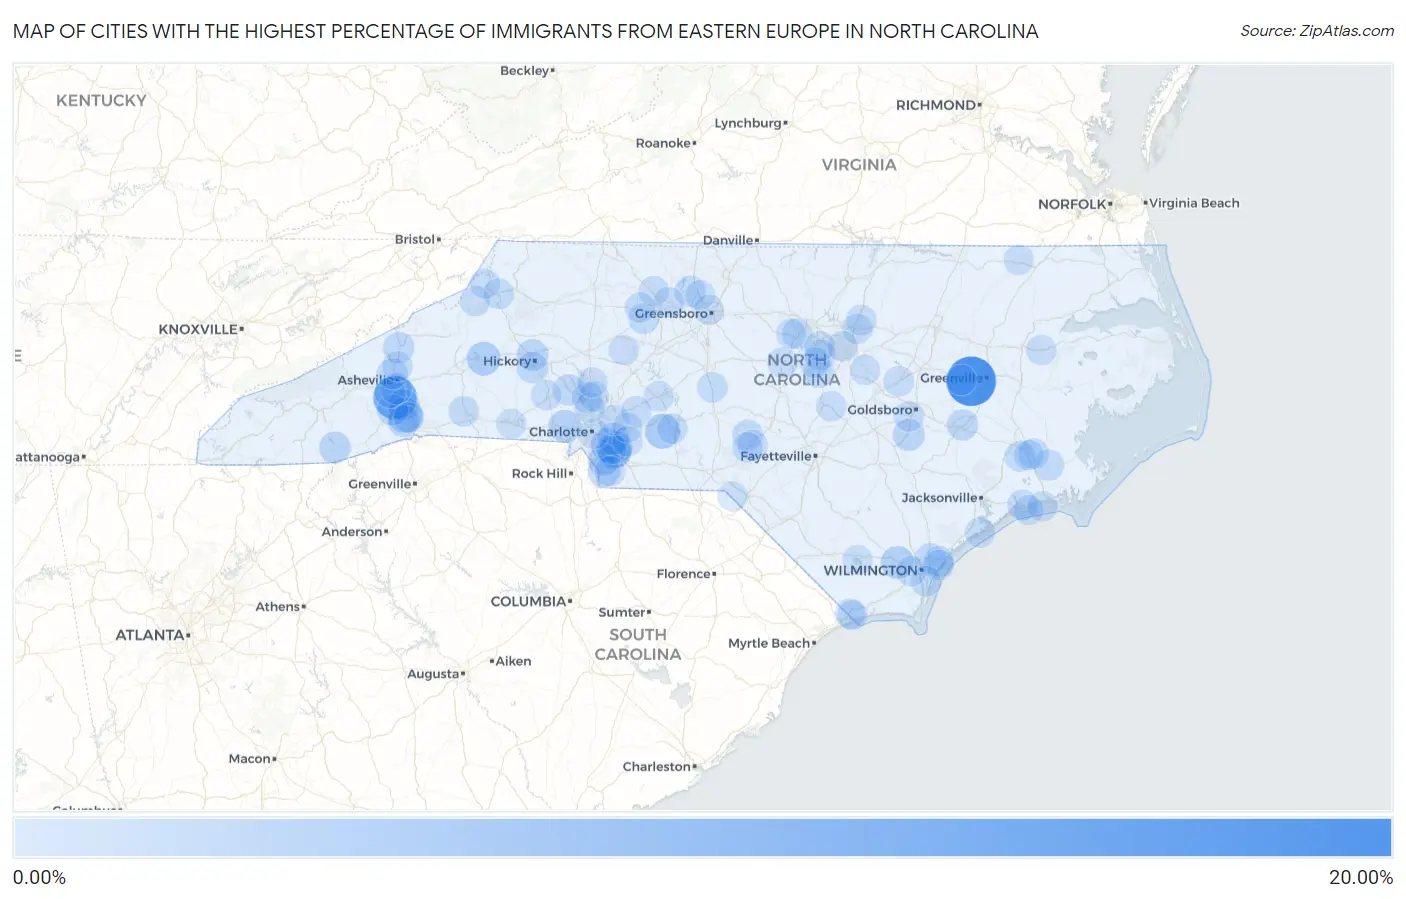
Map of Cities with the Highest Percentage of Immigrants from Eastern Europe in North Carolina
0.00%
20.00%
Cities with the Highest Percentage of Immigrants from Eastern Europe in North Carolina
| City | Eastern Europe | vs State | vs National | |
| 1. | Bell Arthur | 16.50% | 0.33%(+16.2)#1 | 0.67%(+15.8)#25 |
| 2. | Linville | 12.36% | 0.33%(+12.0)#2 | 0.67%(+11.7)#53 |
| 3. | Avery Creek | 11.29% | 0.33%(+11.0)#3 | 0.67%(+10.6)#61 |
| 4. | Balfour | 4.55% | 0.33%(+4.22)#4 | 0.67%(+3.89)#316 |
| 5. | Aquadale | 4.16% | 0.33%(+3.82)#5 | 0.67%(+3.49)#364 |
| 6. | Governors | 3.62% | 0.33%(+3.29)#6 | 0.67%(+2.96)#457 |
| 7. | Glen Alpine | 3.27% | 0.33%(+2.94)#7 | 0.67%(+2.60)#534 |
| 8. | Matthews | 2.85% | 0.33%(+2.52)#8 | 0.67%(+2.18)#652 |
| 9. | Indian Trail | 2.79% | 0.33%(+2.46)#9 | 0.67%(+2.12)#676 |
| 10. | Lake Park | 2.72% | 0.33%(+2.39)#10 | 0.67%(+2.06)#696 |
| 11. | Sandy Creek | 2.63% | 0.33%(+2.30)#11 | 0.67%(+1.96)#737 |
| 12. | Mcadenville | 2.58% | 0.33%(+2.25)#12 | 0.67%(+1.91)#768 |
| 13. | Hemby Bridge | 1.92% | 0.33%(+1.59)#13 | 0.67%(+1.26)#1,150 |
| 14. | Waxhaw | 1.84% | 0.33%(+1.51)#14 | 0.67%(+1.17)#1,227 |
| 15. | Chowan Beach | 1.83% | 0.33%(+1.50)#15 | 0.67%(+1.17)#1,233 |
| 16. | Mint Hill | 1.82% | 0.33%(+1.49)#16 | 0.67%(+1.16)#1,241 |
| 17. | Weddington | 1.78% | 0.33%(+1.45)#17 | 0.67%(+1.12)#1,286 |
| 18. | Fletcher | 1.71% | 0.33%(+1.38)#18 | 0.67%(+1.05)#1,350 |
| 19. | Mount Olive | 1.68% | 0.33%(+1.35)#19 | 0.67%(+1.01)#1,386 |
| 20. | Northlakes | 1.67% | 0.33%(+1.34)#20 | 0.67%(+1.00)#1,394 |
| 21. | Valley Hill | 1.61% | 0.33%(+1.28)#21 | 0.67%(+0.946)#1,461 |
| 22. | Cashiers | 1.60% | 0.33%(+1.26)#22 | 0.67%(+0.929)#1,486 |
| 23. | Denver | 1.50% | 0.33%(+1.16)#23 | 0.67%(+0.830)#1,611 |
| 24. | Mars Hill | 1.44% | 0.33%(+1.11)#24 | 0.67%(+0.775)#1,680 |
| 25. | Mountain View | 1.38% | 0.33%(+1.05)#25 | 0.67%(+0.717)#1,761 |
| 26. | Mills River | 1.37% | 0.33%(+1.03)#26 | 0.67%(+0.699)#1,784 |
| 27. | Asheville | 1.28% | 0.33%(+0.944)#27 | 0.67%(+0.609)#1,912 |
| 28. | Kinston | 1.25% | 0.33%(+0.916)#28 | 0.67%(+0.581)#1,958 |
| 29. | Stokesdale | 1.24% | 0.33%(+0.905)#29 | 0.67%(+0.570)#1,987 |
| 30. | Bent Creek | 1.11% | 0.33%(+0.774)#30 | 0.67%(+0.440)#2,231 |
| 31. | Northchase | 1.08% | 0.33%(+0.750)#31 | 0.67%(+0.415)#2,274 |
| 32. | Woodfin | 1.08% | 0.33%(+0.744)#32 | 0.67%(+0.409)#2,293 |
| 33. | Cary | 1.05% | 0.33%(+0.714)#33 | 0.67%(+0.379)#2,363 |
| 34. | Minnesott Beach | 1.03% | 0.33%(+0.697)#34 | 0.67%(+0.362)#2,402 |
| 35. | Stallings | 0.95% | 0.33%(+0.619)#35 | 0.67%(+0.284)#2,583 |
| 36. | Cypress Landing | 0.95% | 0.33%(+0.618)#36 | 0.67%(+0.283)#2,585 |
| 37. | Holly Springs | 0.93% | 0.33%(+0.601)#37 | 0.67%(+0.266)#2,636 |
| 38. | Chapel Hill | 0.91% | 0.33%(+0.577)#38 | 0.67%(+0.243)#2,703 |
| 39. | Brices Creek | 0.87% | 0.33%(+0.538)#39 | 0.67%(+0.203)#2,811 |
| 40. | Pinehurst | 0.86% | 0.33%(+0.523)#40 | 0.67%(+0.188)#2,862 |
| 41. | Harrisburg | 0.83% | 0.33%(+0.497)#41 | 0.67%(+0.162)#2,930 |
| 42. | Briar Chapel | 0.83% | 0.33%(+0.493)#42 | 0.67%(+0.158)#2,934 |
| 43. | Bayshore | 0.82% | 0.33%(+0.483)#43 | 0.67%(+0.148)#2,965 |
| 44. | Ogden | 0.80% | 0.33%(+0.472)#44 | 0.67%(+0.138)#2,998 |
| 45. | Apex | 0.79% | 0.33%(+0.460)#45 | 0.67%(+0.125)#3,050 |
| 46. | Walkertown | 0.79% | 0.33%(+0.456)#46 | 0.67%(+0.122)#3,056 |
| 47. | Silver Lake | 0.77% | 0.33%(+0.436)#47 | 0.67%(+0.101)#3,124 |
| 48. | Rutherfordton | 0.76% | 0.33%(+0.430)#48 | 0.67%(+0.096)#3,141 |
| 49. | Boone | 0.75% | 0.33%(+0.416)#49 | 0.67%(+0.082)#3,192 |
| 50. | Fairfield Harbour | 0.75% | 0.33%(+0.413)#50 | 0.67%(+0.079)#3,203 |
| 51. | Seagrove | 0.74% | 0.33%(+0.408)#51 | 0.67%(+0.074)#3,210 |
| 52. | Clemmons | 0.73% | 0.33%(+0.401)#52 | 0.67%(+0.066)#3,235 |
| 53. | Cornelius | 0.72% | 0.33%(+0.388)#53 | 0.67%(+0.053)#3,286 |
| 54. | Farmville | 0.72% | 0.33%(+0.383)#54 | 0.67%(+0.048)#3,307 |
| 55. | Aberdeen | 0.68% | 0.33%(+0.348)#55 | 0.67%(+0.013)#3,449 |
| 56. | Pinebluff | 0.68% | 0.33%(+0.347)#56 | 0.67%(+0.012)#3,452 |
| 57. | Cape Carteret | 0.68% | 0.33%(+0.347)#57 | 0.67%(+0.012)#3,454 |
| 58. | Kenly | 0.67% | 0.33%(+0.340)#58 | 0.67%(+0.006)#3,480 |
| 59. | Youngsville | 0.66% | 0.33%(+0.329)#59 | 0.67%(-0.006)#3,527 |
| 60. | Leland | 0.66% | 0.33%(+0.326)#60 | 0.67%(-0.009)#3,541 |
| 61. | North Topsail Beach | 0.65% | 0.33%(+0.313)#61 | 0.67%(-0.022)#3,587 |
| 62. | Pittsboro | 0.64% | 0.33%(+0.304)#62 | 0.67%(-0.030)#3,632 |
| 63. | Rural Hall | 0.62% | 0.33%(+0.290)#63 | 0.67%(-0.045)#3,690 |
| 64. | Charlotte | 0.62% | 0.33%(+0.287)#64 | 0.67%(-0.048)#3,696 |
| 65. | Mar Mac | 0.60% | 0.33%(+0.271)#65 | 0.67%(-0.063)#3,772 |
| 66. | Carrboro | 0.60% | 0.33%(+0.266)#66 | 0.67%(-0.069)#3,795 |
| 67. | James City | 0.60% | 0.33%(+0.265)#67 | 0.67%(-0.069)#3,796 |
| 68. | Hendersonville | 0.60% | 0.33%(+0.264)#68 | 0.67%(-0.071)#3,799 |
| 69. | Wake Forest | 0.59% | 0.33%(+0.261)#69 | 0.67%(-0.074)#3,812 |
| 70. | Lewisville | 0.59% | 0.33%(+0.260)#70 | 0.67%(-0.075)#3,818 |
| 71. | Norwood | 0.58% | 0.33%(+0.253)#71 | 0.67%(-0.082)#3,850 |
| 72. | Lincolnton | 0.58% | 0.33%(+0.247)#72 | 0.67%(-0.088)#3,877 |
| 73. | Carolina Shores | 0.56% | 0.33%(+0.228)#73 | 0.67%(-0.107)#3,958 |
| 74. | Raleigh | 0.54% | 0.33%(+0.212)#74 | 0.67%(-0.123)#4,032 |
| 75. | Richfield | 0.54% | 0.33%(+0.211)#75 | 0.67%(-0.124)#4,040 |
| 76. | Jamesville | 0.52% | 0.33%(+0.189)#76 | 0.67%(-0.146)#4,138 |
| 77. | Fairview | 0.51% | 0.33%(+0.180)#77 | 0.67%(-0.155)#4,189 |
| 78. | Mineral Springs | 0.50% | 0.33%(+0.170)#78 | 0.67%(-0.165)#4,232 |
| 79. | Buies Creek | 0.50% | 0.33%(+0.169)#79 | 0.67%(-0.166)#4,239 |
| 80. | Banner Elk | 0.49% | 0.33%(+0.154)#80 | 0.67%(-0.181)#4,312 |
| 81. | Morrisville | 0.47% | 0.33%(+0.138)#81 | 0.67%(-0.197)#4,401 |
| 82. | Davidson | 0.47% | 0.33%(+0.135)#82 | 0.67%(-0.200)#4,416 |
| 83. | Huntersville | 0.47% | 0.33%(+0.133)#83 | 0.67%(-0.201)#4,421 |
| 84. | Weaverville | 0.46% | 0.33%(+0.128)#84 | 0.67%(-0.206)#4,449 |
| 85. | Cooleemee | 0.46% | 0.33%(+0.125)#85 | 0.67%(-0.210)#4,467 |
| 86. | Mount Pleasant | 0.45% | 0.33%(+0.118)#86 | 0.67%(-0.217)#4,502 |
| 87. | Indian Beach | 0.44% | 0.33%(+0.112)#87 | 0.67%(-0.223)#4,536 |
| 88. | Cove Creek | 0.44% | 0.33%(+0.111)#88 | 0.67%(-0.224)#4,547 |
| 89. | Mooresville | 0.44% | 0.33%(+0.107)#89 | 0.67%(-0.227)#4,561 |
| 90. | Clayton | 0.44% | 0.33%(+0.107)#90 | 0.67%(-0.227)#4,562 |
| 91. | Calabash | 0.43% | 0.33%(+0.096)#91 | 0.67%(-0.239)#4,635 |
| 92. | Midland | 0.43% | 0.33%(+0.096)#92 | 0.67%(-0.239)#4,637 |
| 93. | Greensboro | 0.42% | 0.33%(+0.091)#93 | 0.67%(-0.244)#4,661 |
| 94. | Murfreesboro | 0.42% | 0.33%(+0.089)#94 | 0.67%(-0.246)#4,673 |
| 95. | Emerald Isle | 0.41% | 0.33%(+0.081)#95 | 0.67%(-0.254)#4,723 |
| 96. | Lake Waccamaw | 0.41% | 0.33%(+0.078)#96 | 0.67%(-0.257)#4,743 |
| 97. | Grandy | 0.41% | 0.33%(+0.078)#97 | 0.67%(-0.257)#4,746 |
| 98. | Gibson | 0.40% | 0.33%(+0.069)#98 | 0.67%(-0.266)#4,796 |
| 99. | Summerfield | 0.38% | 0.33%(+0.050)#99 | 0.67%(-0.285)#4,928 |
| 100. | Shelby | 0.38% | 0.33%(+0.050)#100 | 0.67%(-0.285)#4,929 |
Common Questions
What are the Top 10 Cities with the Highest Percentage of Immigrants from Eastern Europe in North Carolina?
Top 10 Cities with the Highest Percentage of Immigrants from Eastern Europe in North Carolina are:
#1
16.50%
#2
11.29%
#3
4.55%
#4
4.16%
#5
3.27%
#6
2.85%
#7
2.79%
#8
2.72%
#9
2.63%
#10
2.58%
What city has the Highest Percentage of Immigrants from Eastern Europe in North Carolina?
Bell Arthur has the Highest Percentage of Immigrants from Eastern Europe in North Carolina with 16.50%.
What is the Percentage of Immigrants from Eastern Europe in the State of North Carolina?
Percentage of Immigrants from Eastern Europe in North Carolina is 0.33%.
What is the Percentage of Immigrants from Eastern Europe in the United States?
Percentage of Immigrants from Eastern Europe in the United States is 0.67%.