Cities with the Highest Percentage of Immigrants from Eastern Europe in Indiana
RELATED REPORTS & OPTIONS
Eastern Europe
Indiana
Compare Cities
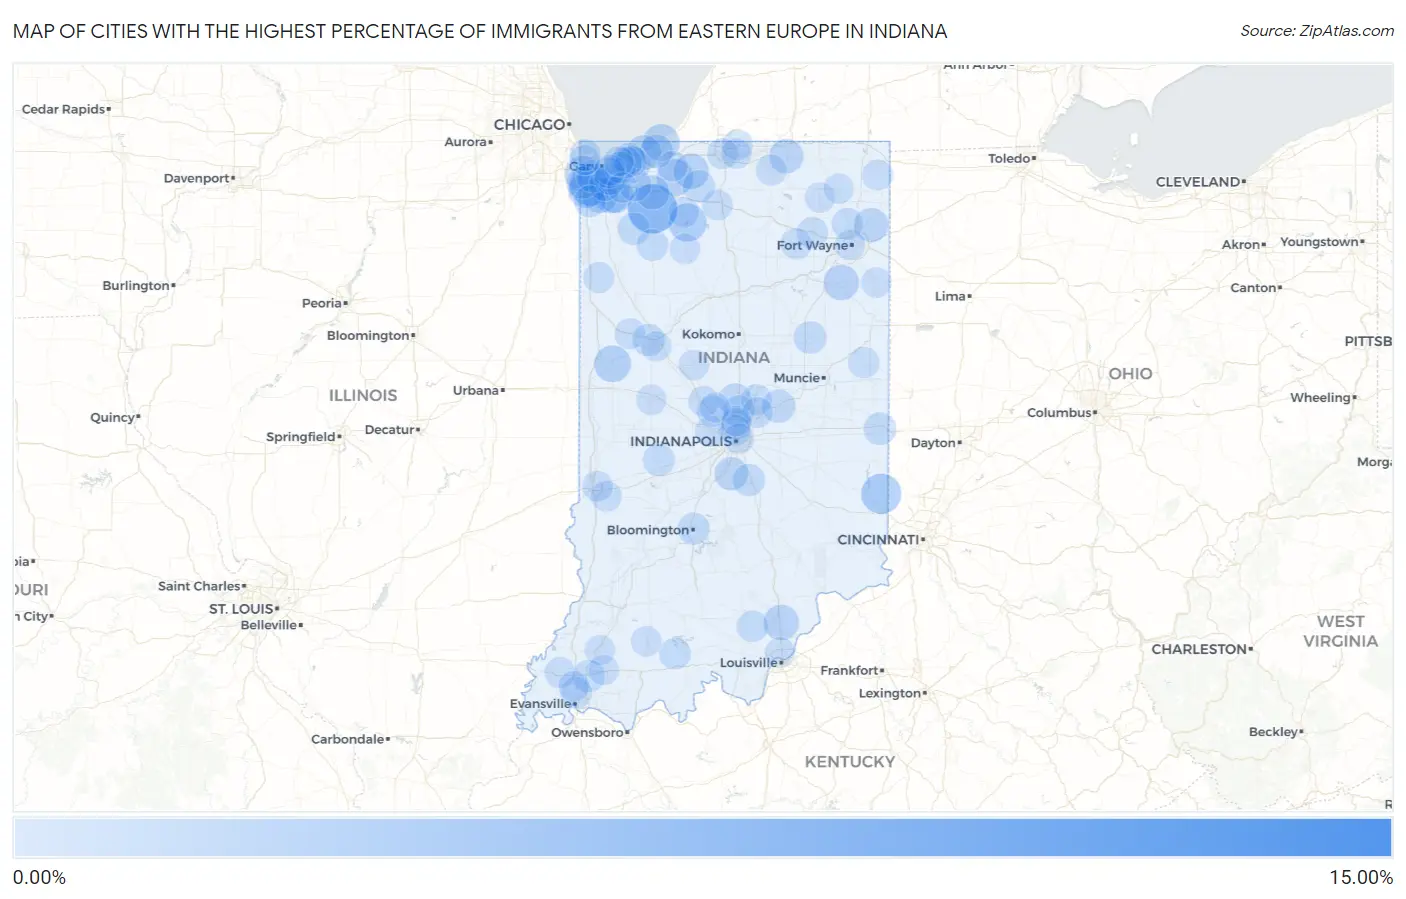
Map of Cities with the Highest Percentage of Immigrants from Eastern Europe in Indiana
0.00%
15.00%
Cities with the Highest Percentage of Immigrants from Eastern Europe in Indiana
| City | Eastern Europe | vs State | vs National | |
| 1. | Foster | 12.77% | 0.28%(+12.5)#1 | 0.67%(+12.1)#47 |
| 2. | Lyford | 9.54% | 0.28%(+9.26)#2 | 0.67%(+8.87)#84 |
| 3. | Shipshewana Lake | 6.56% | 0.28%(+6.29)#3 | 0.67%(+5.90)#156 |
| 4. | La Crosse | 6.16% | 0.28%(+5.89)#4 | 0.67%(+5.49)#179 |
| 5. | Schererville | 3.66% | 0.28%(+3.39)#5 | 0.67%(+3.00)#448 |
| 6. | Ardmore | 3.29% | 0.28%(+3.02)#6 | 0.67%(+2.62)#523 |
| 7. | Mount Carmel | 3.23% | 0.28%(+2.95)#7 | 0.67%(+2.56)#542 |
| 8. | Bass Lake | 2.65% | 0.28%(+2.38)#8 | 0.67%(+1.99)#725 |
| 9. | Gilmer Park | 2.57% | 0.28%(+2.30)#9 | 0.67%(+1.90)#770 |
| 10. | Kingsbury | 2.20% | 0.28%(+1.93)#10 | 0.67%(+1.54)#962 |
| 11. | Attica | 2.19% | 0.28%(+1.91)#11 | 0.67%(+1.52)#973 |
| 12. | Michiana Shores | 2.14% | 0.28%(+1.87)#12 | 0.67%(+1.48)#996 |
| 13. | Winfield | 2.02% | 0.28%(+1.75)#13 | 0.67%(+1.36)#1,087 |
| 14. | Crown Point | 1.95% | 0.28%(+1.68)#14 | 0.67%(+1.29)#1,131 |
| 15. | Lakes Of The Four Seasons | 1.94% | 0.28%(+1.66)#15 | 0.67%(+1.27)#1,140 |
| 16. | Munster | 1.88% | 0.28%(+1.60)#16 | 0.67%(+1.21)#1,187 |
| 17. | St John | 1.88% | 0.28%(+1.60)#17 | 0.67%(+1.21)#1,191 |
| 18. | Chesterton | 1.80% | 0.28%(+1.53)#18 | 0.67%(+1.14)#1,260 |
| 19. | Henryville | 1.80% | 0.28%(+1.52)#19 | 0.67%(+1.13)#1,269 |
| 20. | Uniondale | 1.79% | 0.28%(+1.52)#20 | 0.67%(+1.13)#1,271 |
| 21. | Fish Lake | 1.79% | 0.28%(+1.51)#21 | 0.67%(+1.12)#1,279 |
| 22. | Underwood | 1.77% | 0.28%(+1.49)#22 | 0.67%(+1.10)#1,299 |
| 23. | Beverly Shores | 1.56% | 0.28%(+1.28)#23 | 0.67%(+0.890)#1,527 |
| 24. | Middlebury | 1.44% | 0.28%(+1.17)#24 | 0.67%(+0.774)#1,682 |
| 25. | Grabill | 1.42% | 0.28%(+1.14)#25 | 0.67%(+0.752)#1,706 |
| 26. | Wanatah | 1.32% | 0.28%(+1.04)#26 | 0.67%(+0.653)#1,838 |
| 27. | Trail Creek | 1.24% | 0.28%(+0.963)#27 | 0.67%(+0.572)#1,985 |
| 28. | Bargersville | 1.19% | 0.28%(+0.911)#28 | 0.67%(+0.520)#2,077 |
| 29. | Westfield | 1.15% | 0.28%(+0.874)#29 | 0.67%(+0.483)#2,138 |
| 30. | Pendleton | 1.13% | 0.28%(+0.859)#30 | 0.67%(+0.467)#2,166 |
| 31. | Spring Grove | 0.94% | 0.28%(+0.661)#31 | 0.67%(+0.270)#2,619 |
| 32. | Valparaiso | 0.90% | 0.28%(+0.622)#32 | 0.67%(+0.230)#2,732 |
| 33. | Upland | 0.88% | 0.28%(+0.607)#33 | 0.67%(+0.216)#2,765 |
| 34. | Franklin | 0.86% | 0.28%(+0.587)#34 | 0.67%(+0.196)#2,836 |
| 35. | Walkerton | 0.84% | 0.28%(+0.565)#35 | 0.67%(+0.174)#2,899 |
| 36. | Wheatfield | 0.82% | 0.28%(+0.545)#36 | 0.67%(+0.154)#2,954 |
| 37. | West Lafayette | 0.81% | 0.28%(+0.536)#37 | 0.67%(+0.144)#2,976 |
| 38. | Elberfeld | 0.81% | 0.28%(+0.531)#38 | 0.67%(+0.139)#2,987 |
| 39. | Dyer | 0.79% | 0.28%(+0.517)#39 | 0.67%(+0.125)#3,049 |
| 40. | Griffith | 0.77% | 0.28%(+0.497)#40 | 0.67%(+0.105)#3,113 |
| 41. | Bloomington | 0.76% | 0.28%(+0.480)#41 | 0.67%(+0.089)#3,163 |
| 42. | Merrillville | 0.75% | 0.28%(+0.478)#42 | 0.67%(+0.087)#3,176 |
| 43. | Hobart | 0.75% | 0.28%(+0.475)#43 | 0.67%(+0.084)#3,183 |
| 44. | Greencastle | 0.74% | 0.28%(+0.464)#44 | 0.67%(+0.073)#3,214 |
| 45. | Cedar Lake | 0.70% | 0.28%(+0.428)#45 | 0.67%(+0.036)#3,354 |
| 46. | Dune Acres | 0.68% | 0.28%(+0.407)#46 | 0.67%(+0.015)#3,438 |
| 47. | Carmel | 0.66% | 0.28%(+0.387)#47 | 0.67%(-0.004)#3,520 |
| 48. | Medaryville | 0.64% | 0.28%(+0.365)#48 | 0.67%(-0.026)#3,608 |
| 49. | Huntertown | 0.61% | 0.28%(+0.329)#49 | 0.67%(-0.062)#3,764 |
| 50. | Highland | 0.59% | 0.28%(+0.315)#50 | 0.67%(-0.077)#3,828 |
| 51. | Birdseye | 0.59% | 0.28%(+0.312)#51 | 0.67%(-0.079)#3,838 |
| 52. | Porter | 0.58% | 0.28%(+0.301)#52 | 0.67%(-0.091)#3,890 |
| 53. | New Pekin | 0.57% | 0.28%(+0.296)#53 | 0.67%(-0.095)#3,908 |
| 54. | Whiting | 0.57% | 0.28%(+0.293)#54 | 0.67%(-0.099)#3,926 |
| 55. | Portage | 0.55% | 0.28%(+0.278)#55 | 0.67%(-0.113)#3,985 |
| 56. | Whitestown | 0.53% | 0.28%(+0.251)#56 | 0.67%(-0.140)#4,099 |
| 57. | Ridgeville | 0.52% | 0.28%(+0.248)#57 | 0.67%(-0.144)#4,116 |
| 58. | Columbia City | 0.52% | 0.28%(+0.241)#58 | 0.67%(-0.150)#4,164 |
| 59. | Noblesville | 0.51% | 0.28%(+0.232)#59 | 0.67%(-0.159)#4,202 |
| 60. | Burns Harbor | 0.50% | 0.28%(+0.222)#60 | 0.67%(-0.169)#4,251 |
| 61. | New Chicago | 0.47% | 0.28%(+0.198)#61 | 0.67%(-0.193)#4,381 |
| 62. | South Whitley | 0.47% | 0.28%(+0.196)#62 | 0.67%(-0.196)#4,394 |
| 63. | Cynthiana | 0.43% | 0.28%(+0.152)#63 | 0.67%(-0.240)#4,640 |
| 64. | Brook | 0.42% | 0.28%(+0.141)#64 | 0.67%(-0.250)#4,705 |
| 65. | Goshen | 0.41% | 0.28%(+0.136)#65 | 0.67%(-0.255)#4,730 |
| 66. | Riley | 0.39% | 0.28%(+0.116)#66 | 0.67%(-0.276)#4,868 |
| 67. | Lebanon | 0.38% | 0.28%(+0.106)#67 | 0.67%(-0.285)#4,932 |
| 68. | Fishers | 0.36% | 0.28%(+0.088)#68 | 0.67%(-0.304)#5,055 |
| 69. | Hamilton | 0.35% | 0.28%(+0.079)#69 | 0.67%(-0.313)#5,118 |
| 70. | Granger | 0.35% | 0.28%(+0.077)#70 | 0.67%(-0.314)#5,129 |
| 71. | Lake Station | 0.35% | 0.28%(+0.076)#71 | 0.67%(-0.315)#5,139 |
| 72. | Meridian Hills | 0.34% | 0.28%(+0.068)#72 | 0.67%(-0.323)#5,189 |
| 73. | Plymouth | 0.34% | 0.28%(+0.062)#73 | 0.67%(-0.330)#5,227 |
| 74. | Otterbein | 0.33% | 0.28%(+0.059)#74 | 0.67%(-0.332)#5,242 |
| 75. | South Bend | 0.33% | 0.28%(+0.053)#75 | 0.67%(-0.338)#5,283 |
| 76. | Rocky Ripple | 0.33% | 0.28%(+0.050)#76 | 0.67%(-0.341)#5,306 |
| 77. | Darmstadt | 0.32% | 0.28%(+0.041)#77 | 0.67%(-0.350)#5,357 |
| 78. | Winamac | 0.31% | 0.28%(+0.039)#78 | 0.67%(-0.353)#5,374 |
| 79. | Jasper | 0.31% | 0.28%(+0.034)#79 | 0.67%(-0.358)#5,415 |
| 80. | Frankfort | 0.31% | 0.28%(+0.031)#80 | 0.67%(-0.360)#5,433 |
| 81. | Terre Haute | 0.30% | 0.28%(+0.028)#81 | 0.67%(-0.363)#5,459 |
| 82. | Fort Wayne | 0.30% | 0.28%(+0.022)#82 | 0.67%(-0.369)#5,508 |
| 83. | Brownsburg | 0.28% | 0.28%(+0.007)#83 | 0.67%(-0.385)#5,655 |
| 84. | Mishawaka | 0.27% | 0.28%(-0.005)#84 | 0.67%(-0.396)#5,772 |
| 85. | Crawfordsville | 0.27% | 0.28%(-0.006)#85 | 0.67%(-0.398)#5,789 |
| 86. | Indianapolis | 0.24% | 0.28%(-0.037)#86 | 0.67%(-0.428)#6,085 |
| 87. | Decatur | 0.24% | 0.28%(-0.039)#87 | 0.67%(-0.430)#6,103 |
| 88. | La Porte | 0.24% | 0.28%(-0.039)#88 | 0.67%(-0.431)#6,105 |
| 89. | Knox | 0.23% | 0.28%(-0.042)#89 | 0.67%(-0.433)#6,129 |
| 90. | Hammond | 0.23% | 0.28%(-0.043)#90 | 0.67%(-0.435)#6,143 |
| 91. | Williams Creek | 0.22% | 0.28%(-0.054)#91 | 0.67%(-0.445)#6,242 |
| 92. | Shorewood Forest | 0.22% | 0.28%(-0.058)#92 | 0.67%(-0.449)#6,286 |
| 93. | Albion | 0.21% | 0.28%(-0.064)#93 | 0.67%(-0.455)#6,344 |
| 94. | Oakland City | 0.21% | 0.28%(-0.069)#94 | 0.67%(-0.461)#6,399 |
| 95. | Lafayette | 0.20% | 0.28%(-0.072)#95 | 0.67%(-0.464)#6,425 |
| 96. | Lynnville | 0.20% | 0.28%(-0.080)#96 | 0.67%(-0.471)#6,502 |
| 97. | Clarksville | 0.19% | 0.28%(-0.081)#97 | 0.67%(-0.472)#6,522 |
| 98. | Kendallville | 0.19% | 0.28%(-0.089)#98 | 0.67%(-0.480)#6,594 |
| 99. | Zionsville | 0.18% | 0.28%(-0.101)#99 | 0.67%(-0.492)#6,706 |
| 100. | Ogden Dunes | 0.16% | 0.28%(-0.112)#100 | 0.67%(-0.503)#6,806 |
Common Questions
What are the Top 10 Cities with the Highest Percentage of Immigrants from Eastern Europe in Indiana?
Top 10 Cities with the Highest Percentage of Immigrants from Eastern Europe in Indiana are:
#1
6.16%
#2
3.66%
#3
3.23%
#4
2.65%
#5
2.20%
#6
2.19%
#7
2.14%
#8
2.02%
#9
1.95%
#10
1.94%
What city has the Highest Percentage of Immigrants from Eastern Europe in Indiana?
La Crosse has the Highest Percentage of Immigrants from Eastern Europe in Indiana with 6.16%.
What is the Percentage of Immigrants from Eastern Europe in the State of Indiana?
Percentage of Immigrants from Eastern Europe in Indiana is 0.28%.
What is the Percentage of Immigrants from Eastern Europe in the United States?
Percentage of Immigrants from Eastern Europe in the United States is 0.67%.