Cities with the Highest Percentage of Immigrants from Eastern Europe in Missouri
RELATED REPORTS & OPTIONS
Eastern Europe
Missouri
Compare Cities
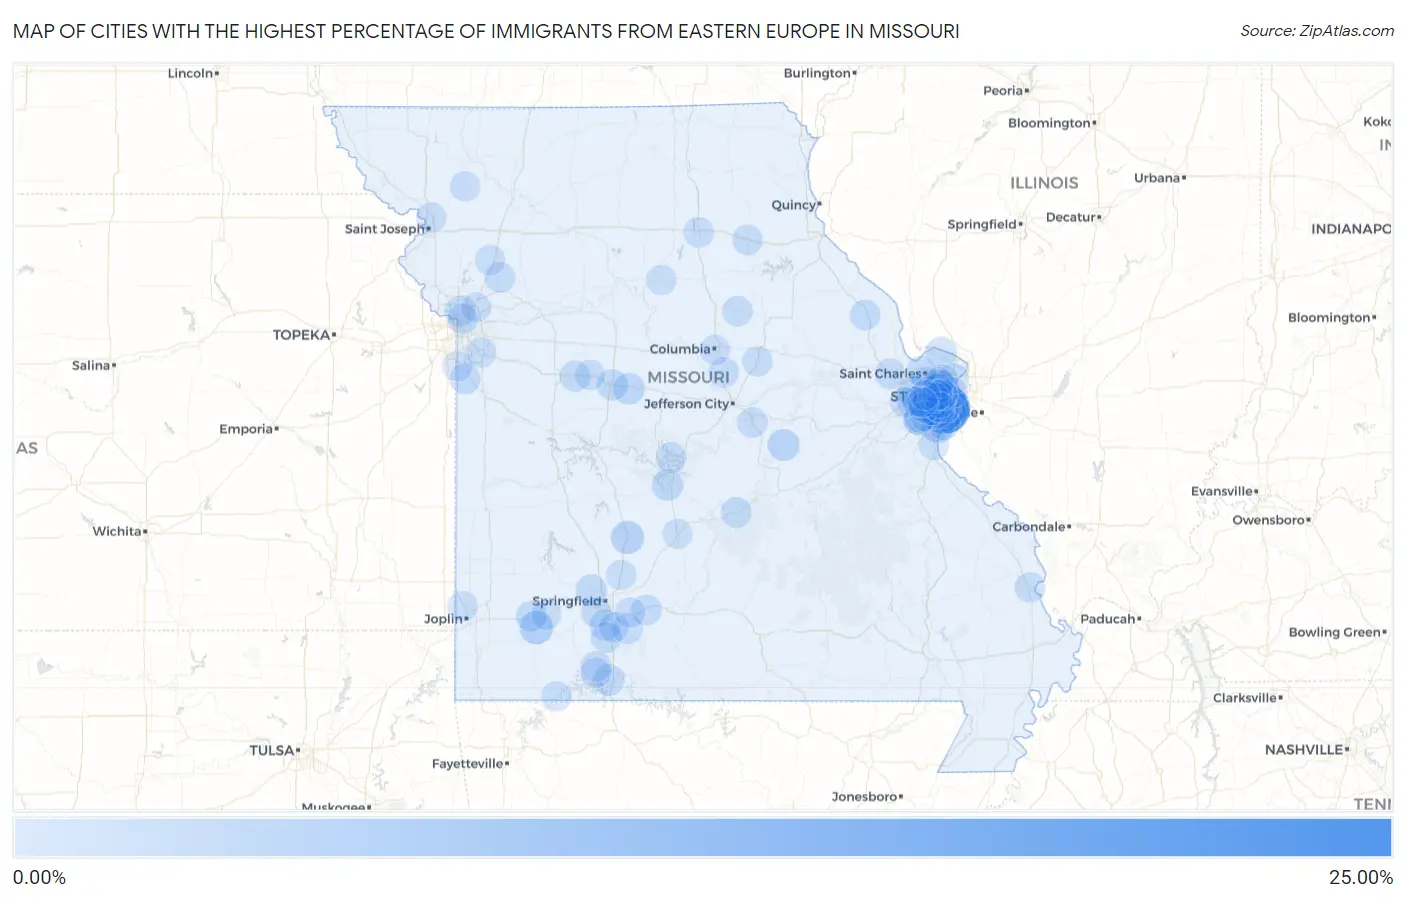
Map of Cities with the Highest Percentage of Immigrants from Eastern Europe in Missouri
0.00%
25.00%
Cities with the Highest Percentage of Immigrants from Eastern Europe in Missouri
| City | Eastern Europe | vs State | vs National | |
| 1. | St George | 22.40% | 0.41%(+22.0)#1 | 0.67%(+21.7)#12 |
| 2. | Bella Villa | 13.81% | 0.41%(+13.4)#2 | 0.67%(+13.1)#37 |
| 3. | Mehlville | 7.27% | 0.41%(+6.87)#3 | 0.67%(+6.61)#125 |
| 4. | Lemay | 6.86% | 0.41%(+6.45)#4 | 0.67%(+6.19)#142 |
| 5. | Affton | 5.27% | 0.41%(+4.86)#5 | 0.67%(+4.60)#235 |
| 6. | Green Park | 5.13% | 0.41%(+4.73)#6 | 0.67%(+4.47)#250 |
| 7. | Lakeshire | 4.22% | 0.41%(+3.81)#7 | 0.67%(+3.55)#355 |
| 8. | Freistatt | 3.92% | 0.41%(+3.52)#8 | 0.67%(+3.25)#404 |
| 9. | Buffalo | 3.53% | 0.41%(+3.12)#9 | 0.67%(+2.86)#485 |
| 10. | Arnold | 3.41% | 0.41%(+3.00)#10 | 0.67%(+2.74)#503 |
| 11. | Wilbur Park | 3.22% | 0.41%(+2.81)#11 | 0.67%(+2.55)#543 |
| 12. | Concord | 2.71% | 0.41%(+2.30)#12 | 0.67%(+2.04)#700 |
| 13. | Sappington | 2.47% | 0.41%(+2.07)#13 | 0.67%(+1.80)#818 |
| 14. | Chesterfield | 2.34% | 0.41%(+1.93)#14 | 0.67%(+1.67)#892 |
| 15. | Oakville | 2.31% | 0.41%(+1.91)#15 | 0.67%(+1.65)#903 |
| 16. | Belle | 2.08% | 0.41%(+1.68)#16 | 0.67%(+1.41)#1,043 |
| 17. | Smithton | 1.95% | 0.41%(+1.54)#17 | 0.67%(+1.28)#1,135 |
| 18. | Camdenton | 1.71% | 0.41%(+1.30)#18 | 0.67%(+1.04)#1,356 |
| 19. | Branson | 1.65% | 0.41%(+1.25)#19 | 0.67%(+0.985)#1,418 |
| 20. | Peaceful Village | 1.57% | 0.41%(+1.17)#20 | 0.67%(+0.908)#1,514 |
| 21. | Charlack | 1.55% | 0.41%(+1.15)#21 | 0.67%(+0.885)#1,536 |
| 22. | Sedalia | 1.54% | 0.41%(+1.14)#22 | 0.67%(+0.877)#1,546 |
| 23. | Brentwood | 1.53% | 0.41%(+1.12)#23 | 0.67%(+0.862)#1,563 |
| 24. | Portage Des Sioux | 1.52% | 0.41%(+1.11)#24 | 0.67%(+0.848)#1,583 |
| 25. | Willard | 1.50% | 0.41%(+1.09)#25 | 0.67%(+0.831)#1,610 |
| 26. | Crystal Lake Park | 1.30% | 0.41%(+0.898)#26 | 0.67%(+0.637)#1,862 |
| 27. | Knob Noster | 1.25% | 0.41%(+0.847)#27 | 0.67%(+0.586)#1,948 |
| 28. | Creve Coeur | 1.25% | 0.41%(+0.842)#28 | 0.67%(+0.580)#1,962 |
| 29. | Nixa | 1.25% | 0.41%(+0.840)#29 | 0.67%(+0.578)#1,968 |
| 30. | Oakland | 1.16% | 0.41%(+0.758)#30 | 0.67%(+0.496)#2,114 |
| 31. | Twin Oaks | 1.13% | 0.41%(+0.725)#31 | 0.67%(+0.464)#2,176 |
| 32. | Riverview Estates | 1.12% | 0.41%(+0.718)#32 | 0.67%(+0.456)#2,197 |
| 33. | Overland | 1.11% | 0.41%(+0.705)#33 | 0.67%(+0.444)#2,221 |
| 34. | St Robert | 1.11% | 0.41%(+0.701)#34 | 0.67%(+0.439)#2,232 |
| 35. | Vinita Park | 1.08% | 0.41%(+0.671)#35 | 0.67%(+0.410)#2,286 |
| 36. | Oakview | 1.04% | 0.41%(+0.630)#36 | 0.67%(+0.369)#2,385 |
| 37. | Kinloch | 1.03% | 0.41%(+0.625)#37 | 0.67%(+0.364)#2,395 |
| 38. | Stotts City | 1.02% | 0.41%(+0.615)#38 | 0.67%(+0.353)#2,422 |
| 39. | High Ridge | 1.01% | 0.41%(+0.605)#39 | 0.67%(+0.343)#2,440 |
| 40. | Maryland Heights | 1.00% | 0.41%(+0.594)#40 | 0.67%(+0.333)#2,462 |
| 41. | Highlandville | 0.96% | 0.41%(+0.557)#41 | 0.67%(+0.295)#2,552 |
| 42. | Fordland | 0.95% | 0.41%(+0.541)#42 | 0.67%(+0.279)#2,592 |
| 43. | Whiteside | 0.93% | 0.41%(+0.529)#43 | 0.67%(+0.267)#2,628 |
| 44. | Kirkwood | 0.92% | 0.41%(+0.512)#44 | 0.67%(+0.251)#2,677 |
| 45. | Winchester | 0.91% | 0.41%(+0.505)#45 | 0.67%(+0.243)#2,701 |
| 46. | Shelbina | 0.88% | 0.41%(+0.472)#46 | 0.67%(+0.210)#2,780 |
| 47. | Lake St Louis | 0.87% | 0.41%(+0.466)#47 | 0.67%(+0.205)#2,807 |
| 48. | Westphalia | 0.87% | 0.41%(+0.460)#48 | 0.67%(+0.199)#2,826 |
| 49. | Centralia | 0.85% | 0.41%(+0.448)#49 | 0.67%(+0.186)#2,866 |
| 50. | Reeds Spring | 0.83% | 0.41%(+0.427)#50 | 0.67%(+0.166)#2,916 |
| 51. | Ellisville | 0.83% | 0.41%(+0.421)#51 | 0.67%(+0.160)#2,933 |
| 52. | Village Of Four Seasons | 0.81% | 0.41%(+0.402)#52 | 0.67%(+0.141)#2,983 |
| 53. | Parkdale | 0.81% | 0.41%(+0.401)#53 | 0.67%(+0.139)#2,988 |
| 54. | Bellefontaine Neighbors | 0.80% | 0.41%(+0.393)#54 | 0.67%(+0.132)#3,020 |
| 55. | Des Peres | 0.80% | 0.41%(+0.393)#55 | 0.67%(+0.132)#3,022 |
| 56. | Clayton | 0.80% | 0.41%(+0.390)#56 | 0.67%(+0.129)#3,035 |
| 57. | Sunset Hills | 0.76% | 0.41%(+0.351)#57 | 0.67%(+0.089)#3,161 |
| 58. | Lawson | 0.70% | 0.41%(+0.294)#58 | 0.67%(+0.033)#3,370 |
| 59. | Macon | 0.70% | 0.41%(+0.291)#59 | 0.67%(+0.030)#3,384 |
| 60. | Sparta | 0.70% | 0.41%(+0.290)#60 | 0.67%(+0.029)#3,388 |
| 61. | Wildwood | 0.69% | 0.41%(+0.280)#61 | 0.67%(+0.019)#3,422 |
| 62. | La Monte | 0.68% | 0.41%(+0.274)#62 | 0.67%(+0.013)#3,447 |
| 63. | Fenton | 0.66% | 0.41%(+0.253)#63 | 0.67%(-0.008)#3,536 |
| 64. | Battlefield | 0.65% | 0.41%(+0.239)#64 | 0.67%(-0.022)#3,588 |
| 65. | Ashland | 0.63% | 0.41%(+0.228)#65 | 0.67%(-0.033)#3,643 |
| 66. | St Louis | 0.63% | 0.41%(+0.221)#66 | 0.67%(-0.040)#3,669 |
| 67. | Ballwin | 0.60% | 0.41%(+0.195)#67 | 0.67%(-0.066)#3,778 |
| 68. | Cape Girardeau | 0.59% | 0.41%(+0.187)#68 | 0.67%(-0.074)#3,813 |
| 69. | Crestwood | 0.59% | 0.41%(+0.187)#69 | 0.67%(-0.074)#3,815 |
| 70. | Avondale | 0.58% | 0.41%(+0.177)#70 | 0.67%(-0.084)#3,859 |
| 71. | Fulton | 0.58% | 0.41%(+0.171)#71 | 0.67%(-0.090)#3,887 |
| 72. | Webster Groves | 0.57% | 0.41%(+0.160)#72 | 0.67%(-0.101)#3,933 |
| 73. | Richmond Heights | 0.57% | 0.41%(+0.160)#73 | 0.67%(-0.101)#3,934 |
| 74. | Lathrop | 0.55% | 0.41%(+0.144)#74 | 0.67%(-0.117)#4,006 |
| 75. | Olivette | 0.55% | 0.41%(+0.140)#75 | 0.67%(-0.122)#4,028 |
| 76. | Valley Park | 0.54% | 0.41%(+0.134)#76 | 0.67%(-0.127)#4,049 |
| 77. | Breckenridge Hills | 0.54% | 0.41%(+0.133)#77 | 0.67%(-0.128)#4,055 |
| 78. | King City | 0.52% | 0.41%(+0.114)#78 | 0.67%(-0.147)#4,142 |
| 79. | Loch Lloyd | 0.51% | 0.41%(+0.105)#79 | 0.67%(-0.156)#4,192 |
| 80. | Pevely | 0.50% | 0.41%(+0.093)#80 | 0.67%(-0.168)#4,249 |
| 81. | Murphy | 0.50% | 0.41%(+0.093)#81 | 0.67%(-0.169)#4,250 |
| 82. | Fair Grove | 0.49% | 0.41%(+0.086)#82 | 0.67%(-0.175)#4,280 |
| 83. | Salisbury | 0.49% | 0.41%(+0.084)#83 | 0.67%(-0.178)#4,294 |
| 84. | Ozark | 0.49% | 0.41%(+0.083)#84 | 0.67%(-0.178)#4,296 |
| 85. | Carl Junction | 0.48% | 0.41%(+0.070)#85 | 0.67%(-0.191)#4,371 |
| 86. | Huntleigh | 0.47% | 0.41%(+0.059)#86 | 0.67%(-0.202)#4,422 |
| 87. | Chain O Lakes | 0.45% | 0.41%(+0.045)#87 | 0.67%(-0.217)#4,504 |
| 88. | Branson West | 0.45% | 0.41%(+0.040)#88 | 0.67%(-0.222)#4,533 |
| 89. | Country Club | 0.44% | 0.41%(+0.033)#89 | 0.67%(-0.228)#4,574 |
| 90. | Columbia | 0.43% | 0.41%(+0.028)#90 | 0.67%(-0.234)#4,599 |
| 91. | Grantwood Village | 0.43% | 0.41%(+0.027)#91 | 0.67%(-0.234)#4,605 |
| 92. | Ladue | 0.41% | 0.41%(+0.008)#92 | 0.67%(-0.253)#4,718 |
| 93. | St Charles | 0.41% | 0.41%(+0.000)#93 | 0.67%(-0.261)#4,771 |
| 94. | Lee S Summit | 0.37% | 0.41%(-0.031)#94 | 0.67%(-0.293)#4,988 |
| 95. | Rogersville | 0.37% | 0.41%(-0.036)#95 | 0.67%(-0.297)#5,016 |
| 96. | Lebanon | 0.34% | 0.41%(-0.066)#96 | 0.67%(-0.328)#5,213 |
| 97. | Mount Vernon | 0.33% | 0.41%(-0.073)#97 | 0.67%(-0.335)#5,254 |
| 98. | Town And Country | 0.33% | 0.41%(-0.078)#98 | 0.67%(-0.339)#5,290 |
| 99. | Liberty | 0.33% | 0.41%(-0.079)#99 | 0.67%(-0.340)#5,298 |
| 100. | Manchester | 0.32% | 0.41%(-0.082)#100 | 0.67%(-0.344)#5,317 |
Common Questions
What are the Top 10 Cities with the Highest Percentage of Immigrants from Eastern Europe in Missouri?
Top 10 Cities with the Highest Percentage of Immigrants from Eastern Europe in Missouri are:
#1
22.40%
#2
13.81%
#3
7.27%
#4
6.86%
#5
5.27%
#6
5.13%
#7
4.22%
#8
3.92%
#9
3.53%
#10
3.41%
What city has the Highest Percentage of Immigrants from Eastern Europe in Missouri?
St George has the Highest Percentage of Immigrants from Eastern Europe in Missouri with 22.40%.
What is the Percentage of Immigrants from Eastern Europe in the State of Missouri?
Percentage of Immigrants from Eastern Europe in Missouri is 0.41%.
What is the Percentage of Immigrants from Eastern Europe in the United States?
Percentage of Immigrants from Eastern Europe in the United States is 0.67%.