Cities with the Highest Percentage of Immigrants from Eastern Europe in Michigan
RELATED REPORTS & OPTIONS
Eastern Europe
Michigan
Compare Cities
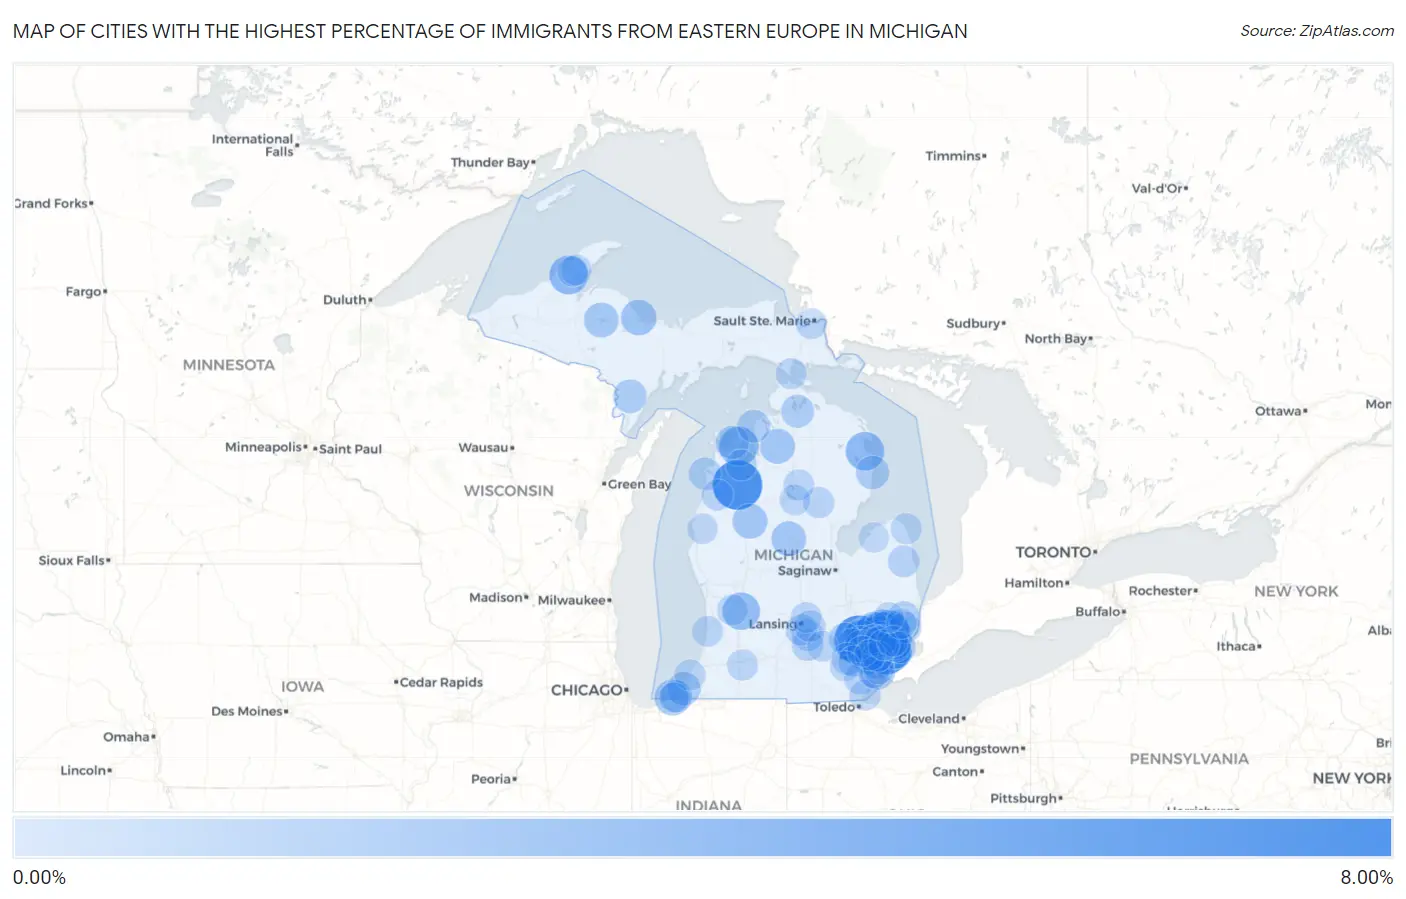
Map of Cities with the Highest Percentage of Immigrants from Eastern Europe in Michigan
0.00%
8.00%
Cities with the Highest Percentage of Immigrants from Eastern Europe in Michigan
| City | Eastern Europe | vs State | vs National | |
| 1. | Buckley | 6.18% | 0.70%(+5.48)#1 | 0.67%(+5.51)#177 |
| 2. | Wixom | 6.00% | 0.70%(+5.30)#2 | 0.67%(+5.33)#189 |
| 3. | Hamtramck | 5.92% | 0.70%(+5.22)#3 | 0.67%(+5.25)#191 |
| 4. | Sterling Heights | 4.70% | 0.70%(+4.01)#4 | 0.67%(+4.04)#294 |
| 5. | Utica | 3.89% | 0.70%(+3.19)#5 | 0.67%(+3.22)#411 |
| 6. | Walled Lake | 3.55% | 0.70%(+2.86)#6 | 0.67%(+2.89)#477 |
| 7. | Suttons Bay | 3.12% | 0.70%(+2.42)#7 | 0.67%(+2.45)#566 |
| 8. | South Range | 2.95% | 0.70%(+2.25)#8 | 0.67%(+2.28)#613 |
| 9. | Ossineke | 2.93% | 0.70%(+2.24)#9 | 0.67%(+2.27)#622 |
| 10. | Troy | 2.80% | 0.70%(+2.10)#10 | 0.67%(+2.13)#675 |
| 11. | Kentwood | 2.60% | 0.70%(+1.91)#11 | 0.67%(+1.94)#755 |
| 12. | Center Line | 2.58% | 0.70%(+1.88)#12 | 0.67%(+1.91)#767 |
| 13. | Fraser | 2.56% | 0.70%(+1.87)#13 | 0.67%(+1.90)#773 |
| 14. | Keego Harbor | 2.49% | 0.70%(+1.79)#14 | 0.67%(+1.82)#806 |
| 15. | Bloomfield Hills | 2.20% | 0.70%(+1.51)#15 | 0.67%(+1.54)#961 |
| 16. | Rochester | 2.17% | 0.70%(+1.47)#16 | 0.67%(+1.50)#984 |
| 17. | Michiana | 2.11% | 0.70%(+1.41)#17 | 0.67%(+1.44)#1,023 |
| 18. | Marquette | 2.05% | 0.70%(+1.35)#18 | 0.67%(+1.38)#1,071 |
| 19. | Orchard Lake Village | 1.92% | 0.70%(+1.23)#19 | 0.67%(+1.25)#1,152 |
| 20. | Grosse Pointe Park | 1.91% | 0.70%(+1.21)#20 | 0.67%(+1.24)#1,159 |
| 21. | Farmington | 1.91% | 0.70%(+1.21)#21 | 0.67%(+1.24)#1,164 |
| 22. | Birmingham | 1.90% | 0.70%(+1.21)#22 | 0.67%(+1.24)#1,170 |
| 23. | Grosse Pointe | 1.89% | 0.70%(+1.19)#23 | 0.67%(+1.22)#1,183 |
| 24. | Le Roy | 1.88% | 0.70%(+1.18)#24 | 0.67%(+1.21)#1,190 |
| 25. | Wolverine Lake | 1.87% | 0.70%(+1.17)#25 | 0.67%(+1.20)#1,200 |
| 26. | Alba | 1.86% | 0.70%(+1.16)#26 | 0.67%(+1.19)#1,207 |
| 27. | Clare | 1.81% | 0.70%(+1.12)#27 | 0.67%(+1.14)#1,250 |
| 28. | Rochester Hills | 1.79% | 0.70%(+1.09)#28 | 0.67%(+1.12)#1,280 |
| 29. | Michigamme | 1.77% | 0.70%(+1.07)#29 | 0.67%(+1.10)#1,297 |
| 30. | Farmington Hills | 1.74% | 0.70%(+1.05)#30 | 0.67%(+1.08)#1,323 |
| 31. | Warren | 1.73% | 0.70%(+1.04)#31 | 0.67%(+1.06)#1,337 |
| 32. | Dearborn Heights | 1.68% | 0.70%(+0.983)#32 | 0.67%(+1.01)#1,387 |
| 33. | Oak Park | 1.64% | 0.70%(+0.942)#33 | 0.67%(+0.970)#1,439 |
| 34. | Gibraltar | 1.62% | 0.70%(+0.920)#34 | 0.67%(+0.949)#1,458 |
| 35. | Clawson | 1.62% | 0.70%(+0.920)#35 | 0.67%(+0.949)#1,460 |
| 36. | Auburn Hills | 1.60% | 0.70%(+0.906)#36 | 0.67%(+0.935)#1,471 |
| 37. | St Clair Shores | 1.51% | 0.70%(+0.811)#37 | 0.67%(+0.840)#1,594 |
| 38. | Carney | 1.47% | 0.70%(+0.775)#38 | 0.67%(+0.803)#1,643 |
| 39. | Shorewood Tower Hills Harbert | 1.47% | 0.70%(+0.770)#39 | 0.67%(+0.799)#1,647 |
| 40. | Livonia | 1.46% | 0.70%(+0.768)#40 | 0.67%(+0.797)#1,651 |
| 41. | Madison Heights | 1.45% | 0.70%(+0.752)#41 | 0.67%(+0.781)#1,672 |
| 42. | Leland | 1.42% | 0.70%(+0.725)#42 | 0.67%(+0.753)#1,703 |
| 43. | Westland | 1.42% | 0.70%(+0.724)#43 | 0.67%(+0.753)#1,705 |
| 44. | Novi | 1.42% | 0.70%(+0.720)#44 | 0.67%(+0.749)#1,713 |
| 45. | Harrisville | 1.40% | 0.70%(+0.704)#45 | 0.67%(+0.733)#1,734 |
| 46. | Indian River | 1.30% | 0.70%(+0.605)#46 | 0.67%(+0.633)#1,869 |
| 47. | Norwood | 1.28% | 0.70%(+0.586)#47 | 0.67%(+0.615)#1,902 |
| 48. | South Lyon | 1.26% | 0.70%(+0.568)#48 | 0.67%(+0.597)#1,930 |
| 49. | Frankfort | 1.18% | 0.70%(+0.482)#49 | 0.67%(+0.510)#2,089 |
| 50. | Northville | 1.17% | 0.70%(+0.470)#50 | 0.67%(+0.499)#2,110 |
| 51. | Richmond | 1.13% | 0.70%(+0.432)#51 | 0.67%(+0.461)#2,182 |
| 52. | Southfield | 1.12% | 0.70%(+0.429)#52 | 0.67%(+0.458)#2,190 |
| 53. | New Buffalo | 1.10% | 0.70%(+0.405)#53 | 0.67%(+0.434)#2,243 |
| 54. | Brighton | 1.08% | 0.70%(+0.386)#54 | 0.67%(+0.415)#2,277 |
| 55. | Ann Arbor | 1.07% | 0.70%(+0.372)#55 | 0.67%(+0.401)#2,315 |
| 56. | Huntington Woods | 1.05% | 0.70%(+0.357)#56 | 0.67%(+0.386)#2,346 |
| 57. | New Baltimore | 0.98% | 0.70%(+0.287)#57 | 0.67%(+0.316)#2,501 |
| 58. | Royal Oak | 0.98% | 0.70%(+0.286)#58 | 0.67%(+0.315)#2,502 |
| 59. | Mason | 0.98% | 0.70%(+0.282)#59 | 0.67%(+0.311)#2,514 |
| 60. | Deckerville | 0.94% | 0.70%(+0.248)#60 | 0.67%(+0.277)#2,594 |
| 61. | Leslie | 0.93% | 0.70%(+0.233)#61 | 0.67%(+0.261)#2,646 |
| 62. | Village Of Grosse Pointe Shores | 0.92% | 0.70%(+0.224)#62 | 0.67%(+0.252)#2,670 |
| 63. | Wayne | 0.91% | 0.70%(+0.215)#63 | 0.67%(+0.244)#2,699 |
| 64. | Maybee | 0.91% | 0.70%(+0.213)#64 | 0.67%(+0.242)#2,707 |
| 65. | Kaleva | 0.82% | 0.70%(+0.125)#65 | 0.67%(+0.154)#2,950 |
| 66. | Holt | 0.82% | 0.70%(+0.124)#66 | 0.67%(+0.153)#2,957 |
| 67. | Ypsilanti | 0.82% | 0.70%(+0.121)#67 | 0.67%(+0.150)#2,961 |
| 68. | Luna Pier | 0.82% | 0.70%(+0.120)#68 | 0.67%(+0.149)#2,964 |
| 69. | Southgate | 0.80% | 0.70%(+0.109)#69 | 0.67%(+0.138)#2,997 |
| 70. | Okemos | 0.80% | 0.70%(+0.106)#70 | 0.67%(+0.135)#3,007 |
| 71. | Bingham Farms | 0.80% | 0.70%(+0.105)#71 | 0.67%(+0.134)#3,011 |
| 72. | Flat Rock | 0.78% | 0.70%(+0.089)#72 | 0.67%(+0.118)#3,071 |
| 73. | West Branch | 0.77% | 0.70%(+0.077)#73 | 0.67%(+0.106)#3,110 |
| 74. | Dollar Bay | 0.76% | 0.70%(+0.064)#74 | 0.67%(+0.093)#3,148 |
| 75. | Trenton | 0.76% | 0.70%(+0.064)#75 | 0.67%(+0.093)#3,149 |
| 76. | Shoreham | 0.76% | 0.70%(+0.064)#76 | 0.67%(+0.093)#3,150 |
| 77. | Port Hope | 0.74% | 0.70%(+0.039)#77 | 0.67%(+0.068)#3,233 |
| 78. | Portage | 0.73% | 0.70%(+0.036)#78 | 0.67%(+0.064)#3,242 |
| 79. | Traverse City | 0.73% | 0.70%(+0.035)#79 | 0.67%(+0.063)#3,246 |
| 80. | Grandville | 0.72% | 0.70%(+0.028)#80 | 0.67%(+0.057)#3,269 |
| 81. | Dearborn | 0.72% | 0.70%(+0.022)#81 | 0.67%(+0.051)#3,298 |
| 82. | Roscommon | 0.71% | 0.70%(+0.016)#82 | 0.67%(+0.045)#3,313 |
| 83. | Sault Ste Marie | 0.71% | 0.70%(+0.013)#83 | 0.67%(+0.041)#3,332 |
| 84. | Prudenville | 0.71% | 0.70%(+0.012)#84 | 0.67%(+0.041)#3,333 |
| 85. | Douglas | 0.70% | 0.70%(+0.008)#85 | 0.67%(+0.037)#3,350 |
| 86. | Grosse Pointe Woods | 0.70% | 0.70%(+0.008)#86 | 0.67%(+0.037)#3,352 |
| 87. | Bath | 0.70% | 0.70%(+0.006)#87 | 0.67%(+0.035)#3,360 |
| 88. | Plymouth | 0.69% | 0.70%(-0.008)#88 | 0.67%(+0.021)#3,410 |
| 89. | Garden City | 0.69% | 0.70%(-0.009)#89 | 0.67%(+0.020)#3,412 |
| 90. | Roseville | 0.69% | 0.70%(-0.009)#90 | 0.67%(+0.020)#3,417 |
| 91. | Hazel Park | 0.68% | 0.70%(-0.012)#91 | 0.67%(+0.017)#3,434 |
| 92. | St Ignace | 0.67% | 0.70%(-0.024)#92 | 0.67%(+0.005)#3,487 |
| 93. | Stockbridge | 0.64% | 0.70%(-0.061)#93 | 0.67%(-0.032)#3,638 |
| 94. | New Haven | 0.61% | 0.70%(-0.083)#94 | 0.67%(-0.054)#3,731 |
| 95. | Scottville | 0.60% | 0.70%(-0.101)#95 | 0.67%(-0.072)#3,803 |
| 96. | Houghton | 0.58% | 0.70%(-0.118)#96 | 0.67%(-0.089)#3,884 |
| 97. | Saline | 0.55% | 0.70%(-0.150)#97 | 0.67%(-0.121)#4,024 |
| 98. | Pigeon | 0.55% | 0.70%(-0.150)#98 | 0.67%(-0.122)#4,029 |
| 99. | Romeo | 0.54% | 0.70%(-0.159)#99 | 0.67%(-0.130)#4,065 |
| 100. | Grand Beach | 0.53% | 0.70%(-0.165)#100 | 0.67%(-0.137)#4,088 |
Common Questions
What are the Top 10 Cities with the Highest Percentage of Immigrants from Eastern Europe in Michigan?
Top 10 Cities with the Highest Percentage of Immigrants from Eastern Europe in Michigan are:
#1
6.18%
#2
6.00%
#3
5.92%
#4
4.70%
#5
3.89%
#6
3.55%
#7
3.12%
#8
2.95%
#9
2.93%
#10
2.80%
What city has the Highest Percentage of Immigrants from Eastern Europe in Michigan?
Buckley has the Highest Percentage of Immigrants from Eastern Europe in Michigan with 6.18%.
What is the Percentage of Immigrants from Eastern Europe in the State of Michigan?
Percentage of Immigrants from Eastern Europe in Michigan is 0.70%.
What is the Percentage of Immigrants from Eastern Europe in the United States?
Percentage of Immigrants from Eastern Europe in the United States is 0.67%.