Cities with the Highest Percentage of Immigrants from Eastern Europe in South Carolina
RELATED REPORTS & OPTIONS
Eastern Europe
South Carolina
Compare Cities
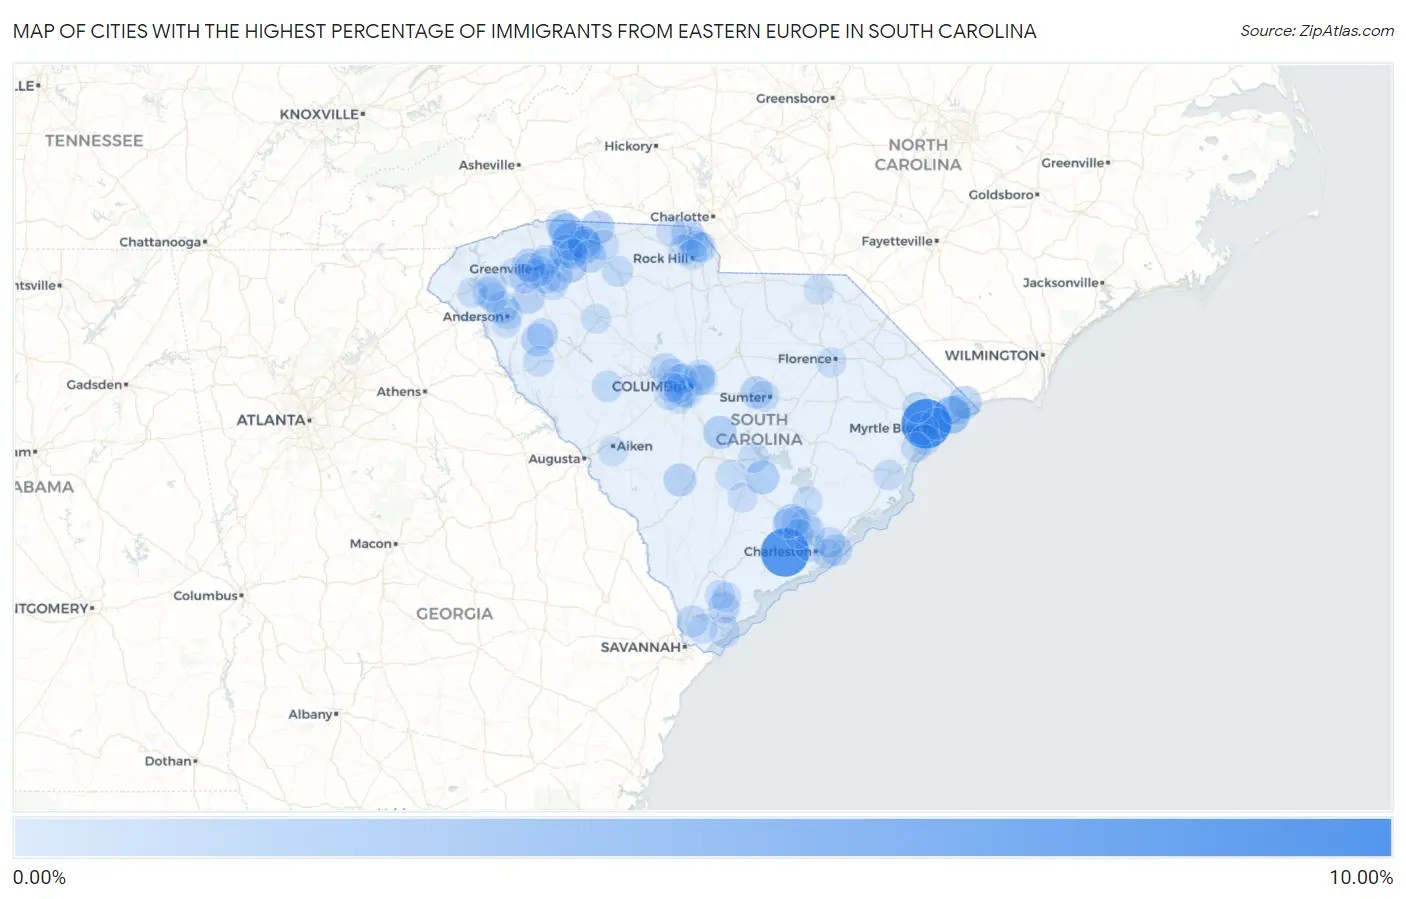
Map of Cities with the Highest Percentage of Immigrants from Eastern Europe in South Carolina
0.00%
10.00%
Cities with the Highest Percentage of Immigrants from Eastern Europe in South Carolina
| City | Eastern Europe | vs State | vs National | |
| 1. | Forestbrook | 8.56% | 0.31%(+8.26)#1 | 0.67%(+7.90)#96 |
| 2. | Ravenel | 8.05% | 0.31%(+7.74)#2 | 0.67%(+7.38)#108 |
| 3. | Inman | 3.25% | 0.31%(+2.94)#3 | 0.67%(+2.58)#537 |
| 4. | Briarcliffe Acres | 3.17% | 0.31%(+2.86)#4 | 0.67%(+2.50)#556 |
| 5. | Campobello | 2.42% | 0.31%(+2.12)#5 | 0.67%(+1.76)#845 |
| 6. | Valley Falls | 1.76% | 0.31%(+1.45)#6 | 0.67%(+1.09)#1,305 |
| 7. | Lincolnville | 1.72% | 0.31%(+1.41)#7 | 0.67%(+1.05)#1,345 |
| 8. | Chesnee | 1.68% | 0.31%(+1.37)#8 | 0.67%(+1.01)#1,391 |
| 9. | Carolina Forest | 1.64% | 0.31%(+1.33)#9 | 0.67%(+0.968)#1,441 |
| 10. | Lyman | 1.59% | 0.31%(+1.28)#10 | 0.67%(+0.923)#1,494 |
| 11. | Holly Hill | 1.59% | 0.31%(+1.28)#11 | 0.67%(+0.922)#1,495 |
| 12. | St Matthews | 1.50% | 0.31%(+1.19)#12 | 0.67%(+0.834)#1,600 |
| 13. | Reidville | 1.44% | 0.31%(+1.13)#13 | 0.67%(+0.775)#1,681 |
| 14. | Boiling Springs | 1.41% | 0.31%(+1.10)#14 | 0.67%(+0.745)#1,719 |
| 15. | Little River | 1.41% | 0.31%(+1.10)#15 | 0.67%(+0.739)#1,726 |
| 16. | Hilltop | 1.38% | 0.31%(+1.07)#16 | 0.67%(+0.716)#1,762 |
| 17. | Denmark | 1.30% | 0.31%(+0.989)#17 | 0.67%(+0.632)#1,871 |
| 18. | Berea | 1.26% | 0.31%(+0.951)#18 | 0.67%(+0.593)#1,935 |
| 19. | Socastee | 1.26% | 0.31%(+0.949)#19 | 0.67%(+0.592)#1,937 |
| 20. | Five Forks | 1.24% | 0.31%(+0.927)#20 | 0.67%(+0.570)#1,988 |
| 21. | Due West | 1.22% | 0.31%(+0.910)#21 | 0.67%(+0.552)#2,028 |
| 22. | Spartanburg | 1.22% | 0.31%(+0.907)#22 | 0.67%(+0.550)#2,034 |
| 23. | Lake Wylie | 1.13% | 0.31%(+0.824)#23 | 0.67%(+0.466)#2,169 |
| 24. | Cherryvale | 1.13% | 0.31%(+0.816)#24 | 0.67%(+0.458)#2,187 |
| 25. | Pelzer | 1.08% | 0.31%(+0.771)#25 | 0.67%(+0.414)#2,278 |
| 26. | Northlake | 0.98% | 0.31%(+0.668)#26 | 0.67%(+0.311)#2,515 |
| 27. | The Cliffs Valley | 0.95% | 0.31%(+0.640)#27 | 0.67%(+0.283)#2,586 |
| 28. | Myrtle Beach | 0.95% | 0.31%(+0.639)#28 | 0.67%(+0.281)#2,590 |
| 29. | Ben Avon | 0.88% | 0.31%(+0.569)#29 | 0.67%(+0.212)#2,773 |
| 30. | Isle Of Palms | 0.85% | 0.31%(+0.541)#30 | 0.67%(+0.184)#2,874 |
| 31. | Springdale | 0.81% | 0.31%(+0.502)#31 | 0.67%(+0.144)#2,974 |
| 32. | Shell Point | 0.79% | 0.31%(+0.480)#32 | 0.67%(+0.123)#3,055 |
| 33. | Clemson | 0.75% | 0.31%(+0.436)#33 | 0.67%(+0.079)#3,201 |
| 34. | Hardeeville | 0.72% | 0.31%(+0.411)#34 | 0.67%(+0.054)#3,283 |
| 35. | Lake Murray Of Richland | 0.68% | 0.31%(+0.370)#35 | 0.67%(+0.013)#3,450 |
| 36. | Forest Acres | 0.65% | 0.31%(+0.337)#36 | 0.67%(-0.020)#3,584 |
| 37. | Riverview | 0.60% | 0.31%(+0.287)#37 | 0.67%(-0.070)#3,797 |
| 38. | Saluda | 0.58% | 0.31%(+0.266)#38 | 0.67%(-0.091)#3,891 |
| 39. | Seven Oaks | 0.58% | 0.31%(+0.265)#39 | 0.67%(-0.092)#3,898 |
| 40. | Jonesville | 0.54% | 0.31%(+0.231)#40 | 0.67%(-0.127)#4,045 |
| 41. | Donalds | 0.53% | 0.31%(+0.225)#41 | 0.67%(-0.132)#4,075 |
| 42. | Cayce | 0.52% | 0.31%(+0.206)#42 | 0.67%(-0.151)#4,168 |
| 43. | Dentsville | 0.49% | 0.31%(+0.184)#43 | 0.67%(-0.173)#4,269 |
| 44. | Irmo | 0.48% | 0.31%(+0.169)#44 | 0.67%(-0.188)#4,347 |
| 45. | Tega Cay | 0.47% | 0.31%(+0.158)#45 | 0.67%(-0.199)#4,411 |
| 46. | Abbeville | 0.45% | 0.31%(+0.140)#46 | 0.67%(-0.217)#4,511 |
| 47. | Surfside Beach | 0.43% | 0.31%(+0.121)#47 | 0.67%(-0.236)#4,617 |
| 48. | Anderson | 0.42% | 0.31%(+0.109)#48 | 0.67%(-0.248)#4,689 |
| 49. | Sumter | 0.41% | 0.31%(+0.097)#49 | 0.67%(-0.261)#4,768 |
| 50. | Charleston | 0.40% | 0.31%(+0.094)#50 | 0.67%(-0.264)#4,784 |
| 51. | Newport | 0.40% | 0.31%(+0.092)#51 | 0.67%(-0.265)#4,791 |
| 52. | Landrum | 0.40% | 0.31%(+0.090)#52 | 0.67%(-0.268)#4,815 |
| 53. | Wade Hampton | 0.38% | 0.31%(+0.071)#53 | 0.67%(-0.287)#4,946 |
| 54. | Mount Pleasant | 0.36% | 0.31%(+0.050)#54 | 0.67%(-0.308)#5,075 |
| 55. | Georgetown | 0.35% | 0.31%(+0.045)#55 | 0.67%(-0.313)#5,117 |
| 56. | Simpsonville | 0.35% | 0.31%(+0.038)#56 | 0.67%(-0.319)#5,168 |
| 57. | Santee | 0.34% | 0.31%(+0.027)#57 | 0.67%(-0.331)#5,232 |
| 58. | Hilton Head Island | 0.33% | 0.31%(+0.024)#58 | 0.67%(-0.333)#5,244 |
| 59. | St Andrews | 0.33% | 0.31%(+0.019)#59 | 0.67%(-0.338)#5,286 |
| 60. | Cowpens | 0.32% | 0.31%(+0.012)#60 | 0.67%(-0.345)#5,324 |
| 61. | Goose Creek | 0.32% | 0.31%(+0.009)#61 | 0.67%(-0.349)#5,350 |
| 62. | Bowman | 0.31% | 0.31%(-0.003)#62 | 0.67%(-0.360)#5,432 |
| 63. | Summerville | 0.29% | 0.31%(-0.025)#63 | 0.67%(-0.382)#5,620 |
| 64. | Hanahan | 0.27% | 0.31%(-0.035)#64 | 0.67%(-0.392)#5,730 |
| 65. | Wellford | 0.27% | 0.31%(-0.040)#65 | 0.67%(-0.397)#5,782 |
| 66. | Conway | 0.26% | 0.31%(-0.051)#66 | 0.67%(-0.408)#5,888 |
| 67. | Murrells Inlet | 0.25% | 0.31%(-0.057)#67 | 0.67%(-0.415)#5,949 |
| 68. | Taylors | 0.25% | 0.31%(-0.062)#68 | 0.67%(-0.419)#5,997 |
| 69. | Fort Mill | 0.23% | 0.31%(-0.083)#69 | 0.67%(-0.440)#6,197 |
| 70. | Mauldin | 0.23% | 0.31%(-0.084)#70 | 0.67%(-0.442)#6,210 |
| 71. | South Congaree | 0.22% | 0.31%(-0.088)#71 | 0.67%(-0.445)#6,246 |
| 72. | Easley | 0.21% | 0.31%(-0.098)#72 | 0.67%(-0.455)#6,339 |
| 73. | Cheraw | 0.20% | 0.31%(-0.112)#73 | 0.67%(-0.469)#6,474 |
| 74. | Seneca | 0.19% | 0.31%(-0.117)#74 | 0.67%(-0.475)#6,538 |
| 75. | Beaufort | 0.19% | 0.31%(-0.118)#75 | 0.67%(-0.476)#6,552 |
| 76. | Whitney | 0.19% | 0.31%(-0.122)#76 | 0.67%(-0.480)#6,585 |
| 77. | Columbia | 0.18% | 0.31%(-0.126)#77 | 0.67%(-0.483)#6,613 |
| 78. | Clinton | 0.18% | 0.31%(-0.126)#78 | 0.67%(-0.483)#6,621 |
| 79. | Aiken | 0.18% | 0.31%(-0.129)#79 | 0.67%(-0.486)#6,650 |
| 80. | Moncks Corner | 0.18% | 0.31%(-0.131)#80 | 0.67%(-0.489)#6,678 |
| 81. | Clover | 0.18% | 0.31%(-0.133)#81 | 0.67%(-0.491)#6,701 |
| 82. | Homeland Park | 0.17% | 0.31%(-0.135)#82 | 0.67%(-0.493)#6,711 |
| 83. | Sullivan S Island | 0.17% | 0.31%(-0.137)#83 | 0.67%(-0.494)#6,722 |
| 84. | Pendleton | 0.17% | 0.31%(-0.138)#84 | 0.67%(-0.496)#6,732 |
| 85. | Ladson | 0.17% | 0.31%(-0.140)#85 | 0.67%(-0.497)#6,745 |
| 86. | Bluffton | 0.16% | 0.31%(-0.153)#86 | 0.67%(-0.511)#6,879 |
| 87. | North Charleston | 0.16% | 0.31%(-0.154)#87 | 0.67%(-0.512)#6,895 |
| 88. | Dunean | 0.15% | 0.31%(-0.164)#88 | 0.67%(-0.521)#6,997 |
| 89. | North Myrtle Beach | 0.14% | 0.31%(-0.167)#89 | 0.67%(-0.524)#7,023 |
| 90. | Oak Grove | 0.13% | 0.31%(-0.178)#90 | 0.67%(-0.535)#7,130 |
| 91. | Greenville | 0.13% | 0.31%(-0.178)#91 | 0.67%(-0.536)#7,134 |
| 92. | Powdersville | 0.13% | 0.31%(-0.179)#92 | 0.67%(-0.536)#7,137 |
| 93. | Laurel Bay | 0.13% | 0.31%(-0.183)#93 | 0.67%(-0.540)#7,171 |
| 94. | Red Bank | 0.12% | 0.31%(-0.186)#94 | 0.67%(-0.544)#7,204 |
| 95. | Central | 0.11% | 0.31%(-0.196)#95 | 0.67%(-0.553)#7,282 |
| 96. | Lexington | 0.11% | 0.31%(-0.204)#96 | 0.67%(-0.561)#7,345 |
| 97. | St George | 0.11% | 0.31%(-0.205)#97 | 0.67%(-0.562)#7,351 |
| 98. | Florence | 0.10% | 0.31%(-0.210)#98 | 0.67%(-0.567)#7,399 |
| 99. | Rock Hill | 0.090% | 0.31%(-0.219)#99 | 0.67%(-0.577)#7,492 |
| 100. | Parker | 0.088% | 0.31%(-0.222)#100 | 0.67%(-0.579)#7,507 |
Common Questions
What are the Top 10 Cities with the Highest Percentage of Immigrants from Eastern Europe in South Carolina?
Top 10 Cities with the Highest Percentage of Immigrants from Eastern Europe in South Carolina are:
#1
8.56%
#2
8.05%
#3
3.25%
#4
3.17%
#5
2.42%
#6
1.76%
#7
1.72%
#8
1.68%
#9
1.59%
#10
1.59%
What city has the Highest Percentage of Immigrants from Eastern Europe in South Carolina?
Forestbrook has the Highest Percentage of Immigrants from Eastern Europe in South Carolina with 8.56%.
What is the Percentage of Immigrants from Eastern Europe in the State of South Carolina?
Percentage of Immigrants from Eastern Europe in South Carolina is 0.31%.
What is the Percentage of Immigrants from Eastern Europe in the United States?
Percentage of Immigrants from Eastern Europe in the United States is 0.67%.