Cities with the Highest Percentage of Immigrants from Eastern Europe in Virginia
RELATED REPORTS & OPTIONS
Eastern Europe
Virginia
Compare Cities
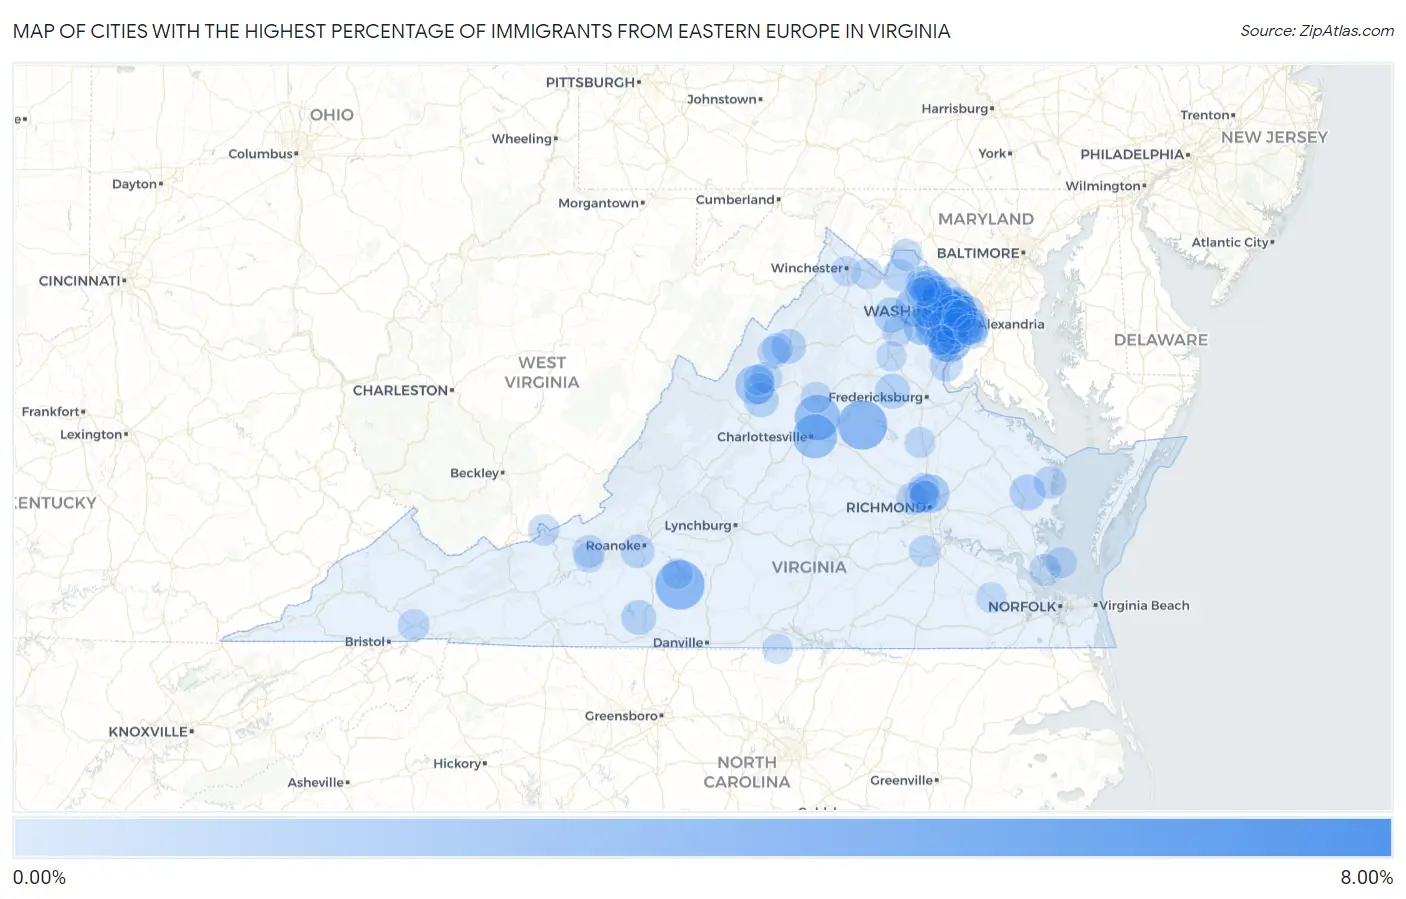
Map of Cities with the Highest Percentage of Immigrants from Eastern Europe in Virginia
0.00%
8.00%
Cities with the Highest Percentage of Immigrants from Eastern Europe in Virginia
| City | Eastern Europe | vs State | vs National | |
| 1. | Sully Square | 7.97% | 0.42%(+7.55)#1 | 0.67%(+7.30)#110 |
| 2. | Blue Ridge Shores | 3.90% | 0.42%(+3.48)#2 | 0.67%(+3.24)#407 |
| 3. | Penhook | 3.88% | 0.42%(+3.47)#3 | 0.67%(+3.22)#412 |
| 4. | Woodburn | 3.83% | 0.42%(+3.41)#4 | 0.67%(+3.16)#419 |
| 5. | Piney Mountain | 3.23% | 0.42%(+2.81)#5 | 0.67%(+2.56)#540 |
| 6. | Pantops | 3.01% | 0.42%(+2.59)#6 | 0.67%(+2.34)#597 |
| 7. | Fair Lakes | 2.92% | 0.42%(+2.50)#7 | 0.67%(+2.25)#628 |
| 8. | Merrifield | 2.89% | 0.42%(+2.47)#8 | 0.67%(+2.22)#638 |
| 9. | Occoquan | 2.61% | 0.42%(+2.19)#9 | 0.67%(+1.94)#749 |
| 10. | Stone Ridge | 2.47% | 0.42%(+2.05)#10 | 0.67%(+1.81)#816 |
| 11. | Clifton | 2.23% | 0.42%(+1.82)#11 | 0.67%(+1.57)#947 |
| 12. | Bridgewater | 2.19% | 0.42%(+1.77)#12 | 0.67%(+1.52)#969 |
| 13. | Pimmit Hills | 2.14% | 0.42%(+1.72)#13 | 0.67%(+1.47)#1,002 |
| 14. | Chamberlayne | 2.09% | 0.42%(+1.68)#14 | 0.67%(+1.43)#1,030 |
| 15. | Idylwood | 2.07% | 0.42%(+1.65)#15 | 0.67%(+1.40)#1,055 |
| 16. | Crosspointe | 1.96% | 0.42%(+1.54)#16 | 0.67%(+1.29)#1,126 |
| 17. | Sudley | 1.94% | 0.42%(+1.52)#17 | 0.67%(+1.28)#1,137 |
| 18. | Braddock | 1.86% | 0.42%(+1.44)#18 | 0.67%(+1.19)#1,211 |
| 19. | Huntington | 1.78% | 0.42%(+1.36)#19 | 0.67%(+1.12)#1,289 |
| 20. | The University Of Virginia's College At Wise | 1.69% | 0.42%(+1.27)#20 | 0.67%(+1.03)#1,374 |
| 21. | Reston | 1.63% | 0.42%(+1.21)#21 | 0.67%(+0.964)#1,446 |
| 22. | Urbanna | 1.60% | 0.42%(+1.18)#22 | 0.67%(+0.935)#1,473 |
| 23. | Lansdowne | 1.56% | 0.42%(+1.14)#23 | 0.67%(+0.891)#1,525 |
| 24. | Mclean | 1.52% | 0.42%(+1.10)#24 | 0.67%(+0.851)#1,579 |
| 25. | Lake Of The Woods | 1.47% | 0.42%(+1.05)#25 | 0.67%(+0.805)#1,640 |
| 26. | The Plains | 1.47% | 0.42%(+1.05)#26 | 0.67%(+0.798)#1,649 |
| 27. | Falls Church | 1.42% | 0.42%(+1.00)#27 | 0.67%(+0.753)#1,704 |
| 28. | Bassett | 1.41% | 0.42%(+0.989)#28 | 0.67%(+0.741)#1,725 |
| 29. | Weyers Cave | 1.40% | 0.42%(+0.982)#29 | 0.67%(+0.734)#1,732 |
| 30. | New Market | 1.39% | 0.42%(+0.968)#30 | 0.67%(+0.720)#1,757 |
| 31. | Kingstowne | 1.37% | 0.42%(+0.952)#31 | 0.67%(+0.704)#1,776 |
| 32. | Tysons | 1.37% | 0.42%(+0.949)#32 | 0.67%(+0.702)#1,778 |
| 33. | Herndon | 1.30% | 0.42%(+0.885)#33 | 0.67%(+0.637)#1,861 |
| 34. | Dulles Town Center | 1.29% | 0.42%(+0.872)#34 | 0.67%(+0.625)#1,881 |
| 35. | Arlington | 1.26% | 0.42%(+0.840)#35 | 0.67%(+0.592)#1,938 |
| 36. | Cave Spring | 1.24% | 0.42%(+0.822)#36 | 0.67%(+0.575)#1,980 |
| 37. | Oakton | 1.24% | 0.42%(+0.818)#37 | 0.67%(+0.570)#1,986 |
| 38. | Great Falls | 1.24% | 0.42%(+0.817)#38 | 0.67%(+0.569)#1,989 |
| 39. | Dumbarton | 1.23% | 0.42%(+0.814)#39 | 0.67%(+0.566)#1,995 |
| 40. | Difficult Run | 1.20% | 0.42%(+0.779)#40 | 0.67%(+0.531)#2,061 |
| 41. | Fair Oaks | 1.18% | 0.42%(+0.756)#41 | 0.67%(+0.509)#2,094 |
| 42. | West Springfield | 1.15% | 0.42%(+0.727)#42 | 0.67%(+0.480)#2,145 |
| 43. | Floris | 1.13% | 0.42%(+0.713)#43 | 0.67%(+0.465)#2,171 |
| 44. | Quantico | 1.10% | 0.42%(+0.686)#44 | 0.67%(+0.438)#2,234 |
| 45. | Wolf Trap | 1.10% | 0.42%(+0.682)#45 | 0.67%(+0.434)#2,245 |
| 46. | Kilmarnock | 1.09% | 0.42%(+0.671)#46 | 0.67%(+0.423)#2,262 |
| 47. | University Center | 1.09% | 0.42%(+0.670)#47 | 0.67%(+0.422)#2,265 |
| 48. | Long Branch | 1.07% | 0.42%(+0.655)#48 | 0.67%(+0.407)#2,301 |
| 49. | Broadway | 1.01% | 0.42%(+0.588)#49 | 0.67%(+0.340)#2,449 |
| 50. | Tuckahoe | 1.01% | 0.42%(+0.588)#50 | 0.67%(+0.340)#2,450 |
| 51. | Lake Ridge | 1.00% | 0.42%(+0.580)#51 | 0.67%(+0.332)#2,465 |
| 52. | Blacksburg | 0.99% | 0.42%(+0.575)#52 | 0.67%(+0.327)#2,476 |
| 53. | Purcellville | 0.97% | 0.42%(+0.555)#53 | 0.67%(+0.307)#2,524 |
| 54. | Bethel Manor | 0.97% | 0.42%(+0.553)#54 | 0.67%(+0.305)#2,529 |
| 55. | Vienna | 0.96% | 0.42%(+0.544)#55 | 0.67%(+0.296)#2,549 |
| 56. | Alexandria | 0.95% | 0.42%(+0.532)#56 | 0.67%(+0.284)#2,582 |
| 57. | Newington Forest | 0.94% | 0.42%(+0.522)#57 | 0.67%(+0.274)#2,605 |
| 58. | Seven Corners | 0.94% | 0.42%(+0.521)#58 | 0.67%(+0.274)#2,606 |
| 59. | Lovettsville | 0.94% | 0.42%(+0.518)#59 | 0.67%(+0.271)#2,616 |
| 60. | Matoaca | 0.93% | 0.42%(+0.507)#60 | 0.67%(+0.260)#2,650 |
| 61. | Abingdon | 0.91% | 0.42%(+0.491)#61 | 0.67%(+0.244)#2,700 |
| 62. | Fairfax Station | 0.90% | 0.42%(+0.485)#62 | 0.67%(+0.237)#2,718 |
| 63. | Kings Park West | 0.90% | 0.42%(+0.479)#63 | 0.67%(+0.231)#2,731 |
| 64. | Potomac Mills | 0.88% | 0.42%(+0.456)#64 | 0.67%(+0.208)#2,789 |
| 65. | Springfield | 0.87% | 0.42%(+0.451)#65 | 0.67%(+0.203)#2,810 |
| 66. | Glen Allen | 0.87% | 0.42%(+0.449)#66 | 0.67%(+0.201)#2,816 |
| 67. | Harrisonburg | 0.86% | 0.42%(+0.440)#67 | 0.67%(+0.192)#2,849 |
| 68. | Goose Creek | 0.86% | 0.42%(+0.438)#68 | 0.67%(+0.191)#2,857 |
| 69. | Rich Creek | 0.85% | 0.42%(+0.429)#69 | 0.67%(+0.182)#2,883 |
| 70. | Timberville | 0.84% | 0.42%(+0.424)#70 | 0.67%(+0.176)#2,895 |
| 71. | Poquoson | 0.84% | 0.42%(+0.422)#71 | 0.67%(+0.174)#2,897 |
| 72. | Stanardsville | 0.81% | 0.42%(+0.394)#72 | 0.67%(+0.146)#2,969 |
| 73. | North Shore | 0.81% | 0.42%(+0.389)#73 | 0.67%(+0.141)#2,984 |
| 74. | Navy | 0.80% | 0.42%(+0.378)#74 | 0.67%(+0.130)#3,027 |
| 75. | Sugarland Run | 0.80% | 0.42%(+0.376)#75 | 0.67%(+0.129)#3,036 |
| 76. | Mount Crawford | 0.79% | 0.42%(+0.367)#76 | 0.67%(+0.119)#3,068 |
| 77. | Lakeside | 0.78% | 0.42%(+0.364)#77 | 0.67%(+0.116)#3,079 |
| 78. | Dayton | 0.78% | 0.42%(+0.364)#78 | 0.67%(+0.116)#3,081 |
| 79. | Lake Caroline | 0.75% | 0.42%(+0.335)#79 | 0.67%(+0.087)#3,175 |
| 80. | Belle Haven | 0.74% | 0.42%(+0.320)#80 | 0.67%(+0.072)#3,217 |
| 81. | Laurel Hill | 0.74% | 0.42%(+0.317)#81 | 0.67%(+0.069)#3,231 |
| 82. | New Baltimore | 0.73% | 0.42%(+0.313)#82 | 0.67%(+0.065)#3,237 |
| 83. | Lake Barcroft | 0.73% | 0.42%(+0.308)#83 | 0.67%(+0.060)#3,259 |
| 84. | Ivor | 0.72% | 0.42%(+0.305)#84 | 0.67%(+0.058)#3,267 |
| 85. | Dranesville | 0.72% | 0.42%(+0.305)#85 | 0.67%(+0.057)#3,270 |
| 86. | Berryville | 0.70% | 0.42%(+0.277)#86 | 0.67%(+0.029)#3,389 |
| 87. | County Center | 0.70% | 0.42%(+0.276)#87 | 0.67%(+0.029)#3,390 |
| 88. | Bealeton | 0.69% | 0.42%(+0.266)#88 | 0.67%(+0.018)#3,426 |
| 89. | Dunn Loring | 0.68% | 0.42%(+0.258)#89 | 0.67%(+0.011)#3,459 |
| 90. | Chantilly | 0.67% | 0.42%(+0.251)#90 | 0.67%(+0.004)#3,491 |
| 91. | North Springfield | 0.67% | 0.42%(+0.246)#91 | 0.67%(-0.002)#3,511 |
| 92. | Belmont | 0.66% | 0.42%(+0.238)#92 | 0.67%(-0.010)#3,543 |
| 93. | Broadlands | 0.65% | 0.42%(+0.232)#93 | 0.67%(-0.016)#3,566 |
| 94. | Ashburn | 0.65% | 0.42%(+0.232)#94 | 0.67%(-0.016)#3,570 |
| 95. | Virgilina | 0.64% | 0.42%(+0.218)#95 | 0.67%(-0.030)#3,631 |
| 96. | Merrimac | 0.63% | 0.42%(+0.206)#96 | 0.67%(-0.042)#3,673 |
| 97. | West Falls Church | 0.62% | 0.42%(+0.201)#97 | 0.67%(-0.047)#3,692 |
| 98. | Fort Hunt | 0.62% | 0.42%(+0.199)#98 | 0.67%(-0.049)#3,702 |
| 99. | Groveton | 0.62% | 0.42%(+0.196)#99 | 0.67%(-0.051)#3,713 |
| 100. | Winchester | 0.62% | 0.42%(+0.196)#100 | 0.67%(-0.052)#3,714 |
Common Questions
What are the Top 10 Cities with the Highest Percentage of Immigrants from Eastern Europe in Virginia?
Top 10 Cities with the Highest Percentage of Immigrants from Eastern Europe in Virginia are:
#1
3.90%
#2
3.88%
#3
3.83%
#4
3.23%
#5
3.01%
#6
2.92%
#7
2.89%
#8
2.61%
#9
2.47%
#10
2.23%
What city has the Highest Percentage of Immigrants from Eastern Europe in Virginia?
Blue Ridge Shores has the Highest Percentage of Immigrants from Eastern Europe in Virginia with 3.90%.
What is the Percentage of Immigrants from Eastern Europe in the State of Virginia?
Percentage of Immigrants from Eastern Europe in Virginia is 0.42%.
What is the Percentage of Immigrants from Eastern Europe in the United States?
Percentage of Immigrants from Eastern Europe in the United States is 0.67%.