Cities with the Highest Percentage of Immigrants from Eastern Europe in Texas
RELATED REPORTS & OPTIONS
Eastern Europe
Texas
Compare Cities
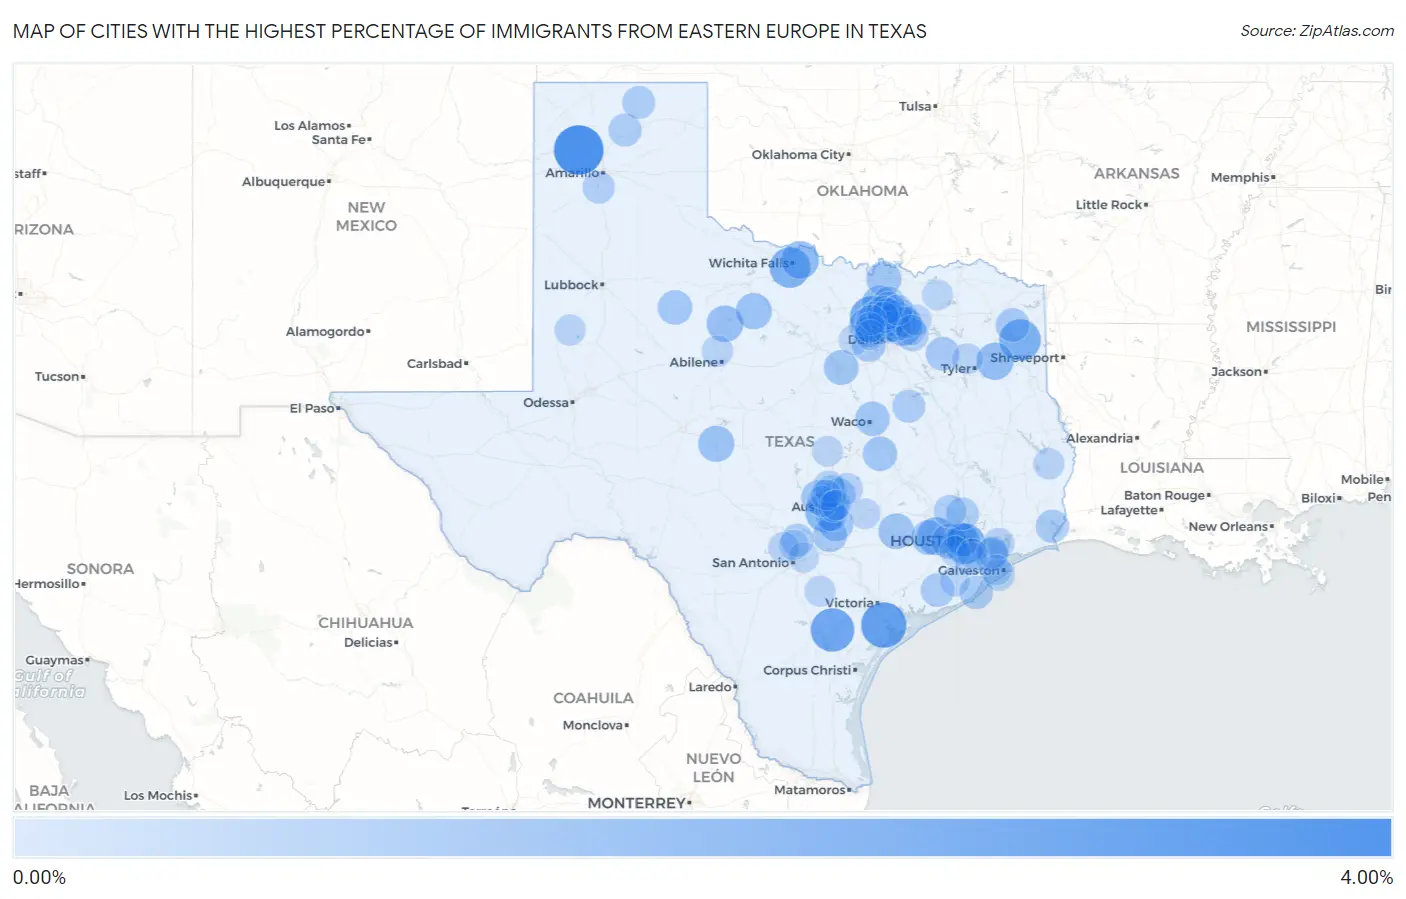
Map of Cities with the Highest Percentage of Immigrants from Eastern Europe in Texas
0.00%
4.00%
Cities with the Highest Percentage of Immigrants from Eastern Europe in Texas
| City | Eastern Europe | vs State | vs National | |
| 1. | Boys Ranch | 3.97% | 0.22%(+3.75)#1 | 0.67%(+3.30)#395 |
| 2. | Tivoli | 3.18% | 0.22%(+2.96)#2 | 0.67%(+2.52)#549 |
| 3. | Blue Berry Hill | 2.84% | 0.22%(+2.61)#3 | 0.67%(+2.17)#661 |
| 4. | Lantana | 2.67% | 0.22%(+2.45)#4 | 0.67%(+2.01)#714 |
| 5. | Pine Harbor | 2.48% | 0.22%(+2.26)#5 | 0.67%(+1.81)#815 |
| 6. | Bellaire | 2.32% | 0.22%(+2.10)#6 | 0.67%(+1.66)#897 |
| 7. | Lakeside City | 2.29% | 0.22%(+2.07)#7 | 0.67%(+1.62)#916 |
| 8. | Bear Creek | 2.06% | 0.22%(+1.84)#8 | 0.67%(+1.39)#1,060 |
| 9. | Sachse | 1.98% | 0.22%(+1.76)#9 | 0.67%(+1.32)#1,107 |
| 10. | Pattison | 1.83% | 0.22%(+1.61)#10 | 0.67%(+1.17)#1,231 |
| 11. | Dean | 1.77% | 0.22%(+1.54)#11 | 0.67%(+1.10)#1,300 |
| 12. | Liberty City | 1.67% | 0.22%(+1.45)#12 | 0.67%(+1.00)#1,393 |
| 13. | Stamford | 1.56% | 0.22%(+1.34)#13 | 0.67%(+0.896)#1,520 |
| 14. | Aubrey | 1.53% | 0.22%(+1.31)#14 | 0.67%(+0.867)#1,558 |
| 15. | Eden | 1.48% | 0.22%(+1.26)#15 | 0.67%(+0.815)#1,632 |
| 16. | Throckmorton | 1.48% | 0.22%(+1.26)#16 | 0.67%(+0.814)#1,634 |
| 17. | Fayetteville | 1.39% | 0.22%(+1.17)#17 | 0.67%(+0.722)#1,755 |
| 18. | Santa Rita Ranch | 1.37% | 0.22%(+1.15)#18 | 0.67%(+0.701)#1,779 |
| 19. | Whitesboro | 1.28% | 0.22%(+1.06)#19 | 0.67%(+0.616)#1,899 |
| 20. | San Felipe | 1.25% | 0.22%(+1.03)#20 | 0.67%(+0.584)#1,952 |
| 21. | Pecan Plantation | 1.25% | 0.22%(+1.02)#21 | 0.67%(+0.578)#1,970 |
| 22. | Briarcliff | 1.23% | 0.22%(+1.01)#22 | 0.67%(+0.565)#1,997 |
| 23. | Cinco Ranch | 1.23% | 0.22%(+1.01)#23 | 0.67%(+0.563)#2,001 |
| 24. | Niederwald | 1.21% | 0.22%(+0.985)#24 | 0.67%(+0.540)#2,048 |
| 25. | Jayton | 1.19% | 0.22%(+0.965)#25 | 0.67%(+0.521)#2,076 |
| 26. | Bellmead | 1.17% | 0.22%(+0.951)#26 | 0.67%(+0.507)#2,097 |
| 27. | Rosebud | 1.17% | 0.22%(+0.951)#27 | 0.67%(+0.506)#2,099 |
| 28. | Martindale | 1.14% | 0.22%(+0.922)#28 | 0.67%(+0.477)#2,152 |
| 29. | Westlake | 1.08% | 0.22%(+0.855)#29 | 0.67%(+0.410)#2,288 |
| 30. | Canton | 1.05% | 0.22%(+0.829)#30 | 0.67%(+0.385)#2,349 |
| 31. | Hughes Springs | 1.05% | 0.22%(+0.826)#31 | 0.67%(+0.382)#2,353 |
| 32. | Dalworthington Gardens | 1.03% | 0.22%(+0.803)#32 | 0.67%(+0.359)#2,408 |
| 33. | Wells Branch | 1.03% | 0.22%(+0.803)#33 | 0.67%(+0.359)#2,409 |
| 34. | Hackberry | 1.01% | 0.22%(+0.791)#34 | 0.67%(+0.346)#2,433 |
| 35. | Bay City | 1.01% | 0.22%(+0.791)#35 | 0.67%(+0.346)#2,436 |
| 36. | Bunker Hill Village | 0.99% | 0.22%(+0.772)#36 | 0.67%(+0.328)#2,474 |
| 37. | Port Neches | 0.99% | 0.22%(+0.768)#37 | 0.67%(+0.323)#2,483 |
| 38. | Kemah | 0.98% | 0.22%(+0.754)#38 | 0.67%(+0.310)#2,517 |
| 39. | Surfside Beach | 0.97% | 0.22%(+0.750)#39 | 0.67%(+0.305)#2,528 |
| 40. | Hunters Creek Village | 0.96% | 0.22%(+0.736)#40 | 0.67%(+0.291)#2,568 |
| 41. | Steiner Ranch | 0.95% | 0.22%(+0.728)#41 | 0.67%(+0.284)#2,584 |
| 42. | Wortham | 0.92% | 0.22%(+0.700)#42 | 0.67%(+0.255)#2,666 |
| 43. | Stinnett | 0.91% | 0.22%(+0.687)#43 | 0.67%(+0.242)#2,706 |
| 44. | Manvel | 0.91% | 0.22%(+0.683)#44 | 0.67%(+0.238)#2,715 |
| 45. | Spearman | 0.90% | 0.22%(+0.681)#45 | 0.67%(+0.236)#2,720 |
| 46. | Fairview | 0.88% | 0.22%(+0.657)#46 | 0.67%(+0.212)#2,774 |
| 47. | Bulverde | 0.88% | 0.22%(+0.653)#47 | 0.67%(+0.208)#2,790 |
| 48. | The Woodlands | 0.87% | 0.22%(+0.643)#48 | 0.67%(+0.199)#2,827 |
| 49. | Magnolia | 0.84% | 0.22%(+0.617)#49 | 0.67%(+0.173)#2,902 |
| 50. | San Leanna | 0.81% | 0.22%(+0.591)#50 | 0.67%(+0.146)#2,968 |
| 51. | Mclendon Chisholm | 0.80% | 0.22%(+0.577)#51 | 0.67%(+0.132)#3,021 |
| 52. | Murphy | 0.79% | 0.22%(+0.563)#52 | 0.67%(+0.118)#3,069 |
| 53. | Coppell | 0.77% | 0.22%(+0.547)#53 | 0.67%(+0.102)#3,121 |
| 54. | Canyon | 0.77% | 0.22%(+0.546)#54 | 0.67%(+0.102)#3,123 |
| 55. | Celina | 0.76% | 0.22%(+0.536)#55 | 0.67%(+0.091)#3,156 |
| 56. | Colleyville | 0.74% | 0.22%(+0.520)#56 | 0.67%(+0.075)#3,208 |
| 57. | Cedar Park | 0.74% | 0.22%(+0.515)#57 | 0.67%(+0.070)#3,222 |
| 58. | Allen | 0.72% | 0.22%(+0.501)#58 | 0.67%(+0.056)#3,273 |
| 59. | Galveston | 0.72% | 0.22%(+0.497)#59 | 0.67%(+0.052)#3,289 |
| 60. | Plano | 0.71% | 0.22%(+0.489)#60 | 0.67%(+0.045)#3,319 |
| 61. | Highland Village | 0.71% | 0.22%(+0.489)#61 | 0.67%(+0.044)#3,321 |
| 62. | Addison | 0.69% | 0.22%(+0.465)#62 | 0.67%(+0.020)#3,414 |
| 63. | Leander | 0.66% | 0.22%(+0.437)#63 | 0.67%(-0.008)#3,535 |
| 64. | Seabrook | 0.66% | 0.22%(+0.434)#64 | 0.67%(-0.011)#3,548 |
| 65. | Beach City | 0.64% | 0.22%(+0.417)#65 | 0.67%(-0.027)#3,616 |
| 66. | Prosper | 0.63% | 0.22%(+0.412)#66 | 0.67%(-0.032)#3,641 |
| 67. | Richardson | 0.63% | 0.22%(+0.404)#67 | 0.67%(-0.040)#3,670 |
| 68. | Wylie | 0.63% | 0.22%(+0.403)#68 | 0.67%(-0.041)#3,672 |
| 69. | Hawley | 0.62% | 0.22%(+0.400)#69 | 0.67%(-0.045)#3,687 |
| 70. | Jasper | 0.62% | 0.22%(+0.395)#70 | 0.67%(-0.050)#3,703 |
| 71. | Little Elm | 0.61% | 0.22%(+0.383)#71 | 0.67%(-0.062)#3,762 |
| 72. | The Hills | 0.60% | 0.22%(+0.376)#72 | 0.67%(-0.068)#3,789 |
| 73. | Rollingwood | 0.59% | 0.22%(+0.372)#73 | 0.67%(-0.073)#3,806 |
| 74. | Hutto | 0.59% | 0.22%(+0.371)#74 | 0.67%(-0.074)#3,811 |
| 75. | Frisco | 0.58% | 0.22%(+0.362)#75 | 0.67%(-0.083)#3,853 |
| 76. | The Colony | 0.58% | 0.22%(+0.360)#76 | 0.67%(-0.085)#3,862 |
| 77. | Loop | 0.58% | 0.22%(+0.359)#77 | 0.67%(-0.086)#3,865 |
| 78. | Cross Mountain | 0.57% | 0.22%(+0.352)#78 | 0.67%(-0.092)#3,901 |
| 79. | Falls City | 0.56% | 0.22%(+0.333)#79 | 0.67%(-0.112)#3,976 |
| 80. | Copperas Cove | 0.55% | 0.22%(+0.324)#80 | 0.67%(-0.121)#4,023 |
| 81. | Josephine | 0.54% | 0.22%(+0.321)#81 | 0.67%(-0.124)#4,039 |
| 82. | Ladonia | 0.54% | 0.22%(+0.314)#82 | 0.67%(-0.131)#4,066 |
| 83. | Lindale | 0.53% | 0.22%(+0.312)#83 | 0.67%(-0.133)#4,076 |
| 84. | Sienna | 0.52% | 0.22%(+0.300)#84 | 0.67%(-0.144)#4,126 |
| 85. | Mckinney | 0.52% | 0.22%(+0.299)#85 | 0.67%(-0.146)#4,136 |
| 86. | Circle D Kc Estates | 0.52% | 0.22%(+0.298)#86 | 0.67%(-0.147)#4,143 |
| 87. | Volente | 0.51% | 0.22%(+0.291)#87 | 0.67%(-0.154)#4,186 |
| 88. | Austin | 0.50% | 0.22%(+0.280)#88 | 0.67%(-0.165)#4,234 |
| 89. | Tiki Island | 0.50% | 0.22%(+0.279)#89 | 0.67%(-0.165)#4,238 |
| 90. | Sugar Land | 0.48% | 0.22%(+0.259)#90 | 0.67%(-0.186)#4,333 |
| 91. | Converse | 0.48% | 0.22%(+0.259)#91 | 0.67%(-0.186)#4,335 |
| 92. | Belterra | 0.46% | 0.22%(+0.242)#92 | 0.67%(-0.203)#4,427 |
| 93. | Westworth Village | 0.46% | 0.22%(+0.240)#93 | 0.67%(-0.205)#4,438 |
| 94. | Timberwood Park | 0.46% | 0.22%(+0.239)#94 | 0.67%(-0.206)#4,444 |
| 95. | Double Oak | 0.46% | 0.22%(+0.238)#95 | 0.67%(-0.206)#4,448 |
| 96. | West Columbia | 0.44% | 0.22%(+0.217)#96 | 0.67%(-0.228)#4,565 |
| 97. | Bedford | 0.43% | 0.22%(+0.208)#97 | 0.67%(-0.236)#4,618 |
| 98. | Southlake | 0.43% | 0.22%(+0.206)#98 | 0.67%(-0.238)#4,631 |
| 99. | Rockwall | 0.43% | 0.22%(+0.206)#99 | 0.67%(-0.239)#4,632 |
| 100. | Pearland | 0.42% | 0.22%(+0.200)#100 | 0.67%(-0.245)#4,664 |
Common Questions
What are the Top 10 Cities with the Highest Percentage of Immigrants from Eastern Europe in Texas?
Top 10 Cities with the Highest Percentage of Immigrants from Eastern Europe in Texas are:
#1
3.97%
#2
3.18%
#3
2.84%
#4
2.67%
#5
2.48%
#6
2.32%
#7
2.29%
#8
2.06%
#9
1.98%
#10
1.83%
What city has the Highest Percentage of Immigrants from Eastern Europe in Texas?
Boys Ranch has the Highest Percentage of Immigrants from Eastern Europe in Texas with 3.97%.
What is the Percentage of Immigrants from Eastern Europe in the State of Texas?
Percentage of Immigrants from Eastern Europe in Texas is 0.22%.
What is the Percentage of Immigrants from Eastern Europe in the United States?
Percentage of Immigrants from Eastern Europe in the United States is 0.67%.