Cities with the Highest Percentage of Immigrants from Eastern Europe in Connecticut
RELATED REPORTS & OPTIONS
Eastern Europe
Connecticut
Compare Cities
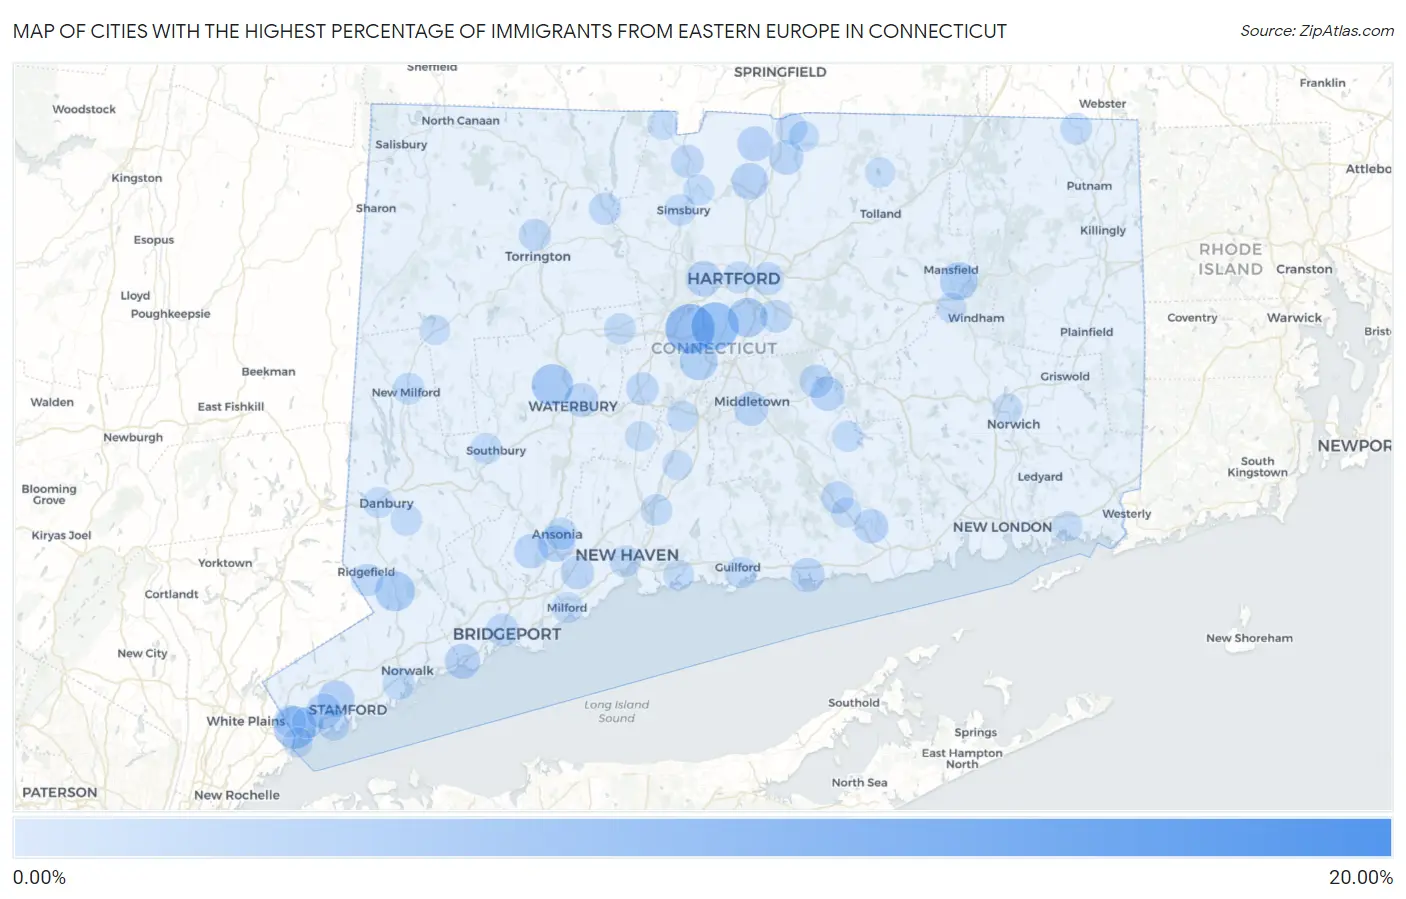
Map of Cities with the Highest Percentage of Immigrants from Eastern Europe in Connecticut
0.00%
20.00%
Cities with the Highest Percentage of Immigrants from Eastern Europe in Connecticut
| City | Eastern Europe | vs State | vs National | |
| 1. | Candlewood Isle | 18.42% | 1.53%(+16.9)#1 | 0.67%(+17.7)#20 |
| 2. | Topstone | 15.73% | 1.53%(+14.2)#2 | 0.67%(+15.1)#28 |
| 3. | Knollcrest | 11.92% | 1.53%(+10.4)#3 | 0.67%(+11.3)#56 |
| 4. | New Britain | 7.27% | 1.53%(+5.73)#4 | 0.67%(+6.60)#126 |
| 5. | South Wilton | 6.86% | 1.53%(+5.33)#5 | 0.67%(+6.20)#141 |
| 6. | Newington | 6.67% | 1.53%(+5.13)#6 | 0.67%(+6.00)#152 |
| 7. | Indian Field | 5.54% | 1.53%(+4.01)#7 | 0.67%(+4.88)#218 |
| 8. | Pemberwick | 4.95% | 1.53%(+3.42)#8 | 0.67%(+4.28)#273 |
| 9. | Oakville | 4.57% | 1.53%(+3.04)#9 | 0.67%(+3.90)#313 |
| 10. | Weston | 4.52% | 1.53%(+2.98)#10 | 0.67%(+3.85)#320 |
| 11. | Lakes West | 4.12% | 1.53%(+2.59)#11 | 0.67%(+3.46)#374 |
| 12. | Georgetown | 3.99% | 1.53%(+2.45)#12 | 0.67%(+3.32)#393 |
| 13. | Wethersfield | 3.84% | 1.53%(+2.31)#13 | 0.67%(+3.17)#417 |
| 14. | Mansfield Center | 3.28% | 1.53%(+1.75)#14 | 0.67%(+2.61)#529 |
| 15. | Kensington | 3.28% | 1.53%(+1.74)#15 | 0.67%(+2.61)#533 |
| 16. | Route 7 Gateway | 3.17% | 1.53%(+1.64)#16 | 0.67%(+2.50)#554 |
| 17. | Staples | 3.17% | 1.53%(+1.63)#17 | 0.67%(+2.50)#557 |
| 18. | Botsford | 2.98% | 1.53%(+1.44)#18 | 0.67%(+2.31)#606 |
| 19. | Stepney | 2.89% | 1.53%(+1.35)#19 | 0.67%(+2.22)#639 |
| 20. | Windsor Locks | 2.85% | 1.53%(+1.32)#20 | 0.67%(+2.18)#653 |
| 21. | Stamford | 2.84% | 1.53%(+1.30)#21 | 0.67%(+2.17)#662 |
| 22. | Daniels Farm | 2.79% | 1.53%(+1.25)#22 | 0.67%(+2.12)#677 |
| 23. | Derby | 2.68% | 1.53%(+1.15)#23 | 0.67%(+2.02)#710 |
| 24. | Rock Ridge | 2.63% | 1.53%(+1.10)#24 | 0.67%(+1.96)#736 |
| 25. | New Canaan | 2.59% | 1.53%(+1.06)#25 | 0.67%(+1.93)#760 |
| 26. | Trumbull Center | 2.54% | 1.53%(+1.01)#26 | 0.67%(+1.88)#779 |
| 27. | Cos Cob | 2.50% | 1.53%(+0.966)#27 | 0.67%(+1.83)#802 |
| 28. | West Hartford | 2.48% | 1.53%(+0.949)#28 | 0.67%(+1.82)#810 |
| 29. | Southport | 2.38% | 1.53%(+0.843)#29 | 0.67%(+1.71)#865 |
| 30. | Brookfield Center | 2.35% | 1.53%(+0.820)#30 | 0.67%(+1.69)#883 |
| 31. | Suffield Depot | 2.33% | 1.53%(+0.800)#31 | 0.67%(+1.67)#893 |
| 32. | Shelton | 2.10% | 1.53%(+0.563)#32 | 0.67%(+1.43)#1,028 |
| 33. | Southwood Acres | 2.09% | 1.53%(+0.561)#33 | 0.67%(+1.43)#1,032 |
| 34. | East Hampton | 2.07% | 1.53%(+0.539)#34 | 0.67%(+1.40)#1,053 |
| 35. | Essex Village | 2.06% | 1.53%(+0.522)#35 | 0.67%(+1.39)#1,063 |
| 36. | Clinton | 2.02% | 1.53%(+0.490)#36 | 0.67%(+1.36)#1,086 |
| 37. | Middletown | 2.00% | 1.53%(+0.465)#37 | 0.67%(+1.33)#1,100 |
| 38. | Waterbury | 1.96% | 1.53%(+0.424)#38 | 0.67%(+1.29)#1,129 |
| 39. | East | 1.91% | 1.53%(+0.376)#39 | 0.67%(+1.24)#1,162 |
| 40. | Orange | 1.80% | 1.53%(+0.266)#40 | 0.67%(+1.13)#1,267 |
| 41. | Lake Pocotopaug | 1.74% | 1.53%(+0.210)#41 | 0.67%(+1.08)#1,324 |
| 42. | East Hartford | 1.68% | 1.53%(+0.149)#42 | 0.67%(+1.02)#1,380 |
| 43. | Bridgeport | 1.62% | 1.53%(+0.087)#43 | 0.67%(+0.953)#1,456 |
| 44. | Salmon Brook | 1.60% | 1.53%(+0.069)#44 | 0.67%(+0.935)#1,470 |
| 45. | Glastonbury Center | 1.58% | 1.53%(+0.050)#45 | 0.67%(+0.916)#1,501 |
| 46. | Sandy Hook | 1.49% | 1.53%(-0.044)#46 | 0.67%(+0.822)#1,623 |
| 47. | Plantsville | 1.49% | 1.53%(-0.046)#47 | 0.67%(+0.820)#1,626 |
| 48. | Woodmont Borough | 1.48% | 1.53%(-0.051)#48 | 0.67%(+0.815)#1,631 |
| 49. | Chester Center | 1.45% | 1.53%(-0.087)#49 | 0.67%(+0.779)#1,676 |
| 50. | Torrington | 1.43% | 1.53%(-0.103)#50 | 0.67%(+0.763)#1,689 |
| 51. | Compo | 1.40% | 1.53%(-0.131)#51 | 0.67%(+0.735)#1,730 |
| 52. | Ridgefield | 1.40% | 1.53%(-0.136)#52 | 0.67%(+0.731)#1,738 |
| 53. | New Hartford Center | 1.39% | 1.53%(-0.140)#53 | 0.67%(+0.726)#1,748 |
| 54. | Inglenook | 1.39% | 1.53%(-0.147)#54 | 0.67%(+0.719)#1,758 |
| 55. | Glenville | 1.38% | 1.53%(-0.152)#55 | 0.67%(+0.715)#1,763 |
| 56. | Greens Farms | 1.38% | 1.53%(-0.156)#56 | 0.67%(+0.710)#1,768 |
| 57. | Norwalk | 1.37% | 1.53%(-0.167)#57 | 0.67%(+0.699)#1,783 |
| 58. | Ansonia | 1.36% | 1.53%(-0.177)#58 | 0.67%(+0.689)#1,800 |
| 59. | Ball Pond | 1.30% | 1.53%(-0.229)#59 | 0.67%(+0.637)#1,864 |
| 60. | Coleytown | 1.30% | 1.53%(-0.235)#60 | 0.67%(+0.631)#1,872 |
| 61. | Stratford Downtown | 1.28% | 1.53%(-0.251)#61 | 0.67%(+0.616)#1,900 |
| 62. | Quinebaug | 1.27% | 1.53%(-0.265)#62 | 0.67%(+0.601)#1,924 |
| 63. | Noroton Heights | 1.23% | 1.53%(-0.302)#63 | 0.67%(+0.564)#1,999 |
| 64. | Hartford | 1.22% | 1.53%(-0.309)#64 | 0.67%(+0.557)#2,015 |
| 65. | Sherwood Manor | 1.22% | 1.53%(-0.312)#65 | 0.67%(+0.554)#2,022 |
| 66. | New Milford | 1.20% | 1.53%(-0.335)#66 | 0.67%(+0.531)#2,060 |
| 67. | New Haven | 1.18% | 1.53%(-0.355)#67 | 0.67%(+0.512)#2,085 |
| 68. | Bristol | 1.16% | 1.53%(-0.370)#68 | 0.67%(+0.496)#2,115 |
| 69. | North Haven | 1.16% | 1.53%(-0.375)#69 | 0.67%(+0.491)#2,124 |
| 70. | Guilford Center | 1.14% | 1.53%(-0.392)#70 | 0.67%(+0.474)#2,158 |
| 71. | Bethel | 1.13% | 1.53%(-0.408)#71 | 0.67%(+0.458)#2,189 |
| 72. | Meriden | 1.11% | 1.53%(-0.420)#72 | 0.67%(+0.446)#2,217 |
| 73. | Greenwich | 1.10% | 1.53%(-0.430)#73 | 0.67%(+0.436)#2,238 |
| 74. | Old Greenwich | 1.09% | 1.53%(-0.443)#74 | 0.67%(+0.424)#2,260 |
| 75. | Simsbury Center | 1.08% | 1.53%(-0.453)#75 | 0.67%(+0.413)#2,280 |
| 76. | Heritage Village | 1.04% | 1.53%(-0.490)#76 | 0.67%(+0.376)#2,370 |
| 77. | Plattsville | 1.03% | 1.53%(-0.506)#77 | 0.67%(+0.360)#2,404 |
| 78. | Naugatuck Borough | 1.02% | 1.53%(-0.516)#78 | 0.67%(+0.350)#2,428 |
| 79. | Milford City Balance | 1.01% | 1.53%(-0.523)#79 | 0.67%(+0.343)#2,439 |
| 80. | Lordship | 0.99% | 1.53%(-0.546)#80 | 0.67%(+0.320)#2,492 |
| 81. | Moodus | 0.96% | 1.53%(-0.573)#81 | 0.67%(+0.293)#2,561 |
| 82. | Tariffville | 0.94% | 1.53%(-0.590)#82 | 0.67%(+0.276)#2,600 |
| 83. | Tashua | 0.94% | 1.53%(-0.593)#83 | 0.67%(+0.273)#2,609 |
| 84. | Darien Downtown | 0.93% | 1.53%(-0.599)#84 | 0.67%(+0.267)#2,627 |
| 85. | Branford Center | 0.90% | 1.53%(-0.630)#85 | 0.67%(+0.236)#2,721 |
| 86. | Lakes East | 0.89% | 1.53%(-0.641)#86 | 0.67%(+0.225)#2,739 |
| 87. | Danbury | 0.87% | 1.53%(-0.660)#87 | 0.67%(+0.206)#2,797 |
| 88. | Quinnipiac University | 0.83% | 1.53%(-0.701)#88 | 0.67%(+0.165)#2,919 |
| 89. | Hazardville | 0.82% | 1.53%(-0.717)#89 | 0.67%(+0.149)#2,962 |
| 90. | Norwich | 0.76% | 1.53%(-0.772)#90 | 0.67%(+0.094)#3,144 |
| 91. | Wallingford Center | 0.74% | 1.53%(-0.797)#91 | 0.67%(+0.069)#3,227 |
| 92. | Crystal Lake | 0.72% | 1.53%(-0.812)#92 | 0.67%(+0.054)#3,282 |
| 93. | Byram | 0.72% | 1.53%(-0.814)#93 | 0.67%(+0.052)#3,291 |
| 94. | North Granby | 0.71% | 1.53%(-0.826)#94 | 0.67%(+0.040)#3,336 |
| 95. | Deep River Center | 0.70% | 1.53%(-0.830)#95 | 0.67%(+0.037)#3,353 |
| 96. | Noroton | 0.70% | 1.53%(-0.837)#96 | 0.67%(+0.029)#3,391 |
| 97. | New Preston | 0.68% | 1.53%(-0.851)#97 | 0.67%(+0.015)#3,439 |
| 98. | Cheshire Village | 0.66% | 1.53%(-0.870)#98 | 0.67%(-0.004)#3,517 |
| 99. | Willimantic | 0.65% | 1.53%(-0.880)#99 | 0.67%(-0.014)#3,562 |
| 100. | Mystic | 0.63% | 1.53%(-0.899)#100 | 0.67%(-0.033)#3,646 |
1
2Common Questions
What are the Top 10 Cities with the Highest Percentage of Immigrants from Eastern Europe in Connecticut?
Top 10 Cities with the Highest Percentage of Immigrants from Eastern Europe in Connecticut are:
#1
7.27%
#2
6.67%
#3
4.95%
#4
4.57%
#5
3.99%
#6
3.84%
#7
3.28%
#8
3.28%
#9
2.85%
#10
2.84%
What city has the Highest Percentage of Immigrants from Eastern Europe in Connecticut?
New Britain has the Highest Percentage of Immigrants from Eastern Europe in Connecticut with 7.27%.
What is the Percentage of Immigrants from Eastern Europe in the State of Connecticut?
Percentage of Immigrants from Eastern Europe in Connecticut is 1.53%.
What is the Percentage of Immigrants from Eastern Europe in the United States?
Percentage of Immigrants from Eastern Europe in the United States is 0.67%.