Colesville, MD
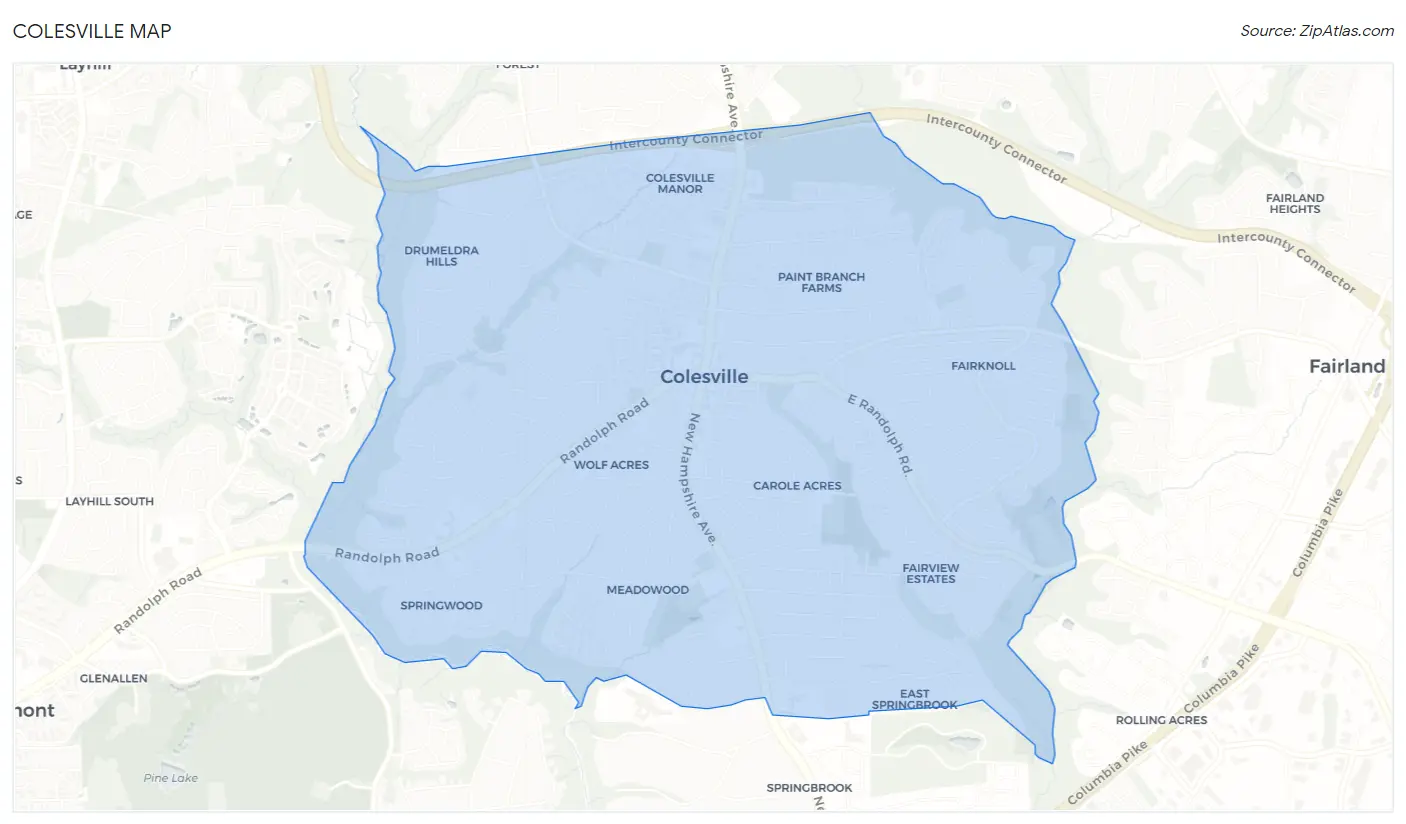
Colesville Map
Colesville Overview
13,704
TOTAL POPULATION
6,979
MALE POPULATION
6,725
FEMALE POPULATION
103.78
MALES / 100 FEMALES
96.36
FEMALES / 100 MALES
52.4
MEDIAN AGE
3.1
AVG FAMILY SIZE
2.7
AVG HOUSEHOLD SIZE
$63,950
PER CAPITA INCOME
$154,516
AVG FAMILY INCOME
$139,894
AVG HOUSEHOLD INCOME
5.0%
WAGE / INCOME GAP [ % ]
95.0¢/ $1
WAGE / INCOME GAP [ $ ]
0.44
INEQUALITY / GINI INDEX
7,040
LABOR FORCE [ PEOPLE ]
59.7%
PERCENT IN LABOR FORCE
3.7%
UNEMPLOYMENT RATE
Race in Colesville
The most populous races in Colesville are White / Caucasian (5,534 | 40.4%), Black / African American (4,316 | 31.5%), and Hispanic or Latino (1,913 | 14.0%).
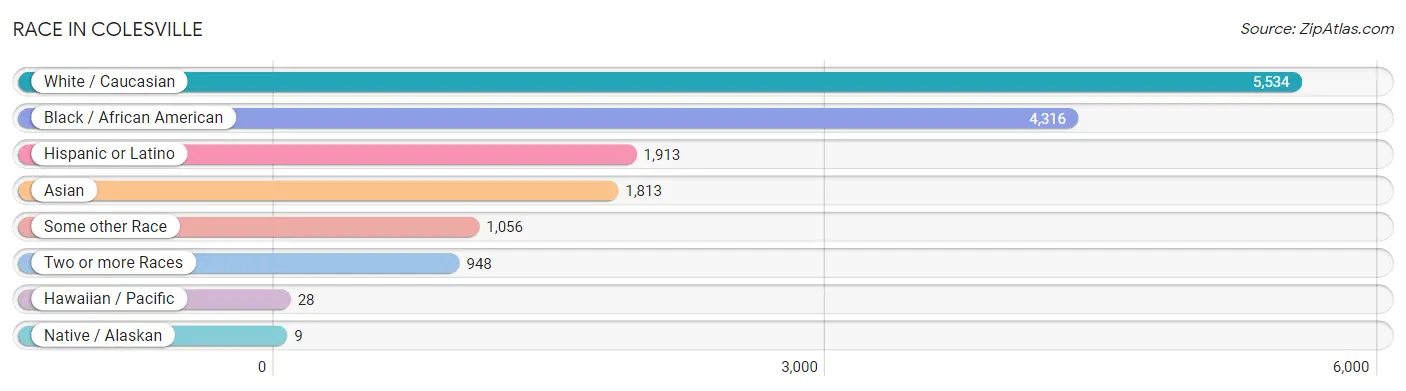
| Race | # Population | % Population |
| Asian | 1,813 | 13.2% |
| Black / African American | 4,316 | 31.5% |
| Hawaiian / Pacific | 28 | 0.2% |
| Hispanic or Latino | 1,913 | 14.0% |
| Native / Alaskan | 9 | 0.1% |
| White / Caucasian | 5,534 | 40.4% |
| Two or more Races | 948 | 6.9% |
| Some other Race | 1,056 | 7.7% |
| Total | 13,704 | 100.0% |
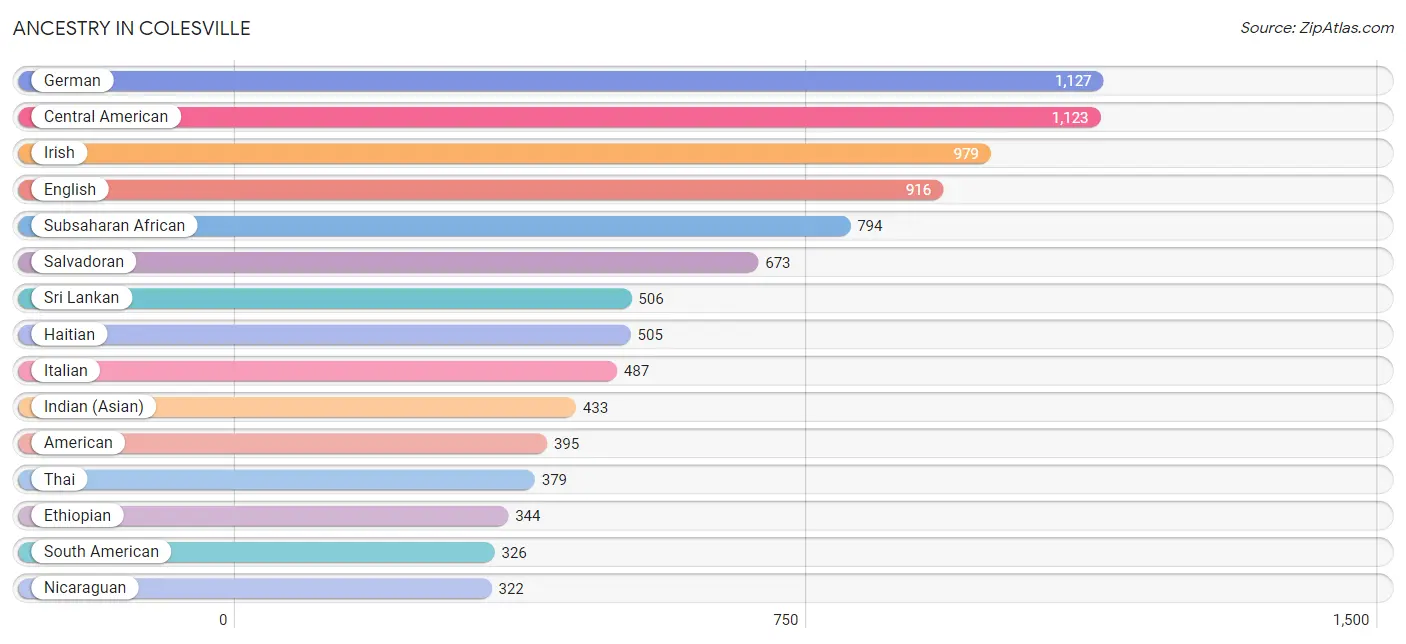
Ancestry in Colesville
The most populous ancestries reported in Colesville are German (1,127 | 8.2%), Central American (1,123 | 8.2%), Irish (979 | 7.1%), English (916 | 6.7%), and Subsaharan African (794 | 5.8%), together accounting for 36.0% of all Colesville residents.
| Ancestry | # Population | % Population |
| Afghan | 25 | 0.2% |
| African | 300 | 2.2% |
| American | 395 | 2.9% |
| Austrian | 1 | 0.0% |
| Barbadian | 13 | 0.1% |
| Bhutanese | 118 | 0.9% |
| Bolivian | 118 | 0.9% |
| Brazilian | 152 | 1.1% |
| British | 82 | 0.6% |
| Burmese | 290 | 2.1% |
| Canadian | 21 | 0.2% |
| Central American | 1,123 | 8.2% |
| Chilean | 30 | 0.2% |
| Colombian | 9 | 0.1% |
| Croatian | 21 | 0.2% |
| Czech | 27 | 0.2% |
| Czechoslovakian | 32 | 0.2% |
| Danish | 7 | 0.1% |
| Dominican | 55 | 0.4% |
| Dutch | 62 | 0.4% |
| Eastern European | 246 | 1.8% |
| English | 916 | 6.7% |
| Ethiopian | 344 | 2.5% |
| European | 247 | 1.8% |
| Filipino | 19 | 0.1% |
| Finnish | 17 | 0.1% |
| French | 142 | 1.0% |
| German | 1,127 | 8.2% |
| Greek | 143 | 1.0% |
| Guamanian / Chamorro | 1 | 0.0% |
| Guyanese | 19 | 0.1% |
| Haitian | 505 | 3.7% |
| Honduran | 105 | 0.8% |
| Hungarian | 26 | 0.2% |
| Indian (Asian) | 433 | 3.2% |
| Indonesian | 67 | 0.5% |
| Irish | 979 | 7.1% |
| Italian | 487 | 3.5% |
| Jamaican | 183 | 1.3% |
| Japanese | 75 | 0.5% |
| Kenyan | 12 | 0.1% |
| Korean | 153 | 1.1% |
| Latvian | 32 | 0.2% |
| Liberian | 5 | 0.0% |
| Malaysian | 5 | 0.0% |
| Mexican | 44 | 0.3% |
| Native Hawaiian | 14 | 0.1% |
| Nicaraguan | 322 | 2.4% |
| Nigerian | 76 | 0.5% |
| Northern European | 64 | 0.5% |
| Norwegian | 70 | 0.5% |
| Osage | 22 | 0.2% |
| Panamanian | 23 | 0.2% |
| Peruvian | 169 | 1.2% |
| Polish | 95 | 0.7% |
| Portuguese | 35 | 0.3% |
| Puerto Rican | 72 | 0.5% |
| Russian | 224 | 1.6% |
| Salvadoran | 673 | 4.9% |
| Samoan | 28 | 0.2% |
| Scandinavian | 12 | 0.1% |
| Scotch-Irish | 27 | 0.2% |
| Scottish | 216 | 1.6% |
| Slovak | 19 | 0.1% |
| South African | 7 | 0.1% |
| South American | 326 | 2.4% |
| Spaniard | 11 | 0.1% |
| Spanish | 18 | 0.1% |
| Sri Lankan | 506 | 3.7% |
| Subsaharan African | 794 | 5.8% |
| Swedish | 240 | 1.8% |
| Swiss | 15 | 0.1% |
| Thai | 379 | 2.8% |
| Trinidadian and Tobagonian | 15 | 0.1% |
| U.S. Virgin Islander | 5 | 0.0% |
| Ukrainian | 22 | 0.2% |
| Vietnamese | 53 | 0.4% |
| Welsh | 64 | 0.5% |
| West Indian | 77 | 0.6% | View All 79 Rows |
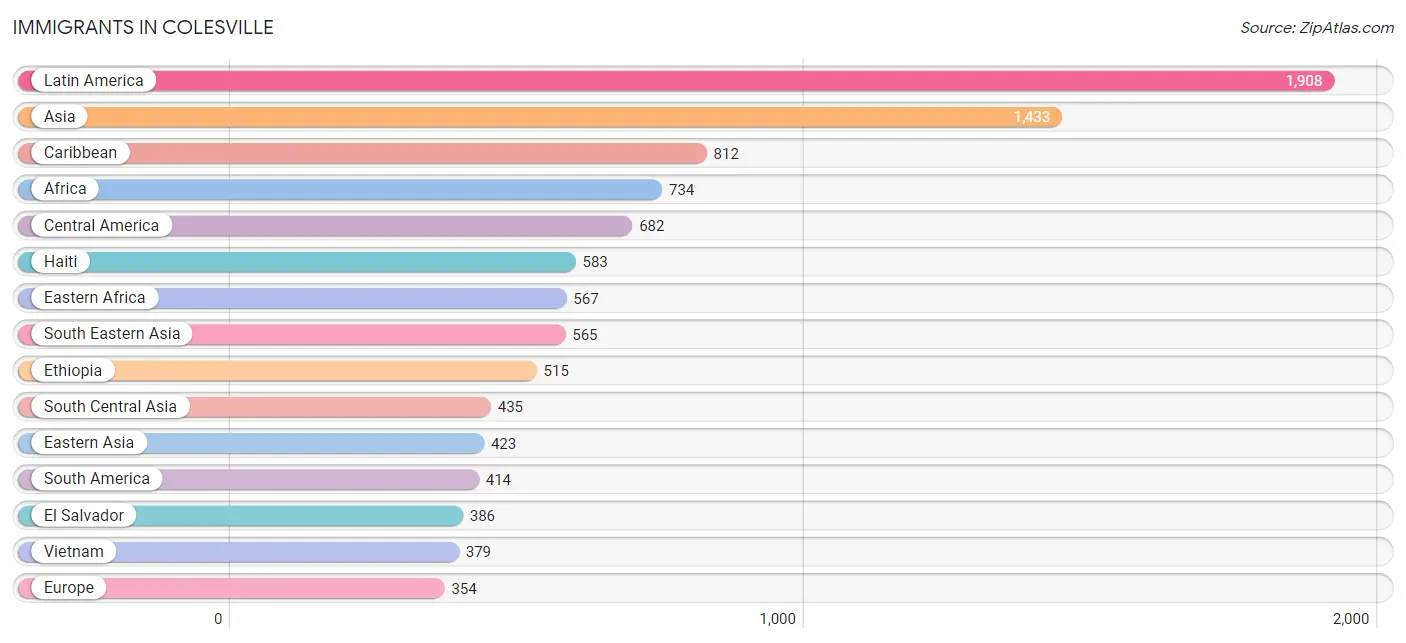
Immigrants in Colesville
The most numerous immigrant groups reported in Colesville came from Latin America (1,908 | 13.9%), Asia (1,433 | 10.5%), Caribbean (812 | 5.9%), Africa (734 | 5.4%), and Central America (682 | 5.0%), together accounting for 40.6% of all Colesville residents.
| Immigration Origin | # Population | % Population |
| Afghanistan | 28 | 0.2% |
| Africa | 734 | 5.4% |
| Asia | 1,433 | 10.5% |
| Bangladesh | 121 | 0.9% |
| Barbados | 13 | 0.1% |
| Bolivia | 140 | 1.0% |
| Brazil | 57 | 0.4% |
| Cambodia | 60 | 0.4% |
| Cameroon | 25 | 0.2% |
| Canada | 218 | 1.6% |
| Caribbean | 812 | 5.9% |
| Central America | 682 | 5.0% |
| Chile | 14 | 0.1% |
| China | 234 | 1.7% |
| Croatia | 21 | 0.2% |
| Eastern Africa | 567 | 4.1% |
| Eastern Asia | 423 | 3.1% |
| Eastern Europe | 115 | 0.8% |
| El Salvador | 386 | 2.8% |
| Eritrea | 23 | 0.2% |
| Ethiopia | 515 | 3.8% |
| Europe | 354 | 2.6% |
| France | 16 | 0.1% |
| Germany | 6 | 0.0% |
| Greece | 32 | 0.2% |
| Guatemala | 102 | 0.7% |
| Guyana | 107 | 0.8% |
| Haiti | 583 | 4.3% |
| Honduras | 1 | 0.0% |
| Hong Kong | 10 | 0.1% |
| India | 228 | 1.7% |
| Israel | 10 | 0.1% |
| Italy | 123 | 0.9% |
| Jamaica | 183 | 1.3% |
| Kenya | 12 | 0.1% |
| Korea | 189 | 1.4% |
| Laos | 5 | 0.0% |
| Latin America | 1,908 | 13.9% |
| Latvia | 31 | 0.2% |
| Liberia | 5 | 0.0% |
| Mexico | 25 | 0.2% |
| Middle Africa | 25 | 0.2% |
| Nepal | 12 | 0.1% |
| Nicaragua | 97 | 0.7% |
| Nigeria | 75 | 0.5% |
| Northern Europe | 40 | 0.3% |
| Pakistan | 46 | 0.3% |
| Panama | 71 | 0.5% |
| Peru | 85 | 0.6% |
| Philippines | 54 | 0.4% |
| Poland | 39 | 0.3% |
| Portugal | 11 | 0.1% |
| Russia | 24 | 0.2% |
| South Africa | 9 | 0.1% |
| South America | 414 | 3.0% |
| South Central Asia | 435 | 3.2% |
| South Eastern Asia | 565 | 4.1% |
| Southern Europe | 177 | 1.3% |
| Spain | 11 | 0.1% |
| Sweden | 7 | 0.1% |
| Taiwan | 34 | 0.3% |
| Trinidad and Tobago | 33 | 0.2% |
| Vietnam | 379 | 2.8% |
| Western Africa | 133 | 1.0% |
| Western Asia | 10 | 0.1% |
| Western Europe | 22 | 0.2% | View All 66 Rows |
Sex and Age in Colesville
Sex and Age in Colesville
The most populous age groups in Colesville are 60 to 64 Years (675 | 9.7%) for men and 65 to 69 Years (665 | 9.9%) for women.
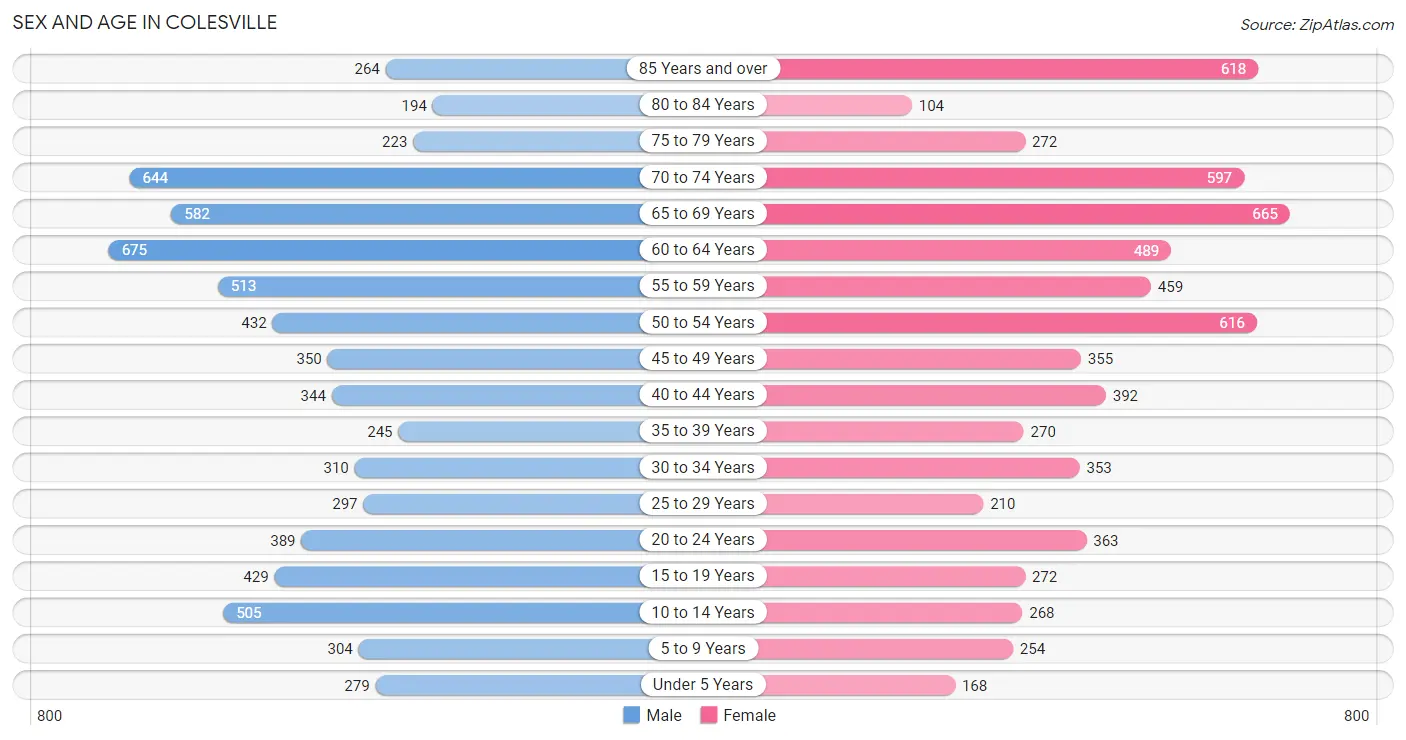
| Age Bracket | Male | Female |
| Under 5 Years | 279 (4.0%) | 168 (2.5%) |
| 5 to 9 Years | 304 (4.4%) | 254 (3.8%) |
| 10 to 14 Years | 505 (7.2%) | 268 (4.0%) |
| 15 to 19 Years | 429 (6.1%) | 272 (4.0%) |
| 20 to 24 Years | 389 (5.6%) | 363 (5.4%) |
| 25 to 29 Years | 297 (4.3%) | 210 (3.1%) |
| 30 to 34 Years | 310 (4.4%) | 353 (5.2%) |
| 35 to 39 Years | 245 (3.5%) | 270 (4.0%) |
| 40 to 44 Years | 344 (4.9%) | 392 (5.8%) |
| 45 to 49 Years | 350 (5.0%) | 355 (5.3%) |
| 50 to 54 Years | 432 (6.2%) | 616 (9.2%) |
| 55 to 59 Years | 513 (7.3%) | 459 (6.8%) |
| 60 to 64 Years | 675 (9.7%) | 489 (7.3%) |
| 65 to 69 Years | 582 (8.3%) | 665 (9.9%) |
| 70 to 74 Years | 644 (9.2%) | 597 (8.9%) |
| 75 to 79 Years | 223 (3.2%) | 272 (4.0%) |
| 80 to 84 Years | 194 (2.8%) | 104 (1.5%) |
| 85 Years and over | 264 (3.8%) | 618 (9.2%) |
| Total | 6,979 (100.0%) | 6,725 (100.0%) |
Families and Households in Colesville
Median Family Size in Colesville
The median family size in Colesville is 3.11 persons per family, with single male/father families (245 | 6.7%) accounting for the largest median family size of 4.09 persons per family. On the other hand, married-couple families (2,838 | 77.3%) represent the smallest median family size with 3.00 persons per family.
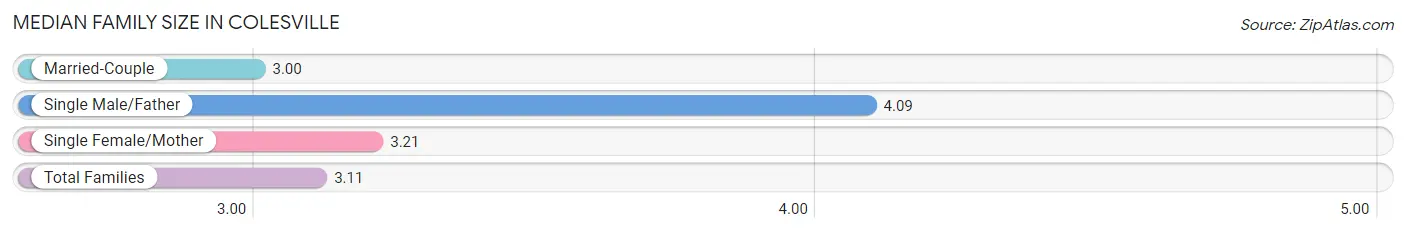
| Family Type | # Families | Family Size |
| Married-Couple | 2,838 (77.3%) | 3.00 |
| Single Male/Father | 245 (6.7%) | 4.09 |
| Single Female/Mother | 589 (16.0%) | 3.21 |
| Total Families | 3,672 (100.0%) | 3.11 |
Median Household Size in Colesville
The median household size in Colesville is 2.72 persons per household, with single male/father households (245 | 4.9%) accounting for the largest median household size of 4.63 persons per household. non-family households (1,297 | 26.1%) represent the smallest median household size with 1.34 persons per household.
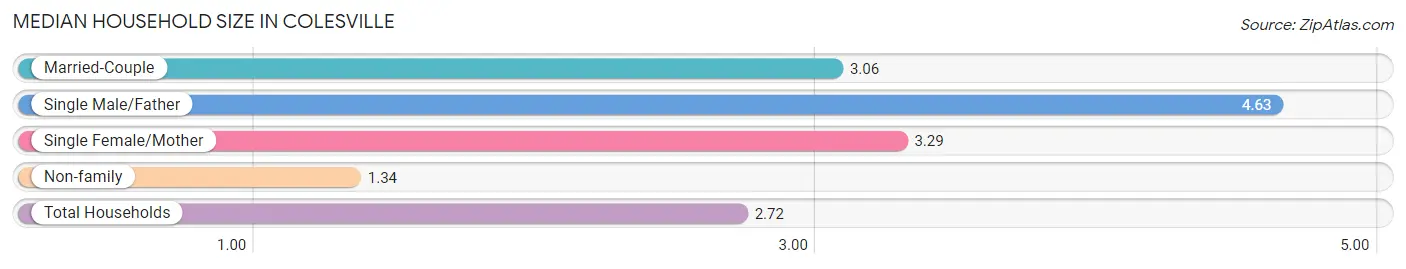
| Household Type | # Households | Household Size |
| Married-Couple | 2,838 (57.1%) | 3.06 |
| Single Male/Father | 245 (4.9%) | 4.63 |
| Single Female/Mother | 589 (11.8%) | 3.29 |
| Non-family | 1,297 (26.1%) | 1.34 |
| Total Households | 4,969 (100.0%) | 2.72 |
Household Size by Marriage Status in Colesville
Out of a total of 4,969 households in Colesville, 3,672 (73.9%) are family households, while 1,297 (26.1%) are nonfamily households. The most numerous type of family households are 2-person households, comprising 1,850, and the most common type of nonfamily households are 1-person households, comprising 1,044.
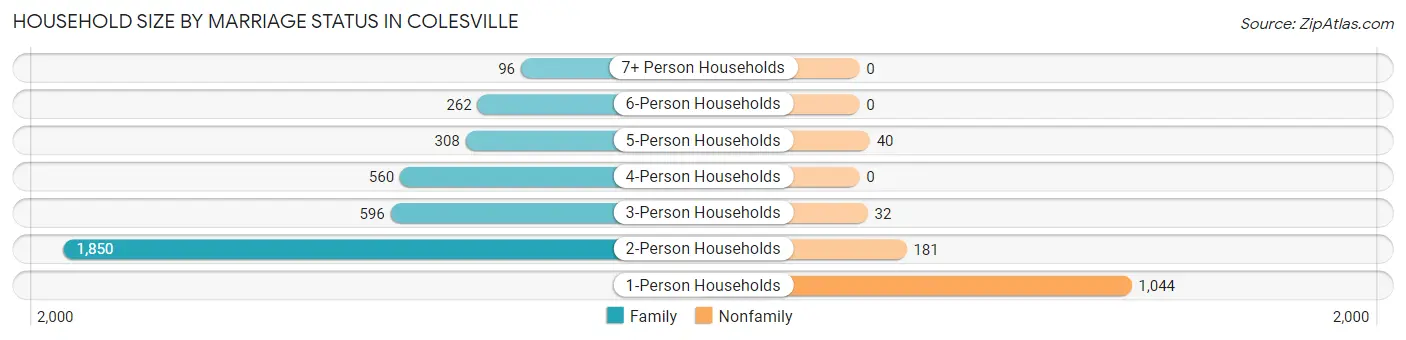
| Household Size | Family Households | Nonfamily Households |
| 1-Person Households | - | 1,044 (21.0%) |
| 2-Person Households | 1,850 (37.2%) | 181 (3.6%) |
| 3-Person Households | 596 (12.0%) | 32 (0.6%) |
| 4-Person Households | 560 (11.3%) | 0 (0.0%) |
| 5-Person Households | 308 (6.2%) | 40 (0.8%) |
| 6-Person Households | 262 (5.3%) | 0 (0.0%) |
| 7+ Person Households | 96 (1.9%) | 0 (0.0%) |
| Total | 3,672 (73.9%) | 1,297 (26.1%) |
Female Fertility in Colesville
Fertility by Age in Colesville
Average fertility rate in Colesville is 64.0 births per 1,000 women. Women in the age bracket of 35 to 50 years have the highest fertility rate with 78.0 births per 1,000 women. Women in the age bracket of 35 to 50 years acount for 59.2% of all women with births.
| Age Bracket | Women with Births | Births / 1,000 Women |
| 15 to 19 years | 0 (0.0%) | 0.0 |
| 20 to 34 years | 60 (40.8%) | 65.0 |
| 35 to 50 years | 87 (59.2%) | 78.0 |
| Total | 147 (100.0%) | 64.0 |
Fertility by Age by Marriage Status in Colesville
94.6% of women with births (147) in Colesville are married. The highest percentage of unmarried women with births falls into 35 to 50 years age bracket with 9.2% of them unmarried at the time of birth, while the lowest percentage of unmarried women with births belong to 20 to 34 years age bracket with 0.0% of them unmarried.
| Age Bracket | Married | Unmarried |
| 15 to 19 years | 0 (0.0%) | 0 (0.0%) |
| 20 to 34 years | 60 (100.0%) | 0 (0.0%) |
| 35 to 50 years | 79 (90.8%) | 8 (9.2%) |
| Total | 139 (94.6%) | 8 (5.4%) |
Fertility by Education in Colesville
| Educational Attainment | Women with Births | Births / 1,000 Women |
| Less than High School | 47 (32.0%) | 162.0 |
| High School Diploma | 0 (0.0%) | 0.0 |
| College or Associate's Degree | 31 (21.1%) | 61.0 |
| Bachelor's Degree | 31 (21.1%) | 41.0 |
| Graduate Degree | 38 (25.9%) | 67.0 |
| Total | 147 (100.0%) | 64.0 |
Fertility by Education by Marriage Status in Colesville
5.4% of women with births in Colesville are unmarried. Women with the educational attainment of less than high school are most likely to be married with 100.0% of them married at childbirth, while women with the educational attainment of college or associate's degree are least likely to be married with 25.8% of them unmarried at childbirth.
| Educational Attainment | Married | Unmarried |
| Less than High School | 47 (100.0%) | 0 (0.0%) |
| High School Diploma | 0 (0.0%) | 0 (0.0%) |
| College or Associate's Degree | 23 (74.2%) | 8 (25.8%) |
| Bachelor's Degree | 31 (100.0%) | 0 (0.0%) |
| Graduate Degree | 38 (100.0%) | 0 (0.0%) |
| Total | 139 (94.6%) | 8 (5.4%) |
Income in Colesville
Income Overview in Colesville
Per Capita Income in Colesville is $63,950, while median incomes of families and households are $154,516 and $139,894 respectively.
| Characteristic | Number | Measure |
| Per Capita Income | 13,704 | $63,950 |
| Median Family Income | 3,672 | $154,516 |
| Mean Family Income | 3,672 | $194,523 |
| Median Household Income | 4,969 | $139,894 |
| Mean Household Income | 4,969 | $172,571 |
| Income Deficit | 3,672 | $0 |
| Wage / Income Gap (%) | 13,704 | 5.03% |
| Wage / Income Gap ($) | 13,704 | 94.97¢ per $1 |
| Gini / Inequality Index | 13,704 | 0.44 |
Earnings by Sex in Colesville
Average Earnings in Colesville are $64,895, $66,790 for men and $63,432 for women, a difference of 5.0%.
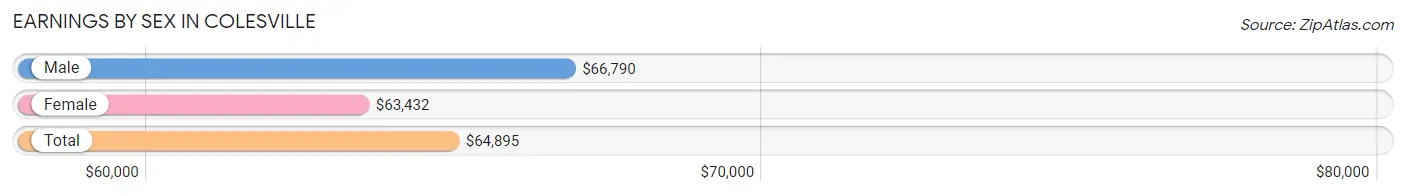
| Sex | Number | Average Earnings |
| Male | 3,988 (54.7%) | $66,790 |
| Female | 3,303 (45.3%) | $63,432 |
| Total | 7,291 (100.0%) | $64,895 |
Earnings by Sex by Income Bracket in Colesville
The most common earnings brackets in Colesville are $100,000+ for men (1,357 | 34.0%) and $100,000+ for women (891 | 27.0%).
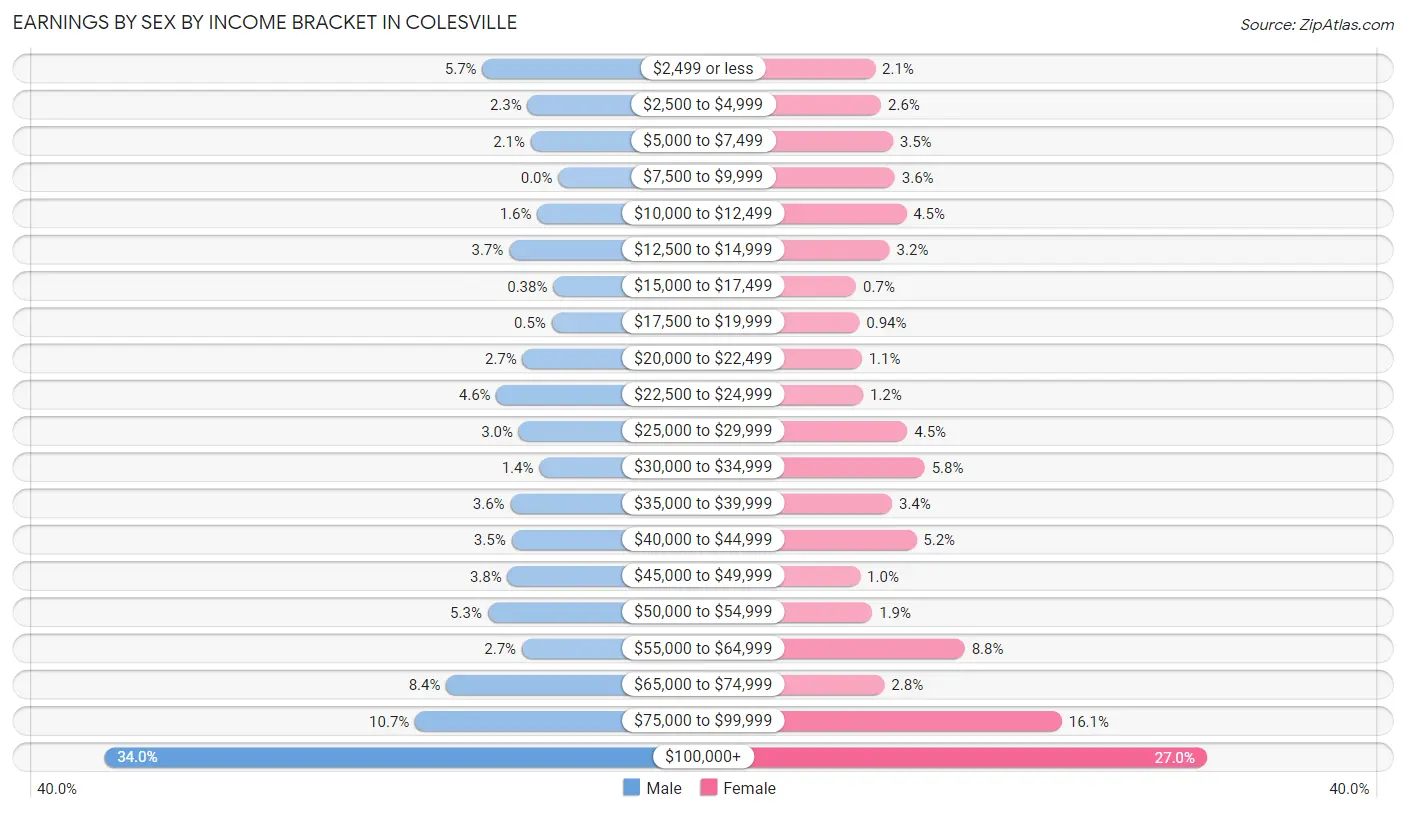
| Income | Male | Female |
| $2,499 or less | 227 (5.7%) | 70 (2.1%) |
| $2,500 to $4,999 | 92 (2.3%) | 85 (2.6%) |
| $5,000 to $7,499 | 82 (2.1%) | 114 (3.5%) |
| $7,500 to $9,999 | 0 (0.0%) | 119 (3.6%) |
| $10,000 to $12,499 | 63 (1.6%) | 147 (4.4%) |
| $12,500 to $14,999 | 147 (3.7%) | 106 (3.2%) |
| $15,000 to $17,499 | 15 (0.4%) | 23 (0.7%) |
| $17,500 to $19,999 | 20 (0.5%) | 31 (0.9%) |
| $20,000 to $22,499 | 107 (2.7%) | 37 (1.1%) |
| $22,500 to $24,999 | 185 (4.6%) | 40 (1.2%) |
| $25,000 to $29,999 | 118 (3.0%) | 150 (4.5%) |
| $30,000 to $34,999 | 57 (1.4%) | 193 (5.8%) |
| $35,000 to $39,999 | 143 (3.6%) | 112 (3.4%) |
| $40,000 to $44,999 | 140 (3.5%) | 172 (5.2%) |
| $45,000 to $49,999 | 152 (3.8%) | 33 (1.0%) |
| $50,000 to $54,999 | 211 (5.3%) | 63 (1.9%) |
| $55,000 to $64,999 | 109 (2.7%) | 292 (8.8%) |
| $65,000 to $74,999 | 335 (8.4%) | 93 (2.8%) |
| $75,000 to $99,999 | 428 (10.7%) | 532 (16.1%) |
| $100,000+ | 1,357 (34.0%) | 891 (27.0%) |
| Total | 3,988 (100.0%) | 3,303 (100.0%) |
Earnings by Sex by Educational Attainment in Colesville
Average earnings in Colesville are $76,583 for men and $69,137 for women, a difference of 9.7%. Men with an educational attainment of graduate degree enjoy the highest average annual earnings of $111,227, while those with less than high school education earn the least with $43,125. Women with an educational attainment of graduate degree earn the most with the average annual earnings of $103,523, while those with high school diploma education have the smallest earnings of $26,474.
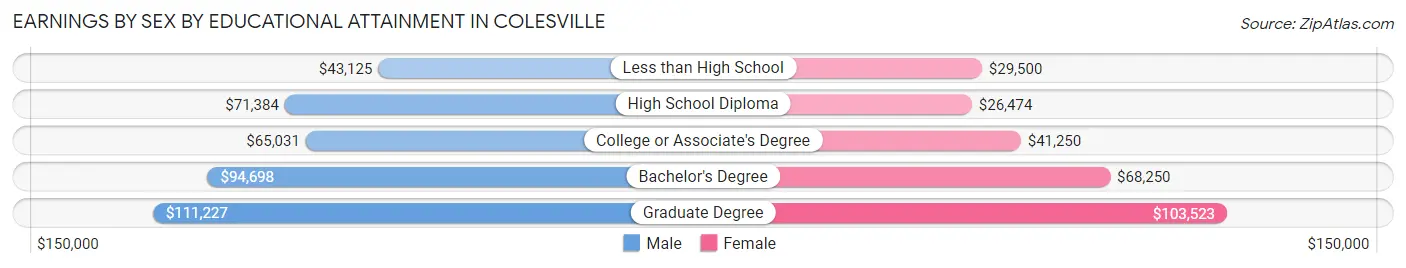
| Educational Attainment | Male Income | Female Income |
| Less than High School | $43,125 | $29,500 |
| High School Diploma | $71,384 | $26,474 |
| College or Associate's Degree | $65,031 | $41,250 |
| Bachelor's Degree | $94,698 | $68,250 |
| Graduate Degree | $111,227 | $103,523 |
| Total | $76,583 | $69,137 |
Family Income in Colesville
Family Income Brackets in Colesville
According to the Colesville family income data, there are 1,373 families falling into the $200,000+ income range, which is the most common income bracket and makes up 37.4% of all families. Conversely, the less than $10,000 income bracket is the least frequent group with only 15 families (0.4%) belonging to this category.
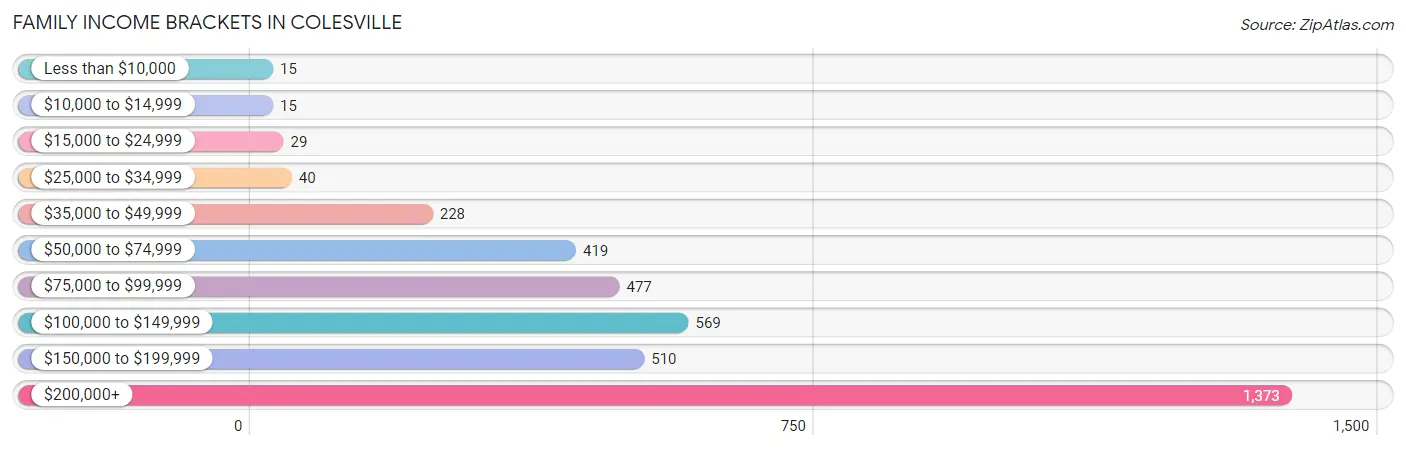
| Income Bracket | # Families | % Families |
| Less than $10,000 | 15 | 0.4% |
| $10,000 to $14,999 | 15 | 0.4% |
| $15,000 to $24,999 | 29 | 0.8% |
| $25,000 to $34,999 | 40 | 1.1% |
| $35,000 to $49,999 | 228 | 6.2% |
| $50,000 to $74,999 | 419 | 11.4% |
| $75,000 to $99,999 | 477 | 13.0% |
| $100,000 to $149,999 | 569 | 15.5% |
| $150,000 to $199,999 | 510 | 13.9% |
| $200,000+ | 1,373 | 37.4% |
Family Income by Famaliy Size in Colesville
6-person families (166 | 4.5%) account for the highest median family income in Colesville with $246,053 per family, while 2-person families (1,898 | 51.7%) have the highest median income of $70,970 per family member.
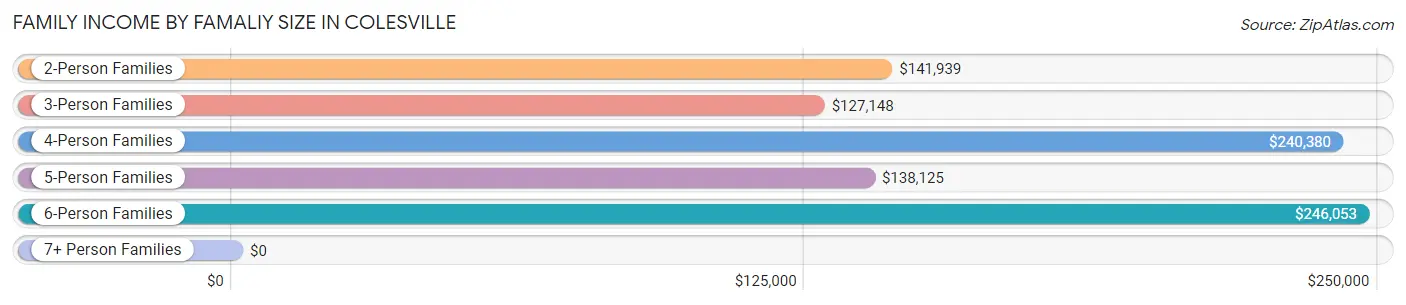
| Income Bracket | # Families | Median Income |
| 2-Person Families | 1,898 (51.7%) | $141,939 |
| 3-Person Families | 602 (16.4%) | $127,148 |
| 4-Person Families | 609 (16.6%) | $240,380 |
| 5-Person Families | 301 (8.2%) | $138,125 |
| 6-Person Families | 166 (4.5%) | $246,053 |
| 7+ Person Families | 96 (2.6%) | $0 |
| Total | 3,672 (100.0%) | $154,516 |
Family Income by Number of Earners in Colesville
The median family income in Colesville is $154,516, with families comprising 3+ earners (514) having the highest median family income of $198,889, while families with 1 earner (935) have the lowest median family income of $92,052, accounting for 14.0% and 25.5% of families, respectively.
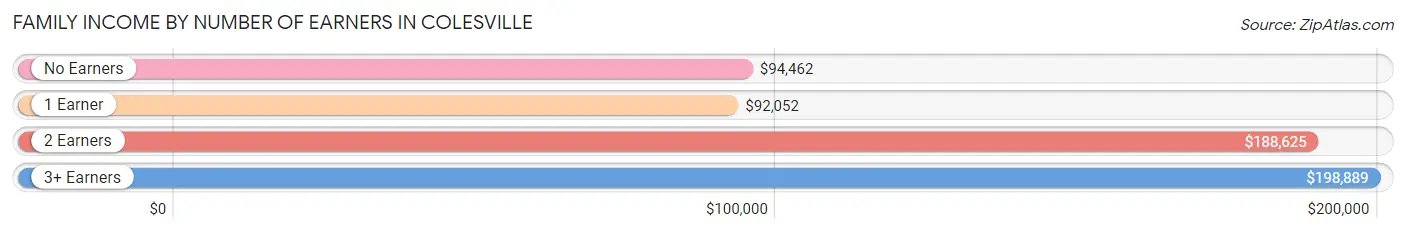
| Number of Earners | # Families | Median Income |
| No Earners | 544 (14.8%) | $94,462 |
| 1 Earner | 935 (25.5%) | $92,052 |
| 2 Earners | 1,679 (45.7%) | $188,625 |
| 3+ Earners | 514 (14.0%) | $198,889 |
| Total | 3,672 (100.0%) | $154,516 |
Household Income in Colesville
Household Income Brackets in Colesville
With 1,615 households falling in the category, the $200,000+ income range is the most frequent in Colesville, accounting for 32.5% of all households. In contrast, only 45 households (0.9%) fall into the $10,000 to $14,999 income bracket, making it the least populous group.
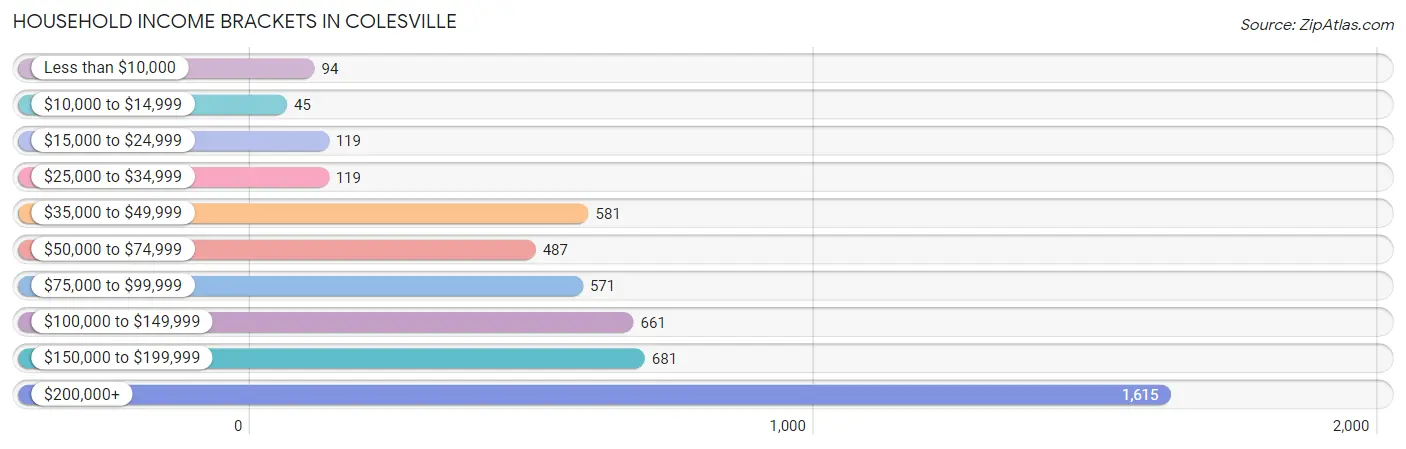
| Income Bracket | # Households | % Households |
| Less than $10,000 | 94 | 1.9% |
| $10,000 to $14,999 | 45 | 0.9% |
| $15,000 to $24,999 | 119 | 2.4% |
| $25,000 to $34,999 | 119 | 2.4% |
| $35,000 to $49,999 | 581 | 11.7% |
| $50,000 to $74,999 | 487 | 9.8% |
| $75,000 to $99,999 | 571 | 11.5% |
| $100,000 to $149,999 | 661 | 13.3% |
| $150,000 to $199,999 | 681 | 13.7% |
| $200,000+ | 1,615 | 32.5% |
Household Income by Householder Age in Colesville
The median household income in Colesville is $139,894, with the highest median household income of $182,557 found in the 45 to 64 years age bracket for the primary householder. A total of 1,784 households (35.9%) fall into this category.
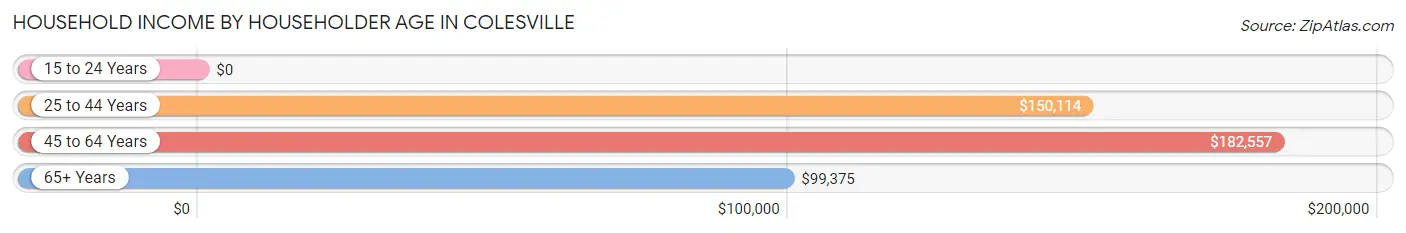
| Income Bracket | # Households | Median Income |
| 15 to 24 Years | 0 (0.0%) | $0 |
| 25 to 44 Years | 818 (16.5%) | $150,114 |
| 45 to 64 Years | 1,784 (35.9%) | $182,557 |
| 65+ Years | 2,367 (47.6%) | $99,375 |
| Total | 4,969 (100.0%) | $139,894 |
Poverty in Colesville
Income Below Poverty by Sex and Age in Colesville
With 2.7% poverty level for males and 5.3% for females among the residents of Colesville, 18 to 24 year old males and 16 and 17 year old females are the most vulnerable to poverty, with 38 males (7.8%) and 13 females (13.8%) in their respective age groups living below the poverty level.
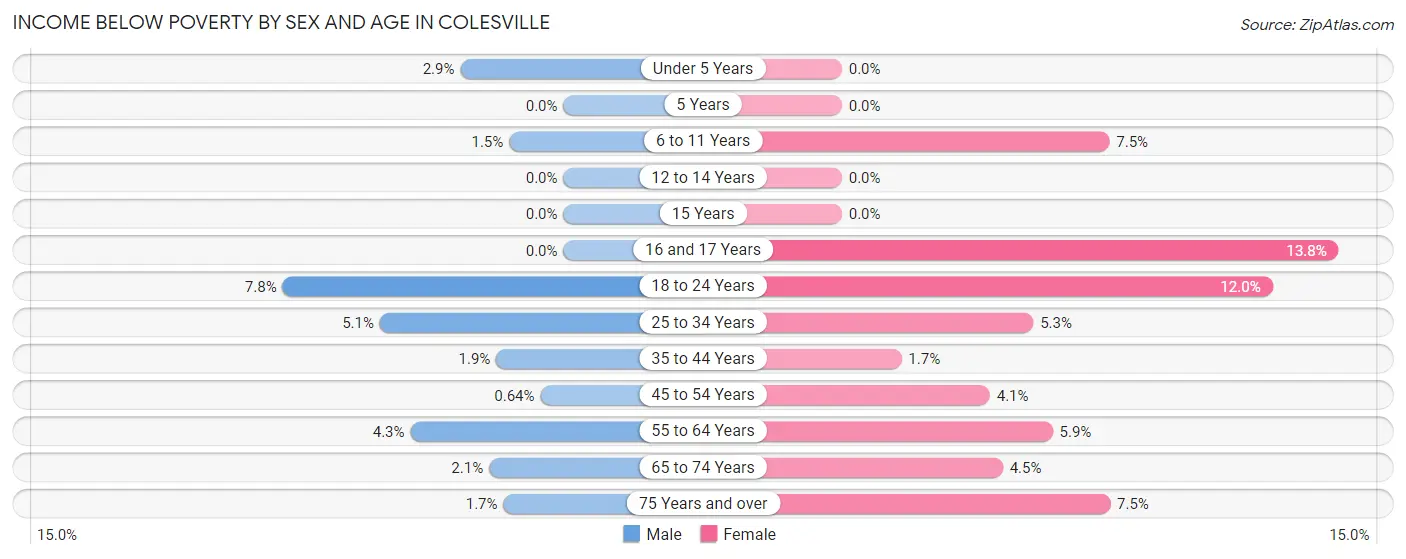
| Age Bracket | Male | Female |
| Under 5 Years | 8 (2.9%) | 0 (0.0%) |
| 5 Years | 0 (0.0%) | 0 (0.0%) |
| 6 to 11 Years | 8 (1.5%) | 24 (7.4%) |
| 12 to 14 Years | 0 (0.0%) | 0 (0.0%) |
| 15 Years | 0 (0.0%) | 0 (0.0%) |
| 16 and 17 Years | 0 (0.0%) | 13 (13.8%) |
| 18 to 24 Years | 38 (7.8%) | 53 (12.0%) |
| 25 to 34 Years | 31 (5.1%) | 30 (5.3%) |
| 35 to 44 Years | 11 (1.9%) | 11 (1.7%) |
| 45 to 54 Years | 5 (0.6%) | 40 (4.1%) |
| 55 to 64 Years | 50 (4.3%) | 55 (5.9%) |
| 65 to 74 Years | 25 (2.1%) | 56 (4.5%) |
| 75 Years and over | 11 (1.7%) | 73 (7.5%) |
| Total | 187 (2.7%) | 355 (5.3%) |
Income Above Poverty by Sex and Age in Colesville
According to the poverty statistics in Colesville, males aged 5 years and females aged under 5 years are the age groups that are most secure financially, with 100.0% of males and 100.0% of females in these age groups living above the poverty line.
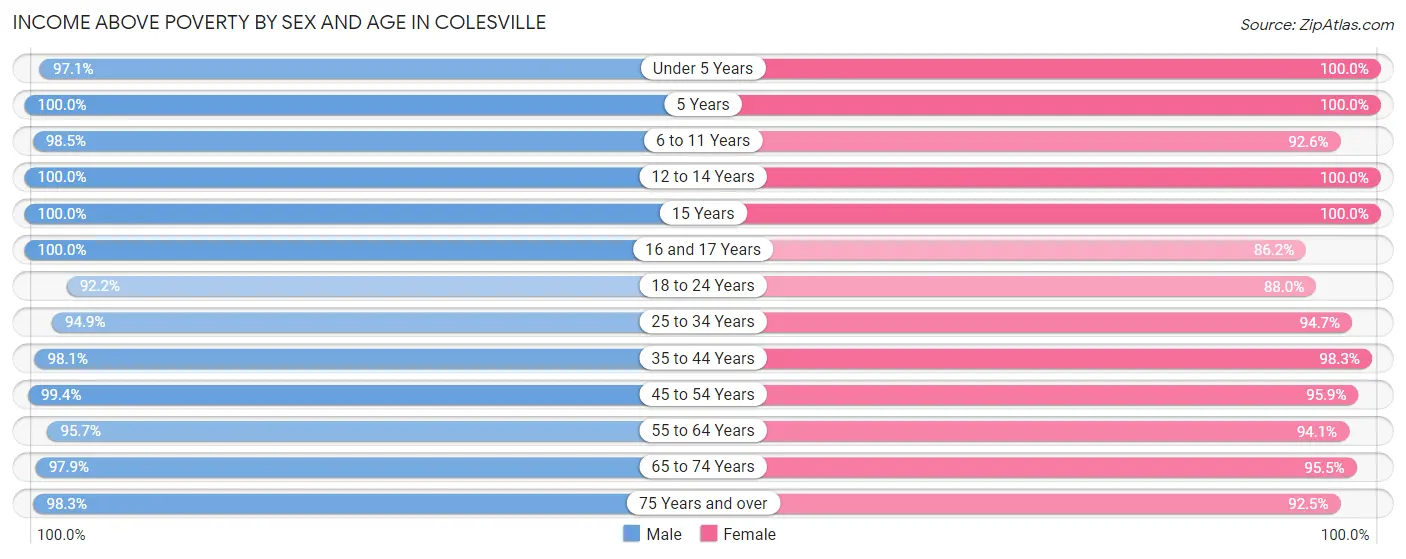
| Age Bracket | Male | Female |
| Under 5 Years | 271 (97.1%) | 150 (100.0%) |
| 5 Years | 52 (100.0%) | 15 (100.0%) |
| 6 to 11 Years | 522 (98.5%) | 298 (92.5%) |
| 12 to 14 Years | 227 (100.0%) | 177 (100.0%) |
| 15 Years | 34 (100.0%) | 99 (100.0%) |
| 16 and 17 Years | 291 (100.0%) | 81 (86.2%) |
| 18 to 24 Years | 448 (92.2%) | 389 (88.0%) |
| 25 to 34 Years | 576 (94.9%) | 533 (94.7%) |
| 35 to 44 Years | 578 (98.1%) | 651 (98.3%) |
| 45 to 54 Years | 777 (99.4%) | 931 (95.9%) |
| 55 to 64 Years | 1,123 (95.7%) | 882 (94.1%) |
| 65 to 74 Years | 1,185 (97.9%) | 1,194 (95.5%) |
| 75 Years and over | 649 (98.3%) | 904 (92.5%) |
| Total | 6,733 (97.3%) | 6,304 (94.7%) |
Income Below Poverty Among Married-Couple Families in Colesville
The poverty statistics for married-couple families in Colesville show that 1.4% or 41 of the total 2,838 families live below the poverty line. Families with 1 or 2 children have the highest poverty rate of 3.5%, comprising of 27 families. On the other hand, families with 3 or 4 children have the lowest poverty rate of 0.0%, which includes 0 families.
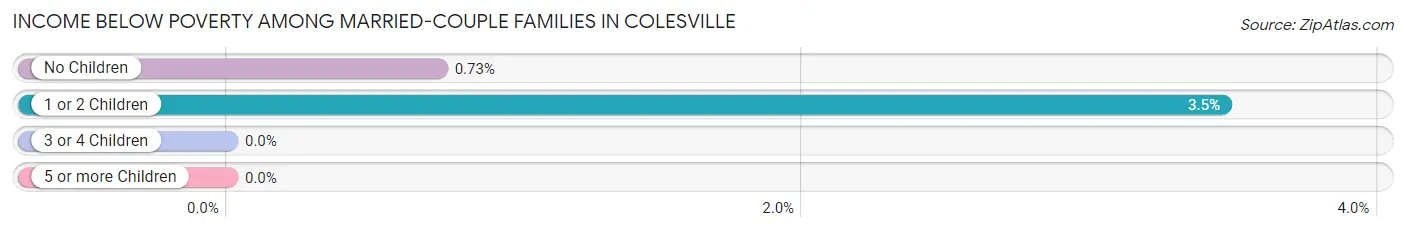
| Children | Above Poverty | Below Poverty |
| No Children | 1,913 (99.3%) | 14 (0.7%) |
| 1 or 2 Children | 754 (96.5%) | 27 (3.5%) |
| 3 or 4 Children | 68 (100.0%) | 0 (0.0%) |
| 5 or more Children | 62 (100.0%) | 0 (0.0%) |
| Total | 2,797 (98.6%) | 41 (1.4%) |
Income Below Poverty Among Single-Parent Households in Colesville
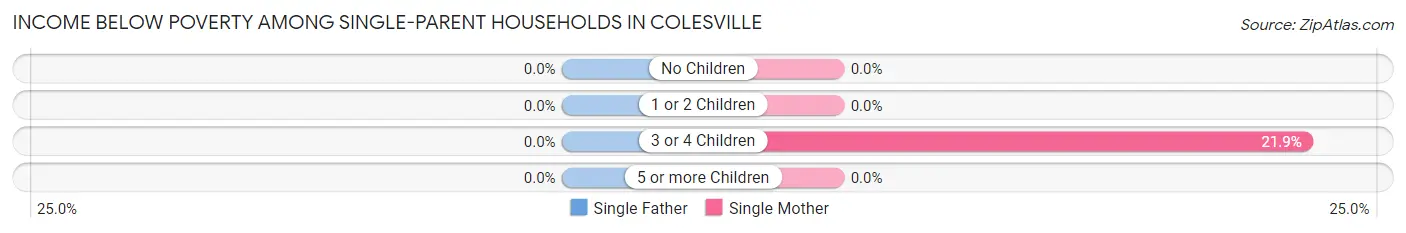
| Children | Single Father | Single Mother |
| No Children | 0 (0.0%) | 0 (0.0%) |
| 1 or 2 Children | 0 (0.0%) | 0 (0.0%) |
| 3 or 4 Children | 0 (0.0%) | 7 (21.9%) |
| 5 or more Children | 0 (0.0%) | 0 (0.0%) |
| Total | 0 (0.0%) | 7 (1.2%) |
Income Below Poverty Among Married-Couple vs Single-Parent Households in Colesville
The poverty data for Colesville shows that 41 of the married-couple family households (1.4%) and 7 of the single-parent households (0.8%) are living below the poverty level. Within the married-couple family households, those with 1 or 2 children have the highest poverty rate, with 27 households (3.5%) falling below the poverty line. Among the single-parent households, those with 3 or 4 children have the highest poverty rate, with 7 household (21.9%) living below poverty.
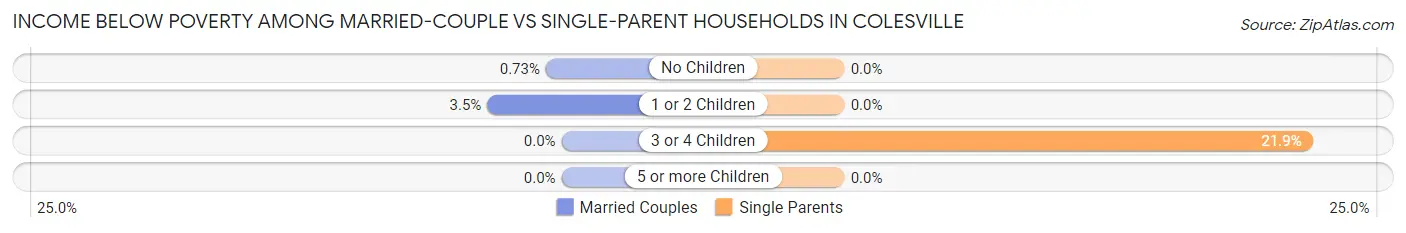
| Children | Married-Couple Families | Single-Parent Households |
| No Children | 14 (0.7%) | 0 (0.0%) |
| 1 or 2 Children | 27 (3.5%) | 0 (0.0%) |
| 3 or 4 Children | 0 (0.0%) | 7 (21.9%) |
| 5 or more Children | 0 (0.0%) | 0 (0.0%) |
| Total | 41 (1.4%) | 7 (0.8%) |
Employment Characteristics in Colesville
Employment by Class of Employer in Colesville
Among the 6,444 employed individuals in Colesville, private company employees (3,043 | 47.2%), not-for-profit organizations (1,130 | 17.5%), and federal government employees (870 | 13.5%) make up the most common classes of employment.
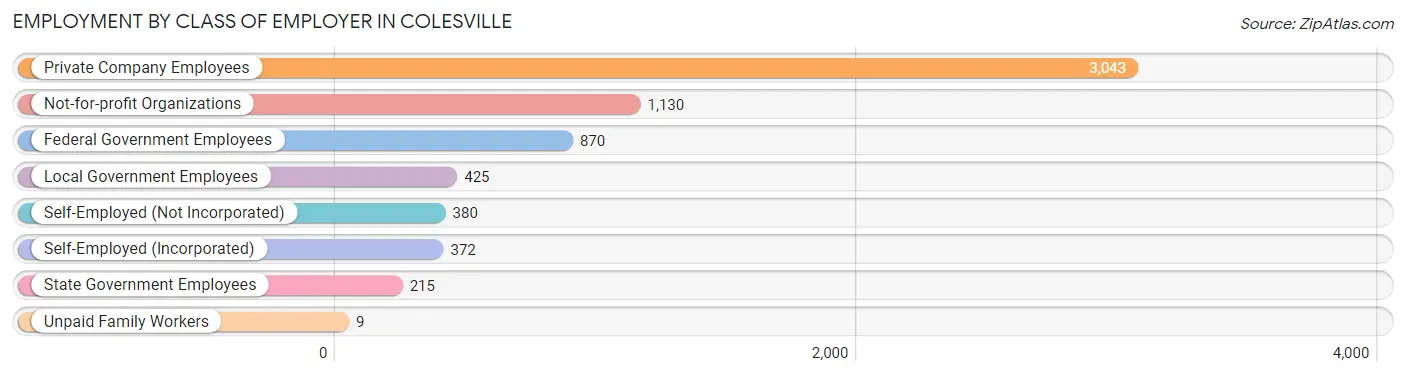
| Employer Class | # Employees | % Employees |
| Private Company Employees | 3,043 | 47.2% |
| Self-Employed (Incorporated) | 372 | 5.8% |
| Self-Employed (Not Incorporated) | 380 | 5.9% |
| Not-for-profit Organizations | 1,130 | 17.5% |
| Local Government Employees | 425 | 6.6% |
| State Government Employees | 215 | 3.3% |
| Federal Government Employees | 870 | 13.5% |
| Unpaid Family Workers | 9 | 0.1% |
| Total | 6,444 | 100.0% |
Employment Status by Age in Colesville
According to the labor force statistics for Colesville, out of the total population over 16 years of age (11,793), 59.7% or 7,040 individuals are in the labor force, with 3.7% or 260 of them unemployed. The age group with the highest labor force participation rate is 30 to 34 years, with 91.7% or 608 individuals in the labor force. Within the labor force, the 16 to 19 years age range has the highest percentage of unemployed individuals, with 18.5% or 41 of them being unemployed.
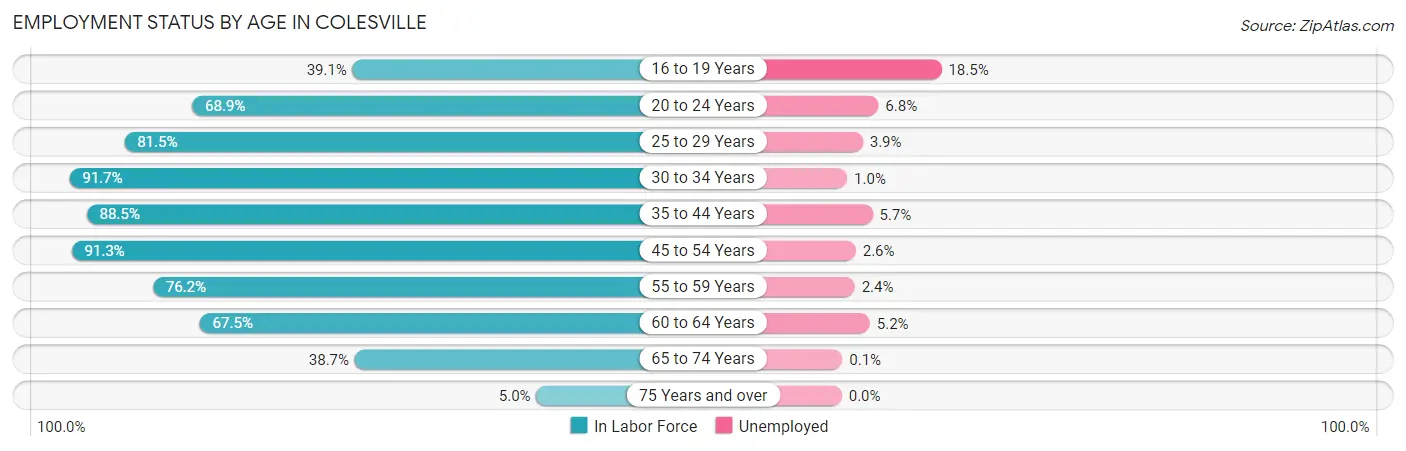
| Age Bracket | In Labor Force | Unemployed |
| 16 to 19 Years | 222 (39.1%) | 41 (18.5%) |
| 20 to 24 Years | 518 (68.9%) | 35 (6.8%) |
| 25 to 29 Years | 413 (81.5%) | 16 (3.9%) |
| 30 to 34 Years | 608 (91.7%) | 6 (1.0%) |
| 35 to 44 Years | 1,107 (88.5%) | 63 (5.7%) |
| 45 to 54 Years | 1,600 (91.3%) | 42 (2.6%) |
| 55 to 59 Years | 741 (76.2%) | 18 (2.4%) |
| 60 to 64 Years | 786 (67.5%) | 41 (5.2%) |
| 65 to 74 Years | 963 (38.7%) | 1 (0.1%) |
| 75 Years and over | 84 (5.0%) | 0 (0.0%) |
| Total | 7,040 (59.7%) | 260 (3.7%) |
Employment Status by Educational Attainment in Colesville
According to labor force statistics for Colesville, 83.3% of individuals (5,256) out of the total population between 25 and 64 years of age (6,310) are in the labor force, with 3.5% or 184 of them being unemployed. The group with the highest labor force participation rate are those with the educational attainment of bachelor's degree or higher, with 88.6% or 3,043 individuals in the labor force. Within the labor force, individuals with college / associate degree education have the highest percentage of unemployment, with 10.9% or 133 of them being unemployed.
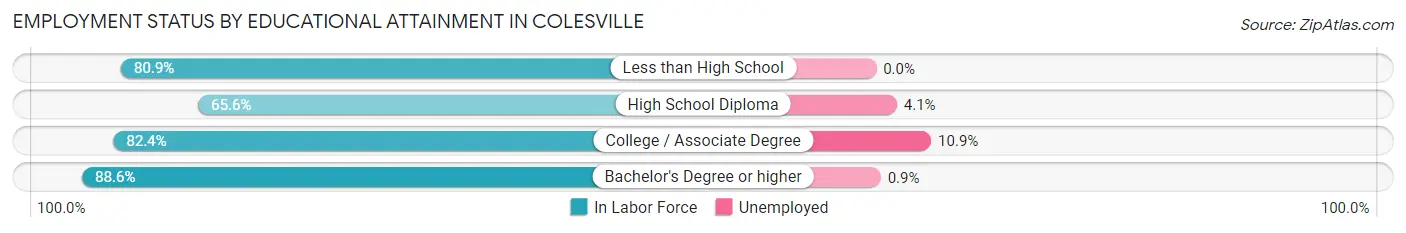
| Educational Attainment | In Labor Force | Unemployed |
| Less than High School | 407 (80.9%) | 0 (0.0%) |
| High School Diploma | 588 (65.6%) | 37 (4.1%) |
| College / Associate Degree | 1,216 (82.4%) | 161 (10.9%) |
| Bachelor's Degree or higher | 3,043 (88.6%) | 31 (0.9%) |
| Total | 5,256 (83.3%) | 221 (3.5%) |
Employment Occupations by Sex in Colesville
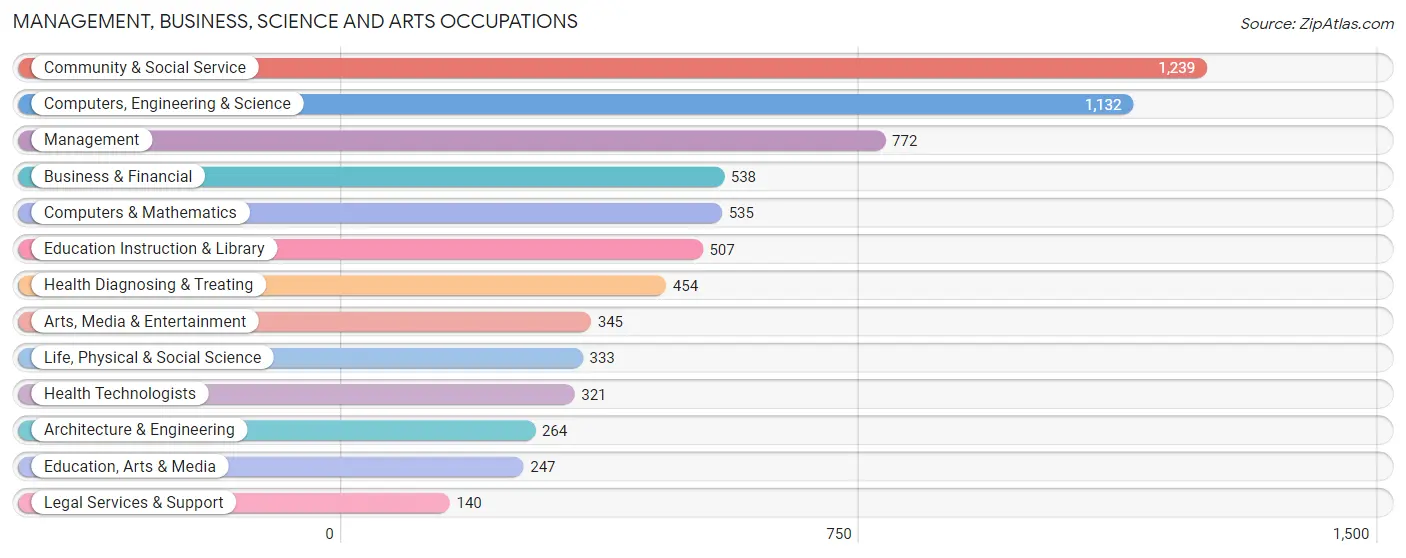
Management, Business, Science and Arts Occupations
The most common Management, Business, Science and Arts occupations in Colesville are Community & Social Service (1,239 | 18.3%), Computers, Engineering & Science (1,132 | 16.7%), Management (772 | 11.4%), Business & Financial (538 | 8.0%), and Computers & Mathematics (535 | 7.9%).
Management, Business, Science and Arts Occupations by Sex
Within the Management, Business, Science and Arts occupations in Colesville, the most male-oriented occupations are Architecture & Engineering (89.0%), Arts, Media & Entertainment (73.0%), and Computers & Mathematics (66.5%), while the most female-oriented occupations are Education Instruction & Library (81.3%), Legal Services & Support (70.7%), and Health Technologists (67.6%).
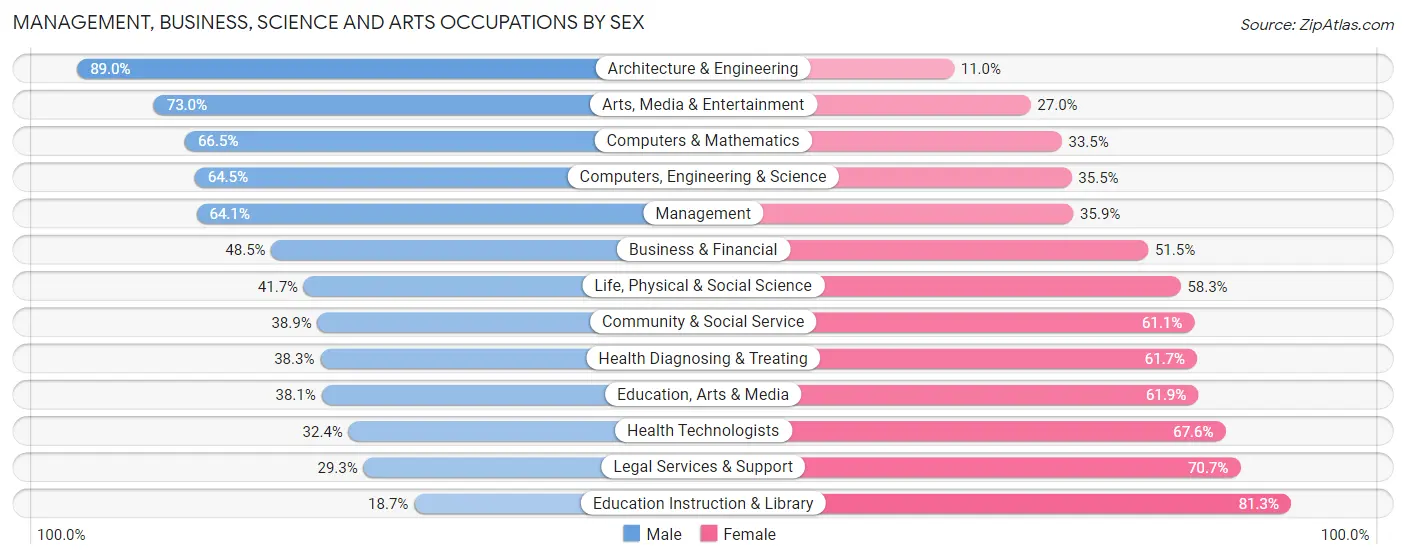
| Occupation | Male | Female |
| Management | 495 (64.1%) | 277 (35.9%) |
| Business & Financial | 261 (48.5%) | 277 (51.5%) |
| Computers, Engineering & Science | 730 (64.5%) | 402 (35.5%) |
| Computers & Mathematics | 356 (66.5%) | 179 (33.5%) |
| Architecture & Engineering | 235 (89.0%) | 29 (11.0%) |
| Life, Physical & Social Science | 139 (41.7%) | 194 (58.3%) |
| Community & Social Service | 482 (38.9%) | 757 (61.1%) |
| Education, Arts & Media | 94 (38.1%) | 153 (61.9%) |
| Legal Services & Support | 41 (29.3%) | 99 (70.7%) |
| Education Instruction & Library | 95 (18.7%) | 412 (81.3%) |
| Arts, Media & Entertainment | 252 (73.0%) | 93 (27.0%) |
| Health Diagnosing & Treating | 174 (38.3%) | 280 (61.7%) |
| Health Technologists | 104 (32.4%) | 217 (67.6%) |
| Total (Category) | 2,142 (51.8%) | 1,993 (48.2%) |
| Total (Overall) | 3,671 (54.2%) | 3,100 (45.8%) |
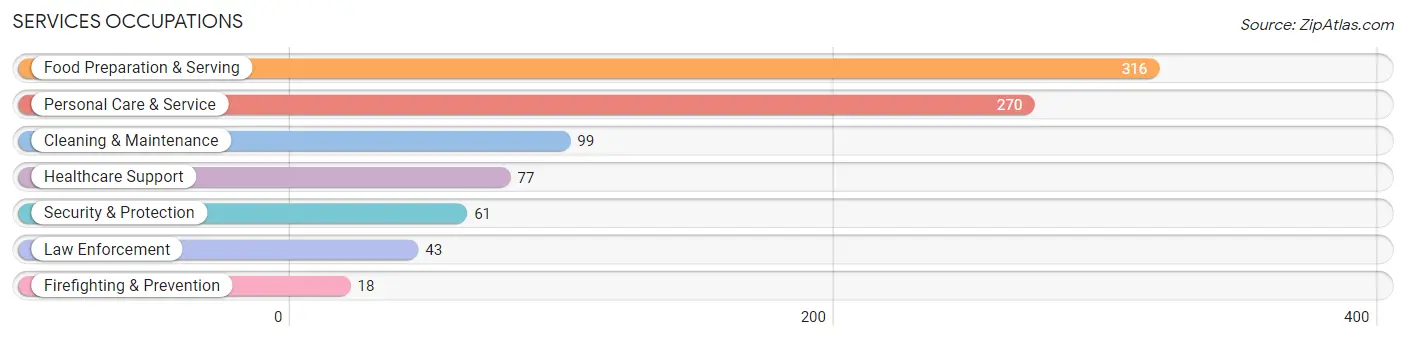
Services Occupations
The most common Services occupations in Colesville are Food Preparation & Serving (316 | 4.7%), Personal Care & Service (270 | 4.0%), Cleaning & Maintenance (99 | 1.5%), Healthcare Support (77 | 1.1%), and Security & Protection (61 | 0.9%).
Services Occupations by Sex
Within the Services occupations in Colesville, the most male-oriented occupations are Security & Protection (100.0%), Firefighting & Prevention (100.0%), and Law Enforcement (100.0%), while the most female-oriented occupations are Personal Care & Service (92.2%), Healthcare Support (63.6%), and Food Preparation & Serving (58.5%).
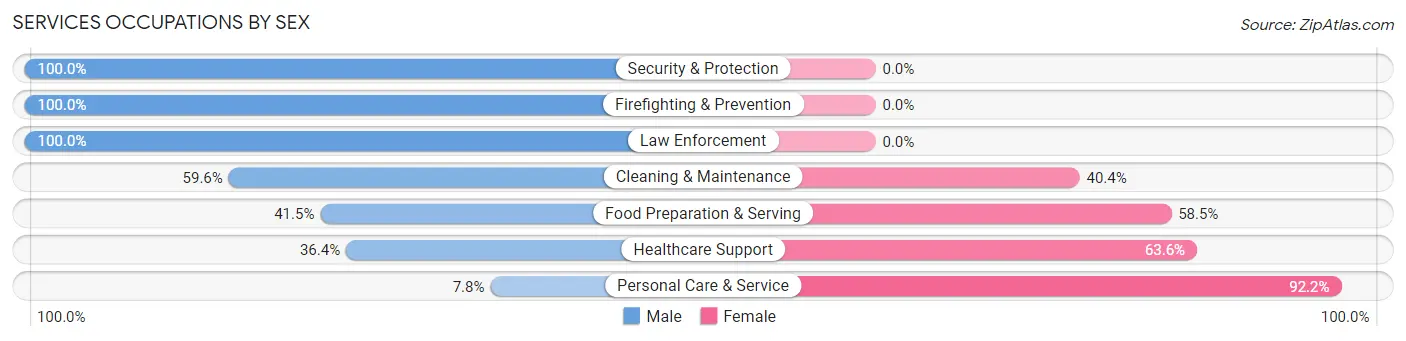
| Occupation | Male | Female |
| Healthcare Support | 28 (36.4%) | 49 (63.6%) |
| Security & Protection | 61 (100.0%) | 0 (0.0%) |
| Firefighting & Prevention | 18 (100.0%) | 0 (0.0%) |
| Law Enforcement | 43 (100.0%) | 0 (0.0%) |
| Food Preparation & Serving | 131 (41.5%) | 185 (58.5%) |
| Cleaning & Maintenance | 59 (59.6%) | 40 (40.4%) |
| Personal Care & Service | 21 (7.8%) | 249 (92.2%) |
| Total (Category) | 300 (36.4%) | 523 (63.5%) |
| Total (Overall) | 3,671 (54.2%) | 3,100 (45.8%) |
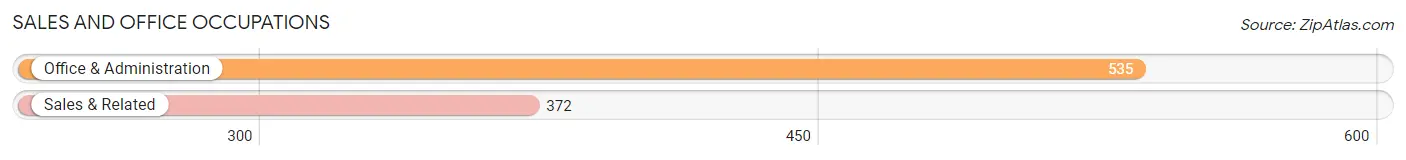
Sales and Office Occupations
The most common Sales and Office occupations in Colesville are Office & Administration (535 | 7.9%), and Sales & Related (372 | 5.5%).
Sales and Office Occupations by Sex
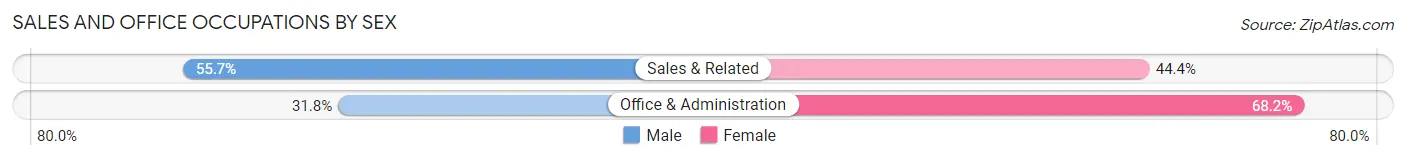
| Occupation | Male | Female |
| Sales & Related | 207 (55.6%) | 165 (44.4%) |
| Office & Administration | 170 (31.8%) | 365 (68.2%) |
| Total (Category) | 377 (41.6%) | 530 (58.4%) |
| Total (Overall) | 3,671 (54.2%) | 3,100 (45.8%) |
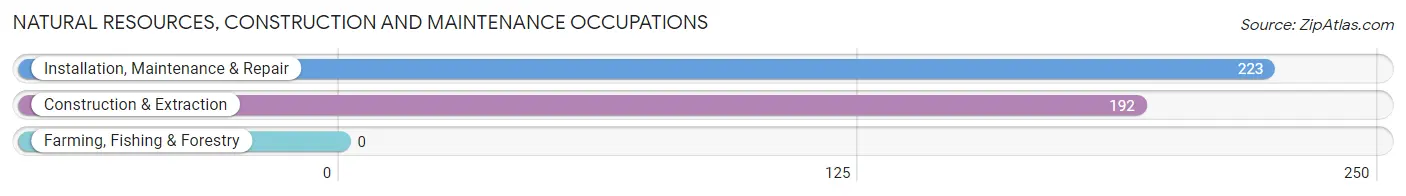
Natural Resources, Construction and Maintenance Occupations
The most common Natural Resources, Construction and Maintenance occupations in Colesville are Installation, Maintenance & Repair (223 | 3.3%), and Construction & Extraction (192 | 2.8%).
Natural Resources, Construction and Maintenance Occupations by Sex
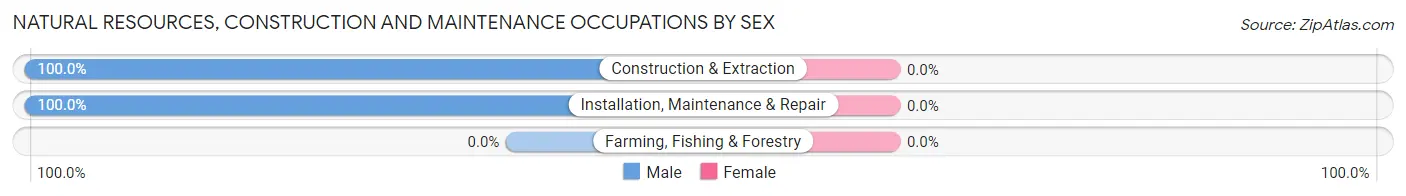
| Occupation | Male | Female |
| Farming, Fishing & Forestry | 0 (0.0%) | 0 (0.0%) |
| Construction & Extraction | 192 (100.0%) | 0 (0.0%) |
| Installation, Maintenance & Repair | 223 (100.0%) | 0 (0.0%) |
| Total (Category) | 415 (100.0%) | 0 (0.0%) |
| Total (Overall) | 3,671 (54.2%) | 3,100 (45.8%) |
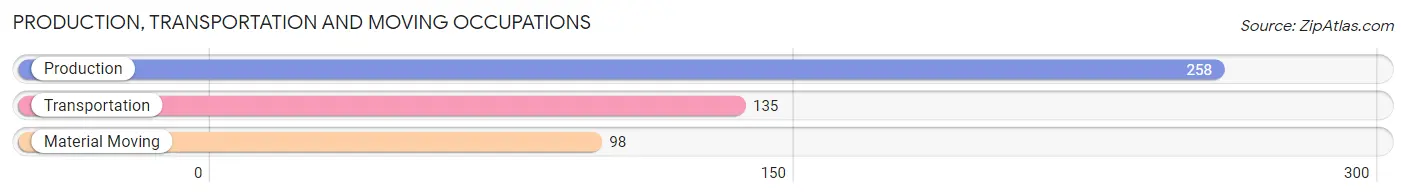
Production, Transportation and Moving Occupations
The most common Production, Transportation and Moving occupations in Colesville are Production (258 | 3.8%), Transportation (135 | 2.0%), and Material Moving (98 | 1.5%).
Production, Transportation and Moving Occupations by Sex
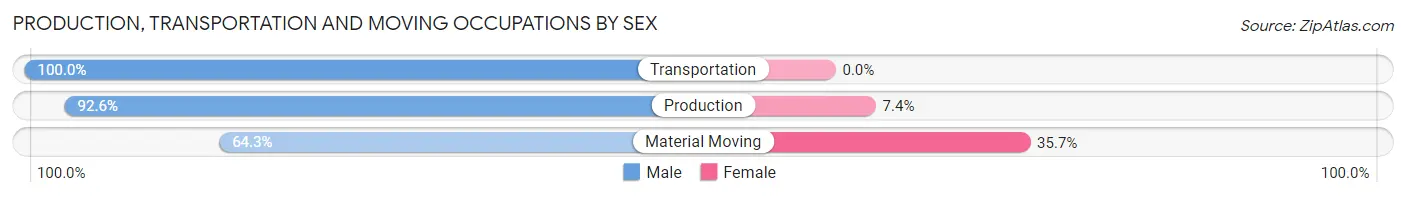
| Occupation | Male | Female |
| Production | 239 (92.6%) | 19 (7.4%) |
| Transportation | 135 (100.0%) | 0 (0.0%) |
| Material Moving | 63 (64.3%) | 35 (35.7%) |
| Total (Category) | 437 (89.0%) | 54 (11.0%) |
| Total (Overall) | 3,671 (54.2%) | 3,100 (45.8%) |
Employment Industries by Sex in Colesville
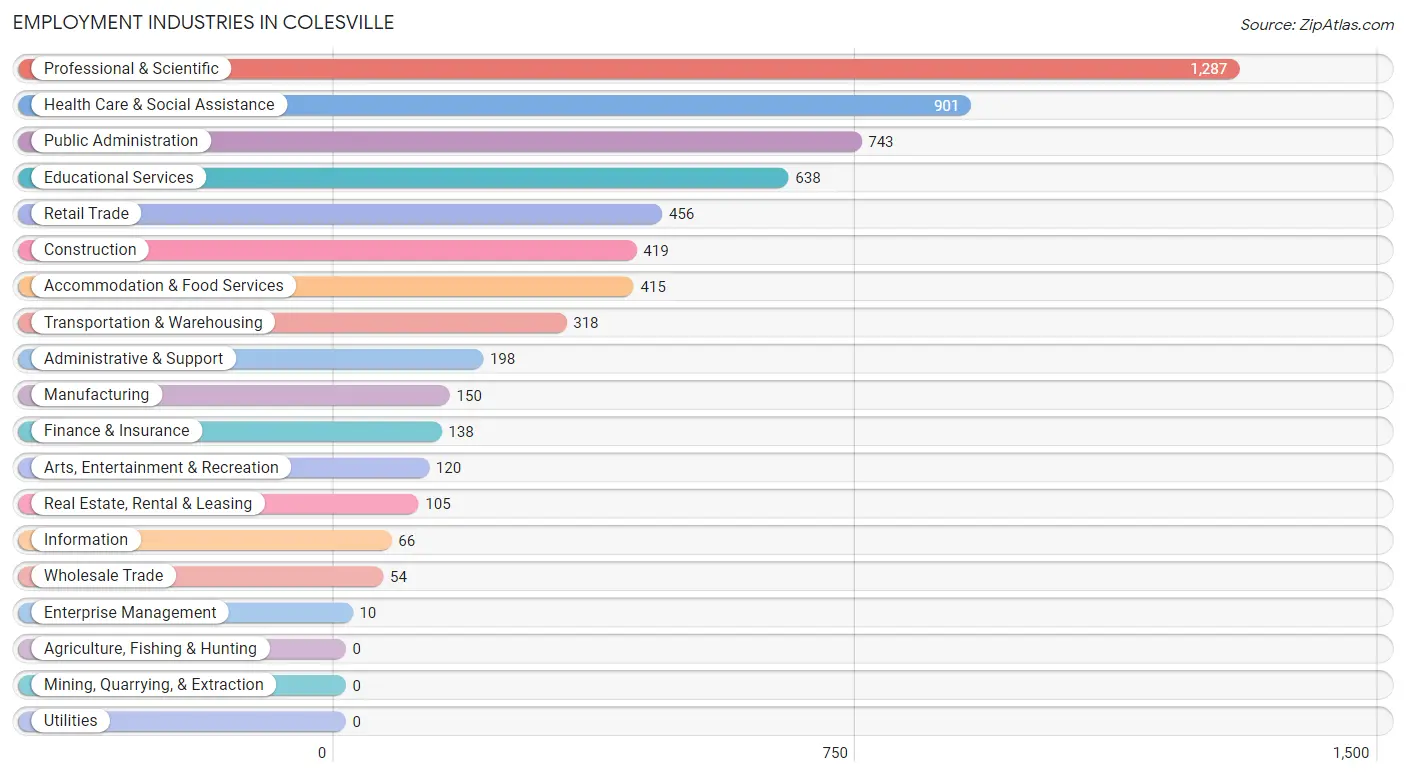
Employment Industries in Colesville
The major employment industries in Colesville include Professional & Scientific (1,287 | 19.0%), Health Care & Social Assistance (901 | 13.3%), Public Administration (743 | 11.0%), Educational Services (638 | 9.4%), and Retail Trade (456 | 6.7%).
Employment Industries by Sex in Colesville
The Colesville industries that see more men than women are Wholesale Trade (100.0%), Transportation & Warehousing (100.0%), and Construction (92.4%), whereas the industries that tend to have a higher number of women are Finance & Insurance (93.5%), Information (90.9%), and Health Care & Social Assistance (68.5%).
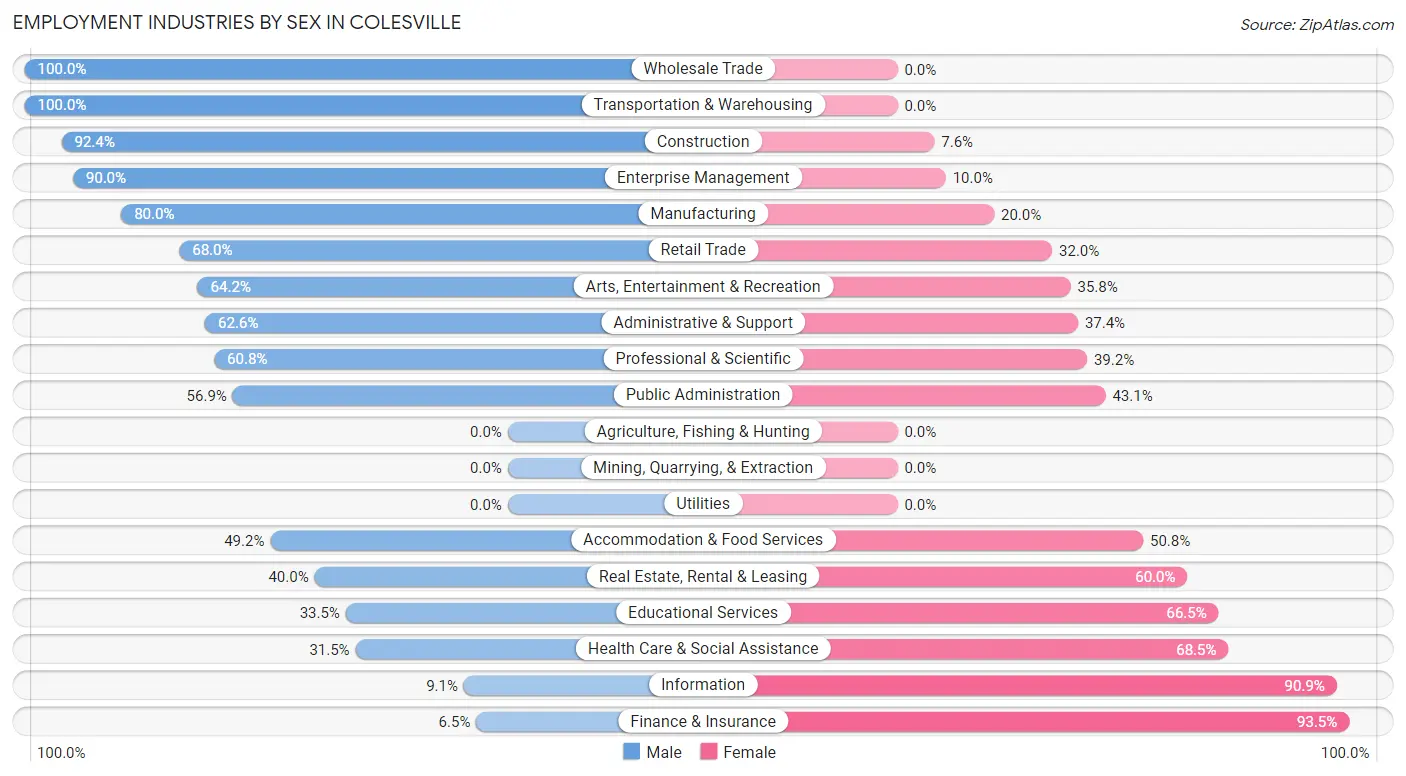
| Industry | Male | Female |
| Agriculture, Fishing & Hunting | 0 (0.0%) | 0 (0.0%) |
| Mining, Quarrying, & Extraction | 0 (0.0%) | 0 (0.0%) |
| Construction | 387 (92.4%) | 32 (7.6%) |
| Manufacturing | 120 (80.0%) | 30 (20.0%) |
| Wholesale Trade | 54 (100.0%) | 0 (0.0%) |
| Retail Trade | 310 (68.0%) | 146 (32.0%) |
| Transportation & Warehousing | 318 (100.0%) | 0 (0.0%) |
| Utilities | 0 (0.0%) | 0 (0.0%) |
| Information | 6 (9.1%) | 60 (90.9%) |
| Finance & Insurance | 9 (6.5%) | 129 (93.5%) |
| Real Estate, Rental & Leasing | 42 (40.0%) | 63 (60.0%) |
| Professional & Scientific | 782 (60.8%) | 505 (39.2%) |
| Enterprise Management | 9 (90.0%) | 1 (10.0%) |
| Administrative & Support | 124 (62.6%) | 74 (37.4%) |
| Educational Services | 214 (33.5%) | 424 (66.5%) |
| Health Care & Social Assistance | 284 (31.5%) | 617 (68.5%) |
| Arts, Entertainment & Recreation | 77 (64.2%) | 43 (35.8%) |
| Accommodation & Food Services | 204 (49.2%) | 211 (50.8%) |
| Public Administration | 423 (56.9%) | 320 (43.1%) |
| Total | 3,671 (54.2%) | 3,100 (45.8%) |
Education in Colesville
School Enrollment in Colesville
The most common levels of schooling among the 2,633 students in Colesville are high school (614 | 23.3%), middle school (613 | 23.3%), and college / undergraduate (493 | 18.7%).
| School Level | # Students | % Students |
| Nursery / Preschool | 214 | 8.1% |
| Kindergarten | 81 | 3.1% |
| Elementary School | 430 | 16.3% |
| Middle School | 613 | 23.3% |
| High School | 614 | 23.3% |
| College / Undergraduate | 493 | 18.7% |
| Graduate / Professional | 188 | 7.1% |
| Total | 2,633 | 100.0% |
School Enrollment by Age by Funding Source in Colesville
Out of a total of 2,633 students who are enrolled in schools in Colesville, 629 (23.9%) attend a private institution, while the remaining 2,004 (76.1%) are enrolled in public schools. The age group of 3 to 4 year olds has the highest likelihood of being enrolled in private schools, with 71 (61.2% in the age bracket) enrolled. Conversely, the age group of 18 to 19 year olds has the lowest likelihood of being enrolled in a private school, with 134 (100.0% in the age bracket) attending a public institution.
| Age Bracket | Public School | Private School |
| 3 to 4 Year Olds | 45 (38.8%) | 71 (61.2%) |
| 5 to 9 Year Old | 322 (57.7%) | 236 (42.3%) |
| 10 to 14 Year Olds | 693 (93.3%) | 50 (6.7%) |
| 15 to 17 Year Olds | 384 (76.2%) | 120 (23.8%) |
| 18 to 19 Year Olds | 134 (100.0%) | 0 (0.0%) |
| 20 to 24 Year Olds | 186 (59.6%) | 126 (40.4%) |
| 25 to 34 Year Olds | 93 (92.1%) | 8 (7.9%) |
| 35 Years and over | 146 (88.5%) | 19 (11.5%) |
| Total | 2,004 (76.1%) | 629 (23.9%) |
Educational Attainment by Field of Study in Colesville
Business (1,215 | 19.2%), social sciences (804 | 12.7%), education (594 | 9.4%), computers & mathematics (554 | 8.8%), and bio, nature & agricultural (463 | 7.3%) are the most common fields of study among 6,314 individuals in Colesville who have obtained a bachelor's degree or higher.
| Field of Study | # Graduates | % Graduates |
| Computers & Mathematics | 554 | 8.8% |
| Bio, Nature & Agricultural | 463 | 7.3% |
| Physical & Health Sciences | 376 | 6.0% |
| Psychology | 201 | 3.2% |
| Social Sciences | 804 | 12.7% |
| Engineering | 404 | 6.4% |
| Multidisciplinary Studies | 38 | 0.6% |
| Science & Technology | 439 | 7.0% |
| Business | 1,215 | 19.2% |
| Education | 594 | 9.4% |
| Literature & Languages | 250 | 4.0% |
| Liberal Arts & History | 373 | 5.9% |
| Visual & Performing Arts | 282 | 4.5% |
| Communications | 146 | 2.3% |
| Arts & Humanities | 175 | 2.8% |
| Total | 6,314 | 100.0% |
Transportation & Commute in Colesville
Vehicle Availability by Sex in Colesville
The most prevalent vehicle ownership categories in Colesville are males with 2 vehicles (1,542, accounting for 44.1%) and females with 2 vehicles (1,333, making up 52.4%).
| Vehicles Available | Male | Female |
| No Vehicle | 7 (0.2%) | 0 (0.0%) |
| 1 Vehicle | 286 (8.2%) | 327 (11.1%) |
| 2 Vehicles | 1,542 (44.1%) | 1,333 (45.3%) |
| 3 Vehicles | 868 (24.8%) | 584 (19.8%) |
| 4 Vehicles | 354 (10.1%) | 391 (13.3%) |
| 5 or more Vehicles | 441 (12.6%) | 310 (10.5%) |
| Total | 3,498 (100.0%) | 2,945 (100.0%) |
Commute Time in Colesville
The most frequently occuring commute durations in Colesville are 30 to 34 minutes (765 commuters, 16.4%), 45 to 59 minutes (675 commuters, 14.5%), and 60 to 89 minutes (579 commuters, 12.4%).
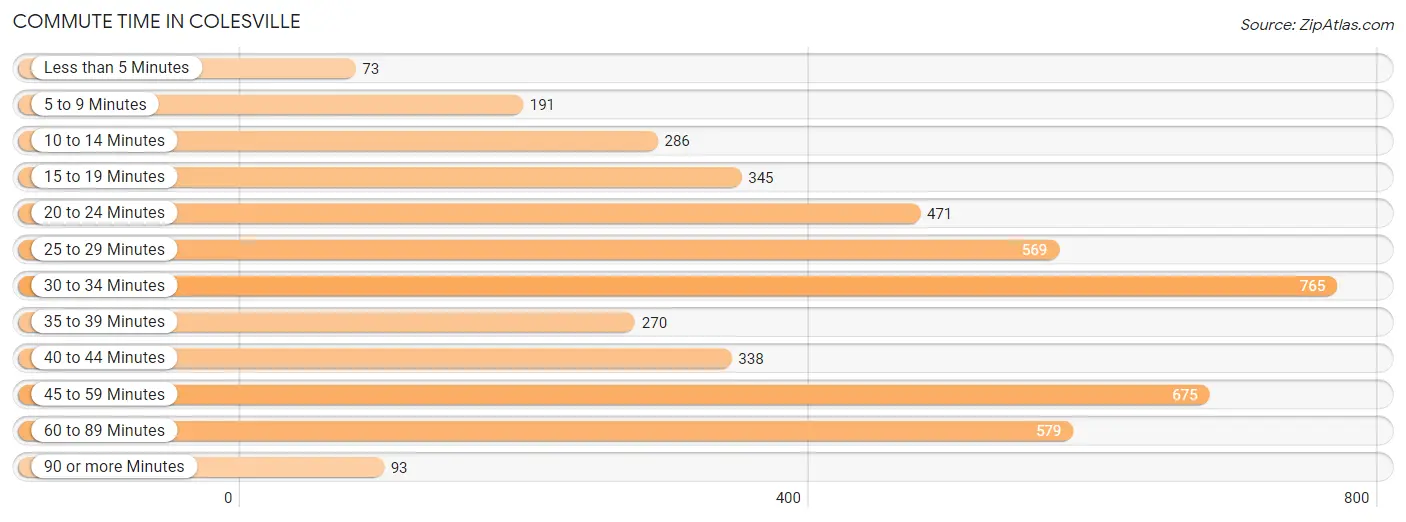
| Commute Time | # Commuters | % Commuters |
| Less than 5 Minutes | 73 | 1.6% |
| 5 to 9 Minutes | 191 | 4.1% |
| 10 to 14 Minutes | 286 | 6.1% |
| 15 to 19 Minutes | 345 | 7.4% |
| 20 to 24 Minutes | 471 | 10.1% |
| 25 to 29 Minutes | 569 | 12.2% |
| 30 to 34 Minutes | 765 | 16.4% |
| 35 to 39 Minutes | 270 | 5.8% |
| 40 to 44 Minutes | 338 | 7.3% |
| 45 to 59 Minutes | 675 | 14.5% |
| 60 to 89 Minutes | 579 | 12.4% |
| 90 or more Minutes | 93 | 2.0% |
Commute Time by Sex in Colesville
The most common commute times in Colesville are 30 to 34 minutes (506 commuters, 19.9%) for males and 25 to 29 minutes (306 commuters, 14.5%) for females.
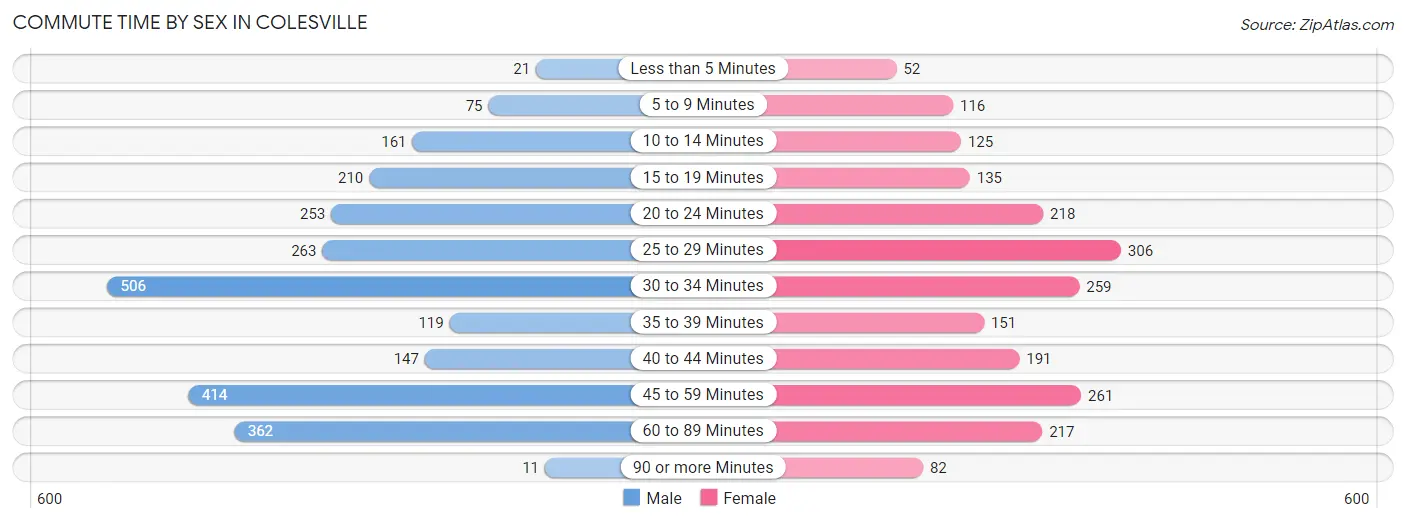
| Commute Time | Male | Female |
| Less than 5 Minutes | 21 (0.8%) | 52 (2.5%) |
| 5 to 9 Minutes | 75 (2.9%) | 116 (5.5%) |
| 10 to 14 Minutes | 161 (6.3%) | 125 (5.9%) |
| 15 to 19 Minutes | 210 (8.3%) | 135 (6.4%) |
| 20 to 24 Minutes | 253 (10.0%) | 218 (10.3%) |
| 25 to 29 Minutes | 263 (10.3%) | 306 (14.5%) |
| 30 to 34 Minutes | 506 (19.9%) | 259 (12.3%) |
| 35 to 39 Minutes | 119 (4.7%) | 151 (7.1%) |
| 40 to 44 Minutes | 147 (5.8%) | 191 (9.0%) |
| 45 to 59 Minutes | 414 (16.3%) | 261 (12.3%) |
| 60 to 89 Minutes | 362 (14.2%) | 217 (10.3%) |
| 90 or more Minutes | 11 (0.4%) | 82 (3.9%) |
Time of Departure to Work by Sex in Colesville
The most frequent times of departure to work in Colesville are 6:00 AM to 6:29 AM (586, 23.1%) for males and 8:00 AM to 8:29 AM (510, 24.1%) for females.
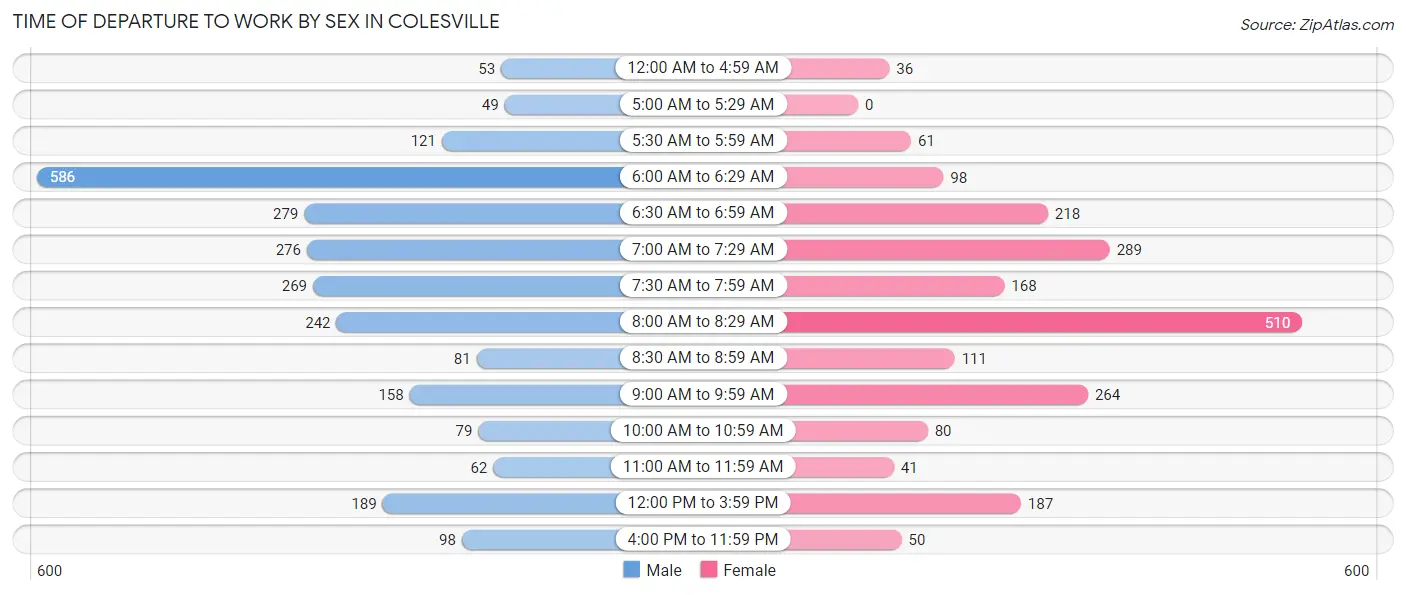
| Time of Departure | Male | Female |
| 12:00 AM to 4:59 AM | 53 (2.1%) | 36 (1.7%) |
| 5:00 AM to 5:29 AM | 49 (1.9%) | 0 (0.0%) |
| 5:30 AM to 5:59 AM | 121 (4.8%) | 61 (2.9%) |
| 6:00 AM to 6:29 AM | 586 (23.1%) | 98 (4.6%) |
| 6:30 AM to 6:59 AM | 279 (11.0%) | 218 (10.3%) |
| 7:00 AM to 7:29 AM | 276 (10.9%) | 289 (13.7%) |
| 7:30 AM to 7:59 AM | 269 (10.6%) | 168 (8.0%) |
| 8:00 AM to 8:29 AM | 242 (9.5%) | 510 (24.1%) |
| 8:30 AM to 8:59 AM | 81 (3.2%) | 111 (5.2%) |
| 9:00 AM to 9:59 AM | 158 (6.2%) | 264 (12.5%) |
| 10:00 AM to 10:59 AM | 79 (3.1%) | 80 (3.8%) |
| 11:00 AM to 11:59 AM | 62 (2.4%) | 41 (1.9%) |
| 12:00 PM to 3:59 PM | 189 (7.4%) | 187 (8.8%) |
| 4:00 PM to 11:59 PM | 98 (3.9%) | 50 (2.4%) |
| Total | 2,542 (100.0%) | 2,113 (100.0%) |
Housing Occupancy in Colesville
Occupancy by Ownership in Colesville
Of the total 4,969 dwellings in Colesville, owner-occupied units account for 4,307 (86.7%), while renter-occupied units make up 662 (13.3%).
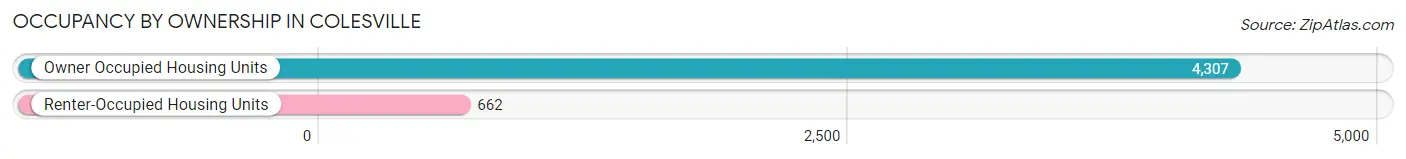
| Occupancy | # Housing Units | % Housing Units |
| Owner Occupied Housing Units | 4,307 | 86.7% |
| Renter-Occupied Housing Units | 662 | 13.3% |
| Total Occupied Housing Units | 4,969 | 100.0% |
Occupancy by Household Size in Colesville
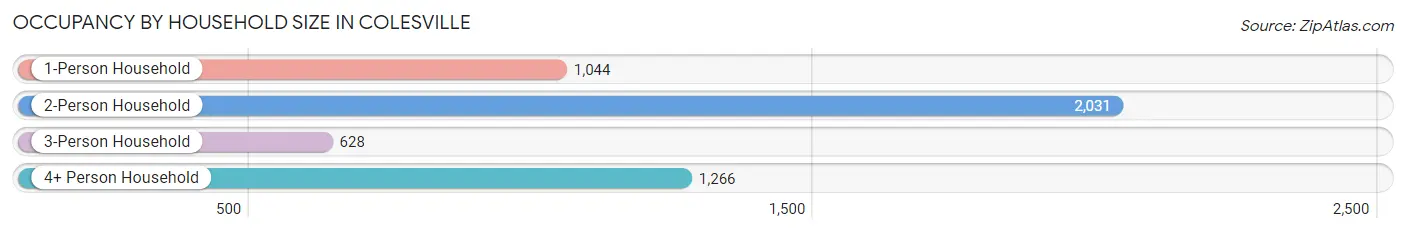
| Household Size | # Housing Units | % Housing Units |
| 1-Person Household | 1,044 | 21.0% |
| 2-Person Household | 2,031 | 40.9% |
| 3-Person Household | 628 | 12.6% |
| 4+ Person Household | 1,266 | 25.5% |
| Total Housing Units | 4,969 | 100.0% |
Occupancy by Ownership by Household Size in Colesville
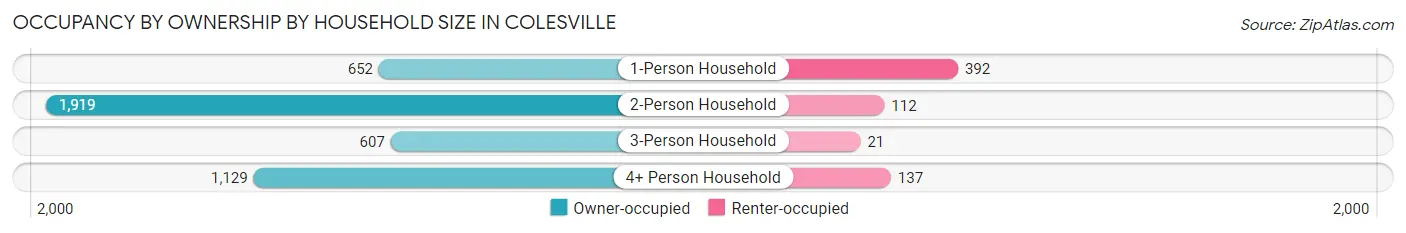
| Household Size | Owner-occupied | Renter-occupied |
| 1-Person Household | 652 (62.5%) | 392 (37.6%) |
| 2-Person Household | 1,919 (94.5%) | 112 (5.5%) |
| 3-Person Household | 607 (96.7%) | 21 (3.3%) |
| 4+ Person Household | 1,129 (89.2%) | 137 (10.8%) |
| Total Housing Units | 4,307 (86.7%) | 662 (13.3%) |
Occupancy by Educational Attainment in Colesville
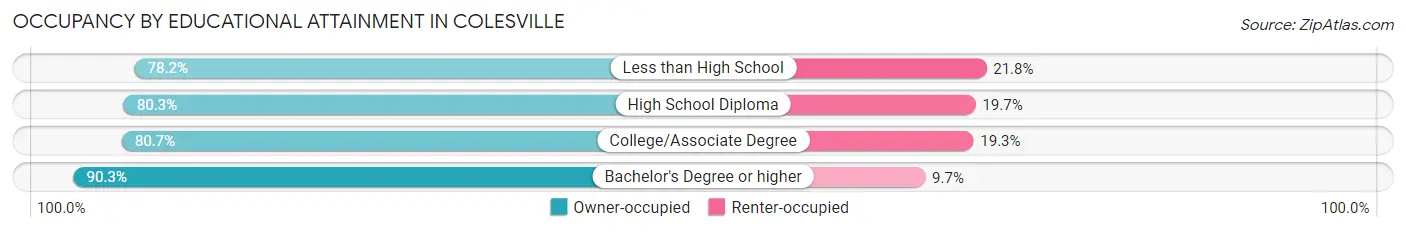
| Household Size | Owner-occupied | Renter-occupied |
| Less than High School | 265 (78.2%) | 74 (21.8%) |
| High School Diploma | 526 (80.3%) | 129 (19.7%) |
| College/Associate Degree | 616 (80.7%) | 147 (19.3%) |
| Bachelor's Degree or higher | 2,900 (90.3%) | 312 (9.7%) |
Occupancy by Age of Householder in Colesville
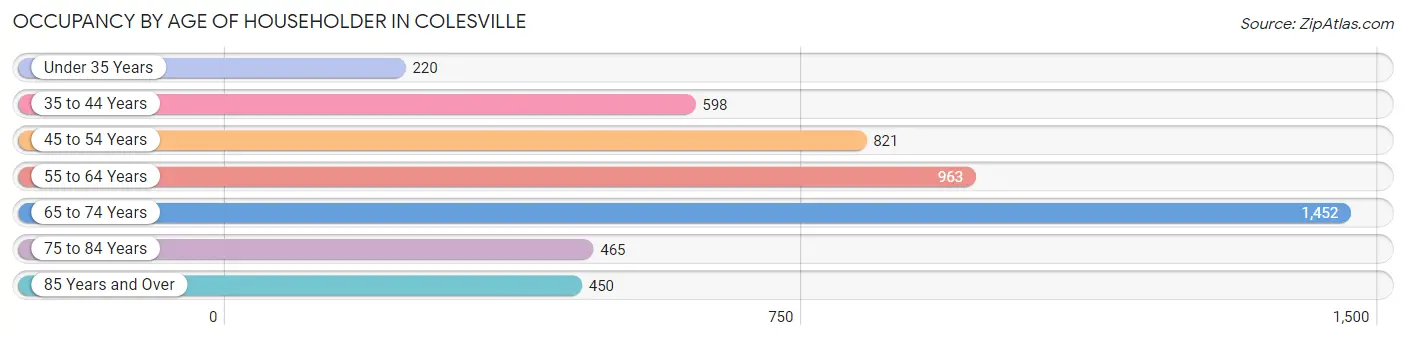
| Age Bracket | # Households | % Households |
| Under 35 Years | 220 | 4.4% |
| 35 to 44 Years | 598 | 12.0% |
| 45 to 54 Years | 821 | 16.5% |
| 55 to 64 Years | 963 | 19.4% |
| 65 to 74 Years | 1,452 | 29.2% |
| 75 to 84 Years | 465 | 9.4% |
| 85 Years and Over | 450 | 9.1% |
| Total | 4,969 | 100.0% |
Housing Finances in Colesville
Median Income by Occupancy in Colesville
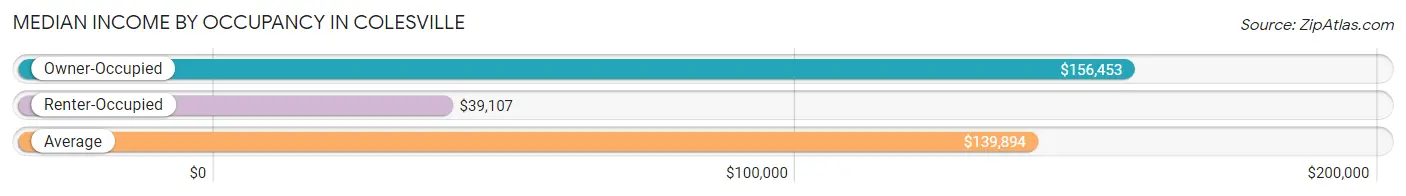
| Occupancy Type | # Households | Median Income |
| Owner-Occupied | 4,307 (86.7%) | $156,453 |
| Renter-Occupied | 662 (13.3%) | $39,107 |
| Average | 4,969 (100.0%) | $139,894 |
Occupancy by Householder Income Bracket in Colesville
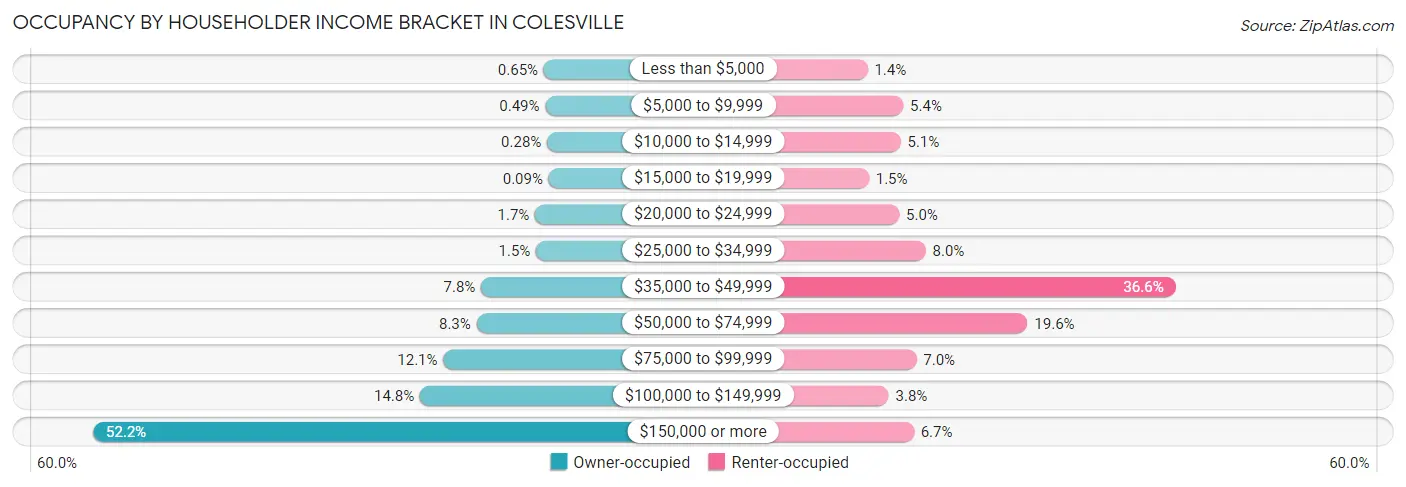
| Income Bracket | Owner-occupied | Renter-occupied |
| Less than $5,000 | 28 (0.6%) | 9 (1.4%) |
| $5,000 to $9,999 | 21 (0.5%) | 36 (5.4%) |
| $10,000 to $14,999 | 12 (0.3%) | 34 (5.1%) |
| $15,000 to $19,999 | 4 (0.1%) | 10 (1.5%) |
| $20,000 to $24,999 | 71 (1.7%) | 33 (5.0%) |
| $25,000 to $34,999 | 66 (1.5%) | 53 (8.0%) |
| $35,000 to $49,999 | 337 (7.8%) | 242 (36.6%) |
| $50,000 to $74,999 | 359 (8.3%) | 130 (19.6%) |
| $75,000 to $99,999 | 523 (12.1%) | 46 (7.0%) |
| $100,000 to $149,999 | 638 (14.8%) | 25 (3.8%) |
| $150,000 or more | 2,248 (52.2%) | 44 (6.7%) |
| Total | 4,307 (100.0%) | 662 (100.0%) |
Monthly Housing Cost Tiers in Colesville
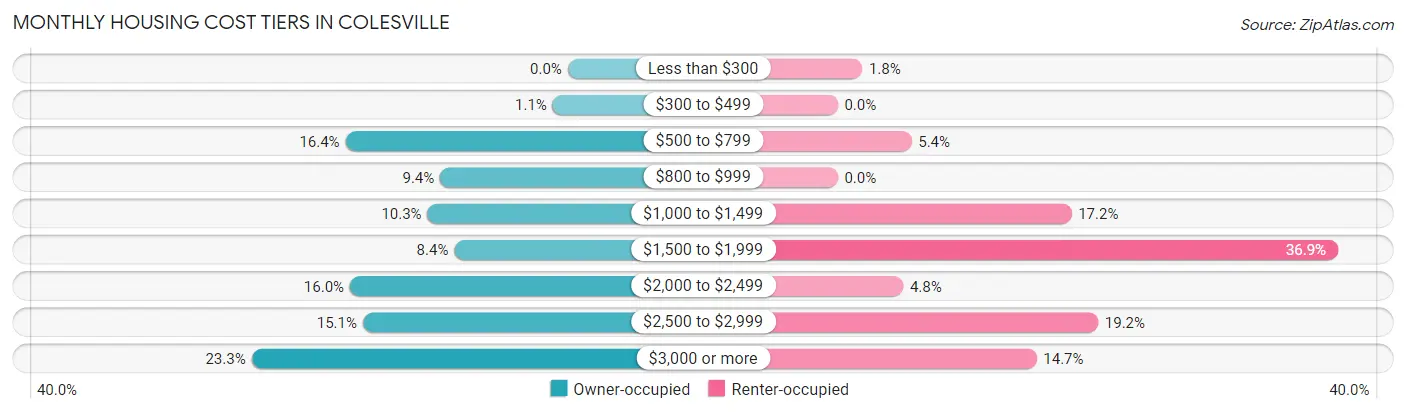
| Monthly Cost | Owner-occupied | Renter-occupied |
| Less than $300 | 0 (0.0%) | 12 (1.8%) |
| $300 to $499 | 48 (1.1%) | 0 (0.0%) |
| $500 to $799 | 705 (16.4%) | 36 (5.4%) |
| $800 to $999 | 405 (9.4%) | 0 (0.0%) |
| $1,000 to $1,499 | 445 (10.3%) | 114 (17.2%) |
| $1,500 to $1,999 | 360 (8.4%) | 244 (36.9%) |
| $2,000 to $2,499 | 691 (16.0%) | 32 (4.8%) |
| $2,500 to $2,999 | 650 (15.1%) | 127 (19.2%) |
| $3,000 or more | 1,003 (23.3%) | 97 (14.6%) |
| Total | 4,307 (100.0%) | 662 (100.0%) |
Physical Housing Characteristics in Colesville
Housing Structures in Colesville
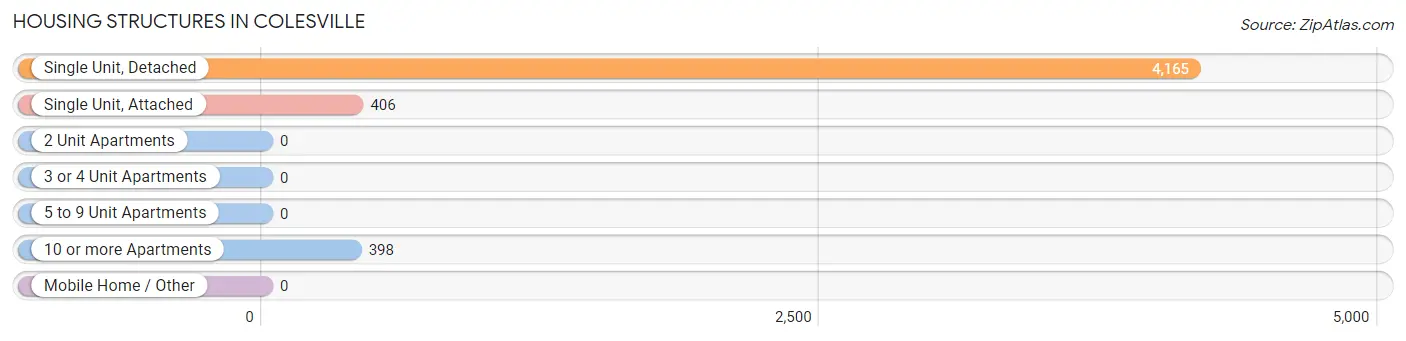
| Structure Type | # Housing Units | % Housing Units |
| Single Unit, Detached | 4,165 | 83.8% |
| Single Unit, Attached | 406 | 8.2% |
| 2 Unit Apartments | 0 | 0.0% |
| 3 or 4 Unit Apartments | 0 | 0.0% |
| 5 to 9 Unit Apartments | 0 | 0.0% |
| 10 or more Apartments | 398 | 8.0% |
| Mobile Home / Other | 0 | 0.0% |
| Total | 4,969 | 100.0% |
Housing Structures by Occupancy in Colesville
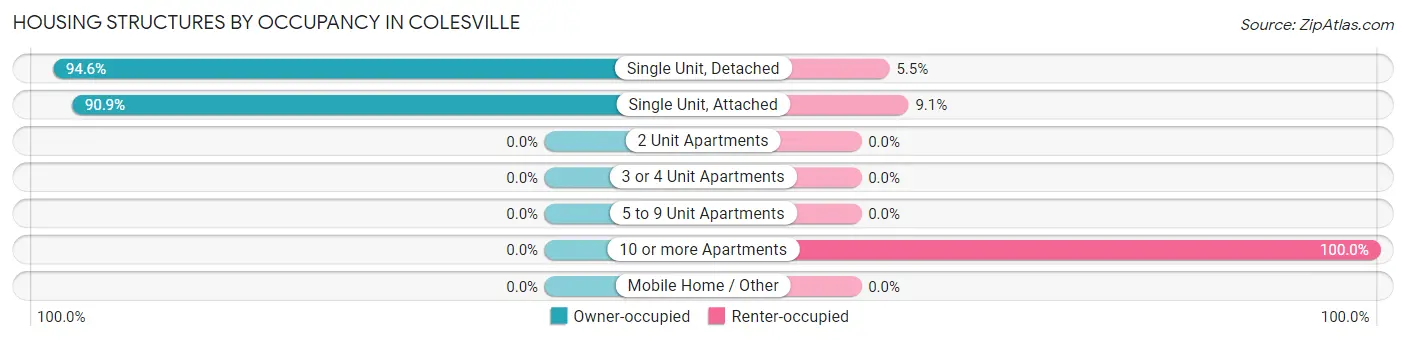
| Structure Type | Owner-occupied | Renter-occupied |
| Single Unit, Detached | 3,938 (94.6%) | 227 (5.4%) |
| Single Unit, Attached | 369 (90.9%) | 37 (9.1%) |
| 2 Unit Apartments | 0 (0.0%) | 0 (0.0%) |
| 3 or 4 Unit Apartments | 0 (0.0%) | 0 (0.0%) |
| 5 to 9 Unit Apartments | 0 (0.0%) | 0 (0.0%) |
| 10 or more Apartments | 0 (0.0%) | 398 (100.0%) |
| Mobile Home / Other | 0 (0.0%) | 0 (0.0%) |
| Total | 4,307 (86.7%) | 662 (13.3%) |
Housing Structures by Number of Rooms in Colesville
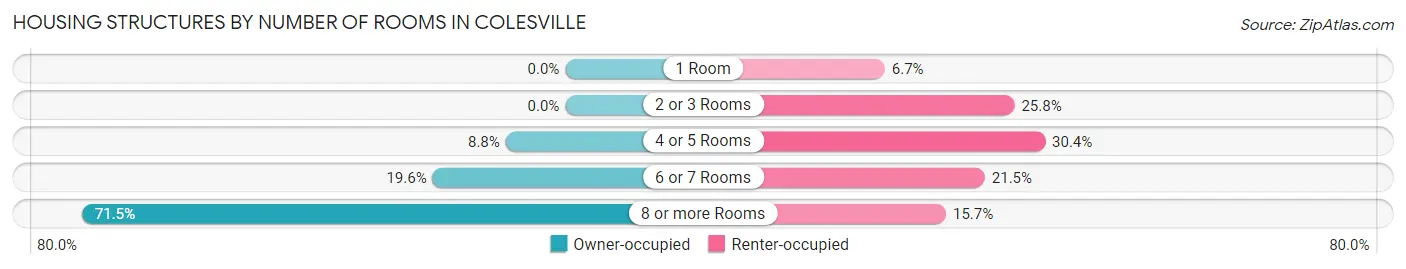
| Number of Rooms | Owner-occupied | Renter-occupied |
| 1 Room | 0 (0.0%) | 44 (6.7%) |
| 2 or 3 Rooms | 0 (0.0%) | 171 (25.8%) |
| 4 or 5 Rooms | 380 (8.8%) | 201 (30.4%) |
| 6 or 7 Rooms | 846 (19.6%) | 142 (21.4%) |
| 8 or more Rooms | 3,081 (71.5%) | 104 (15.7%) |
| Total | 4,307 (100.0%) | 662 (100.0%) |
Housing Structure by Heating Type in Colesville
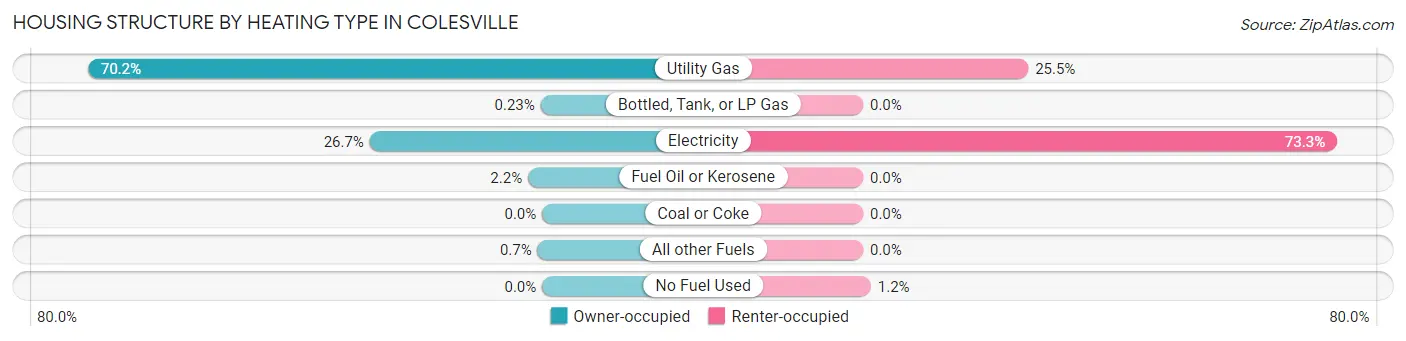
| Heating Type | Owner-occupied | Renter-occupied |
| Utility Gas | 3,025 (70.2%) | 169 (25.5%) |
| Bottled, Tank, or LP Gas | 10 (0.2%) | 0 (0.0%) |
| Electricity | 1,148 (26.7%) | 485 (73.3%) |
| Fuel Oil or Kerosene | 94 (2.2%) | 0 (0.0%) |
| Coal or Coke | 0 (0.0%) | 0 (0.0%) |
| All other Fuels | 30 (0.7%) | 0 (0.0%) |
| No Fuel Used | 0 (0.0%) | 8 (1.2%) |
| Total | 4,307 (100.0%) | 662 (100.0%) |
Household Vehicle Usage in Colesville
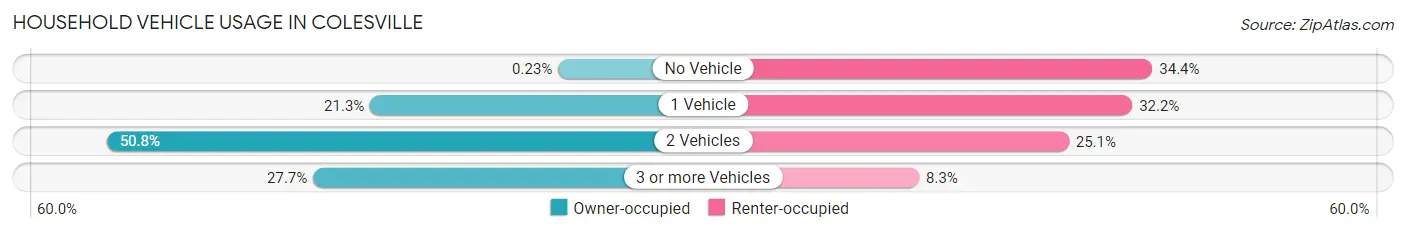
| Vehicles per Household | Owner-occupied | Renter-occupied |
| No Vehicle | 10 (0.2%) | 228 (34.4%) |
| 1 Vehicle | 917 (21.3%) | 213 (32.2%) |
| 2 Vehicles | 2,188 (50.8%) | 166 (25.1%) |
| 3 or more Vehicles | 1,192 (27.7%) | 55 (8.3%) |
| Total | 4,307 (100.0%) | 662 (100.0%) |
Real Estate & Mortgages in Colesville
Real Estate and Mortgage Overview in Colesville
| Characteristic | Without Mortgage | With Mortgage |
| Housing Units | 1,518 | 2,789 |
| Median Property Value | $556,800 | $562,600 |
| Median Household Income | $108,804 | $1,631 |
| Monthly Housing Costs | $803 | $1,003 |
| Real Estate Taxes | $4,766 | $51 |
Property Value by Mortgage Status in Colesville
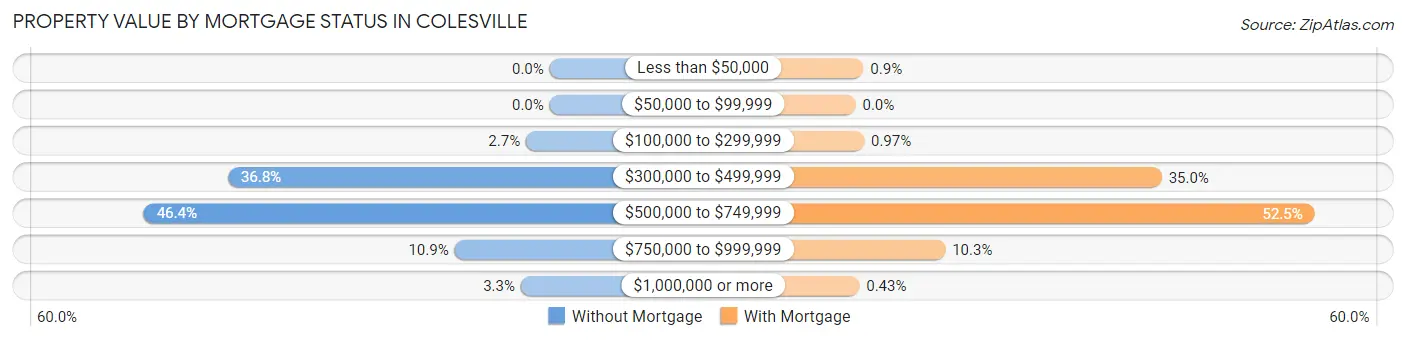
| Property Value | Without Mortgage | With Mortgage |
| Less than $50,000 | 0 (0.0%) | 25 (0.9%) |
| $50,000 to $99,999 | 0 (0.0%) | 0 (0.0%) |
| $100,000 to $299,999 | 41 (2.7%) | 27 (1.0%) |
| $300,000 to $499,999 | 558 (36.8%) | 976 (35.0%) |
| $500,000 to $749,999 | 704 (46.4%) | 1,463 (52.5%) |
| $750,000 to $999,999 | 165 (10.9%) | 286 (10.2%) |
| $1,000,000 or more | 50 (3.3%) | 12 (0.4%) |
| Total | 1,518 (100.0%) | 2,789 (100.0%) |
Household Income by Mortgage Status in Colesville
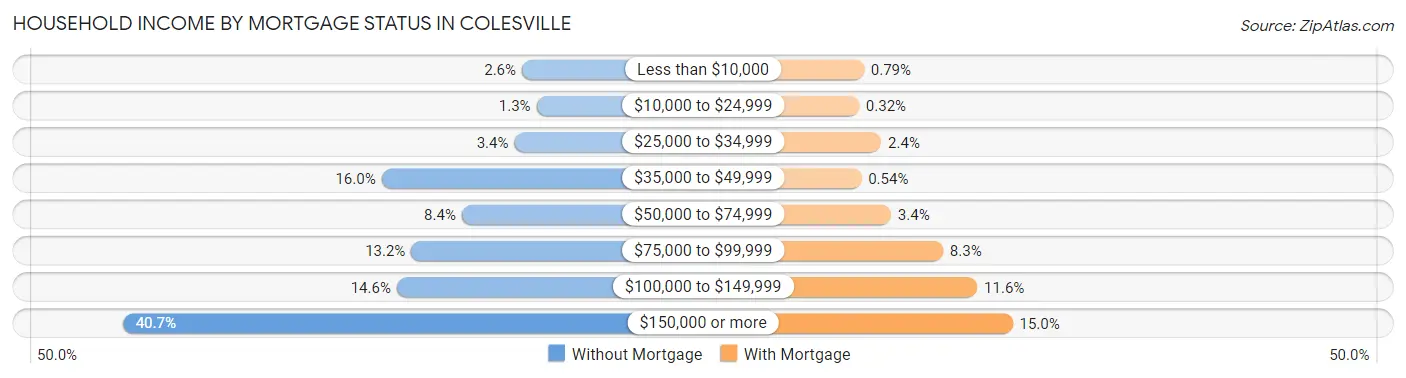
| Household Income | Without Mortgage | With Mortgage |
| Less than $10,000 | 40 (2.6%) | 22 (0.8%) |
| $10,000 to $24,999 | 19 (1.3%) | 9 (0.3%) |
| $25,000 to $34,999 | 51 (3.4%) | 68 (2.4%) |
| $35,000 to $49,999 | 243 (16.0%) | 15 (0.5%) |
| $50,000 to $74,999 | 127 (8.4%) | 94 (3.4%) |
| $75,000 to $99,999 | 200 (13.2%) | 232 (8.3%) |
| $100,000 to $149,999 | 221 (14.6%) | 323 (11.6%) |
| $150,000 or more | 617 (40.6%) | 417 (14.9%) |
| Total | 1,518 (100.0%) | 2,789 (100.0%) |
Property Value to Household Income Ratio in Colesville
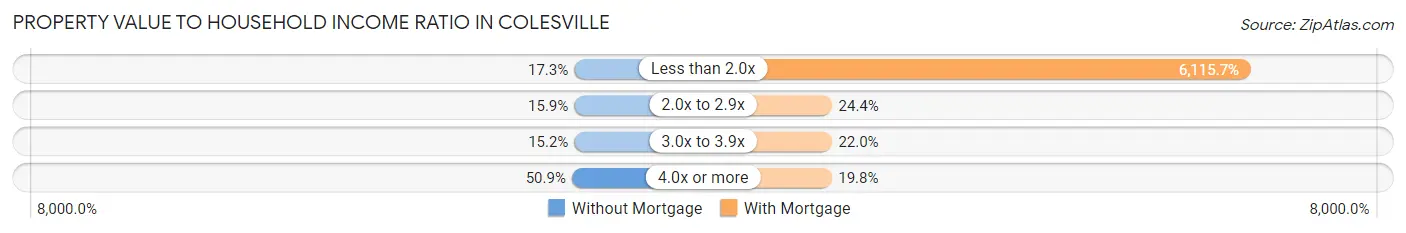
| Value-to-Income Ratio | Without Mortgage | With Mortgage |
| Less than 2.0x | 263 (17.3%) | 170,567 (6,115.7%) |
| 2.0x to 2.9x | 242 (15.9%) | 680 (24.4%) |
| 3.0x to 3.9x | 230 (15.1%) | 614 (22.0%) |
| 4.0x or more | 773 (50.9%) | 553 (19.8%) |
| Total | 1,518 (100.0%) | 2,789 (100.0%) |
Real Estate Taxes by Mortgage Status in Colesville
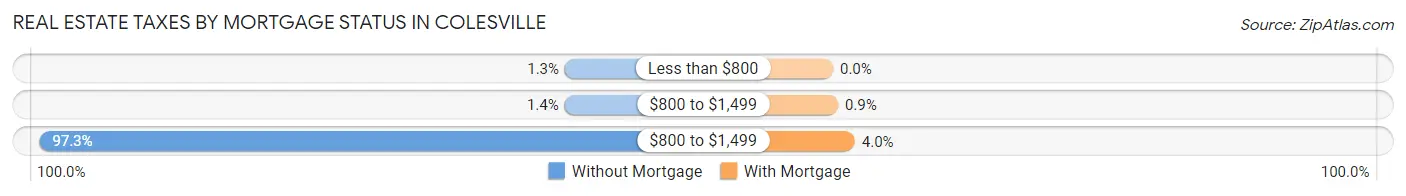
| Property Taxes | Without Mortgage | With Mortgage |
| Less than $800 | 20 (1.3%) | 0 (0.0%) |
| $800 to $1,499 | 21 (1.4%) | 25 (0.9%) |
| $800 to $1,499 | 1,477 (97.3%) | 111 (4.0%) |
| Total | 1,518 (100.0%) | 2,789 (100.0%) |
Health & Disability in Colesville
Health Insurance Coverage by Age in Colesville
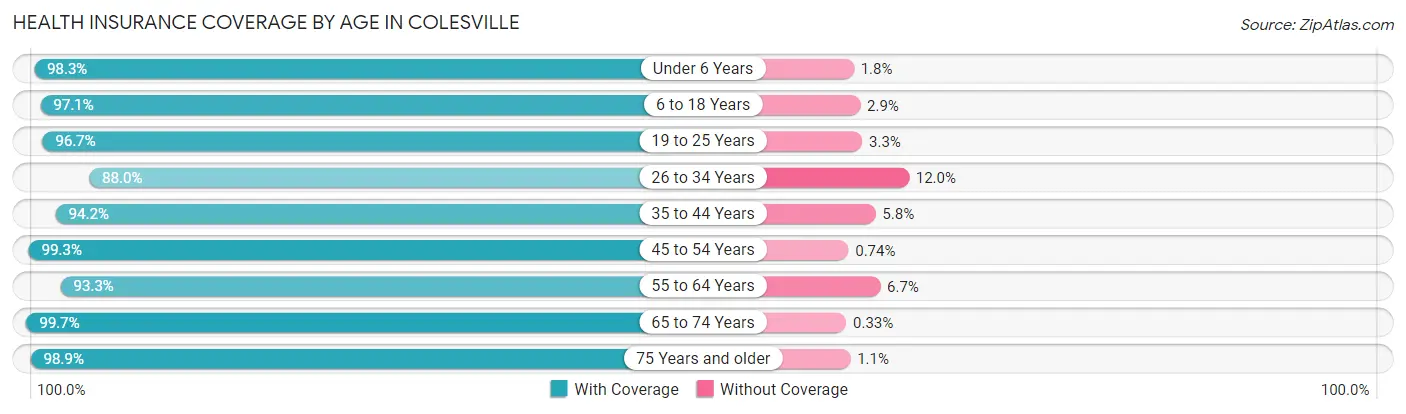
| Age Bracket | With Coverage | Without Coverage |
| Under 6 Years | 505 (98.3%) | 9 (1.8%) |
| 6 to 18 Years | 1,847 (97.1%) | 56 (2.9%) |
| 19 to 25 Years | 874 (96.7%) | 30 (3.3%) |
| 26 to 34 Years | 944 (88.0%) | 129 (12.0%) |
| 35 to 44 Years | 1,169 (94.2%) | 72 (5.8%) |
| 45 to 54 Years | 1,740 (99.3%) | 13 (0.7%) |
| 55 to 64 Years | 1,969 (93.3%) | 141 (6.7%) |
| 65 to 74 Years | 2,452 (99.7%) | 8 (0.3%) |
| 75 Years and older | 1,619 (98.9%) | 18 (1.1%) |
| Total | 13,119 (96.5%) | 476 (3.5%) |
Health Insurance Coverage by Citizenship Status in Colesville
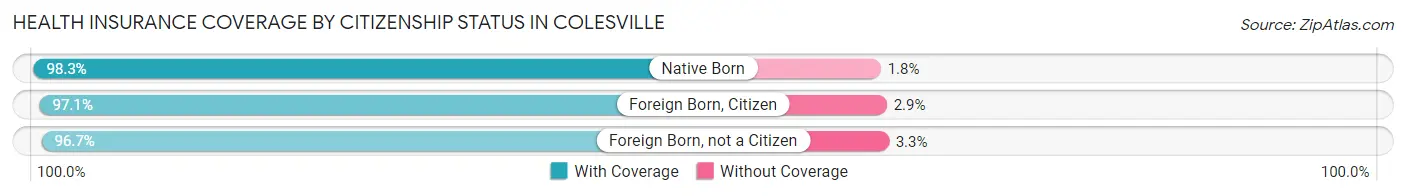
| Citizenship Status | With Coverage | Without Coverage |
| Native Born | 505 (98.3%) | 9 (1.8%) |
| Foreign Born, Citizen | 1,847 (97.1%) | 56 (2.9%) |
| Foreign Born, not a Citizen | 874 (96.7%) | 30 (3.3%) |
Health Insurance Coverage by Household Income in Colesville
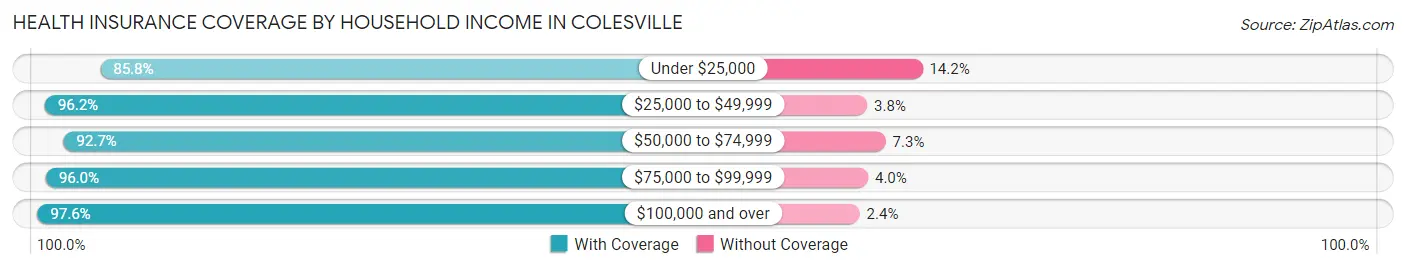
| Household Income | With Coverage | Without Coverage |
| Under $25,000 | 345 (85.8%) | 57 (14.2%) |
| $25,000 to $49,999 | 1,061 (96.2%) | 42 (3.8%) |
| $50,000 to $74,999 | 1,172 (92.7%) | 92 (7.3%) |
| $75,000 to $99,999 | 1,424 (96.0%) | 59 (4.0%) |
| $100,000 and over | 9,014 (97.6%) | 223 (2.4%) |
Public vs Private Health Insurance Coverage by Age in Colesville
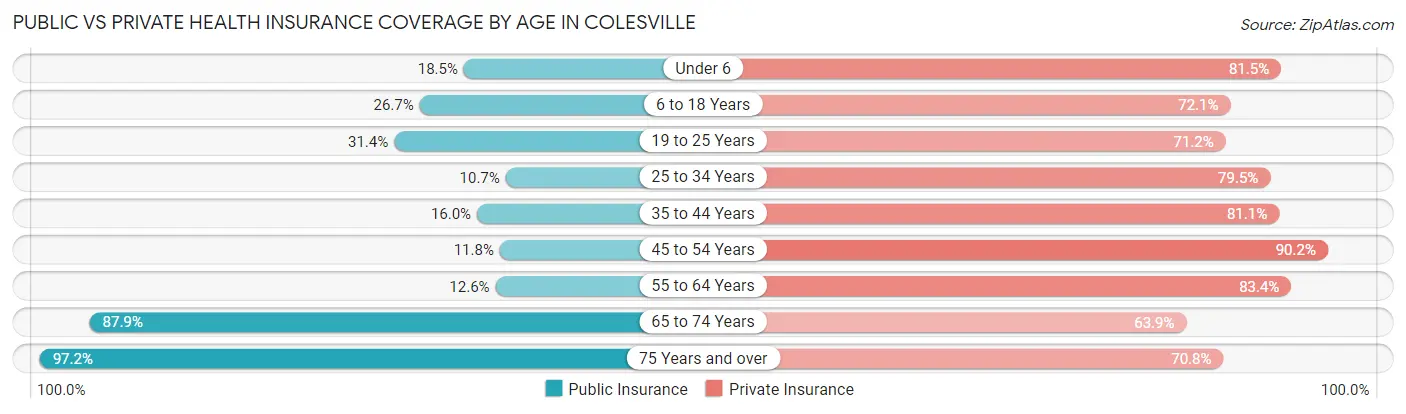
| Age Bracket | Public Insurance | Private Insurance |
| Under 6 | 95 (18.5%) | 419 (81.5%) |
| 6 to 18 Years | 508 (26.7%) | 1,372 (72.1%) |
| 19 to 25 Years | 284 (31.4%) | 644 (71.2%) |
| 25 to 34 Years | 115 (10.7%) | 853 (79.5%) |
| 35 to 44 Years | 199 (16.0%) | 1,007 (81.1%) |
| 45 to 54 Years | 207 (11.8%) | 1,581 (90.2%) |
| 55 to 64 Years | 266 (12.6%) | 1,760 (83.4%) |
| 65 to 74 Years | 2,163 (87.9%) | 1,573 (63.9%) |
| 75 Years and over | 1,591 (97.2%) | 1,159 (70.8%) |
| Total | 5,428 (39.9%) | 10,368 (76.3%) |
Disability Status by Sex by Age in Colesville
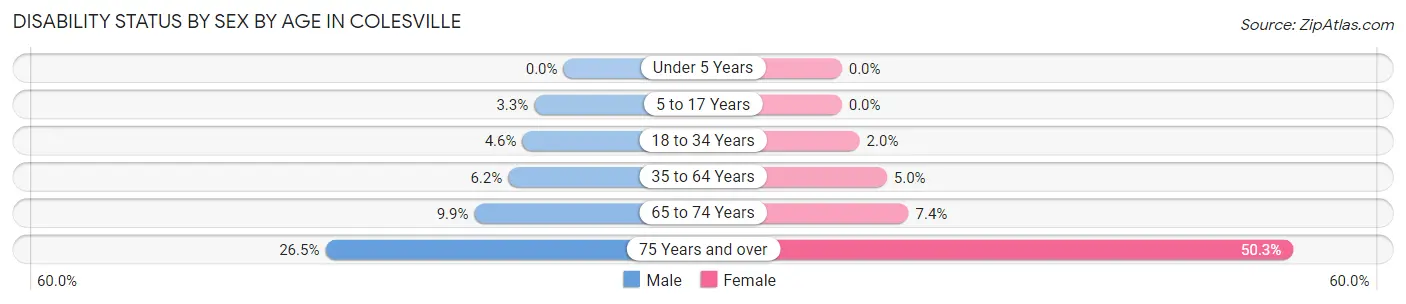
| Age Bracket | Male | Female |
| Under 5 Years | 0 (0.0%) | 0 (0.0%) |
| 5 to 17 Years | 37 (3.3%) | 0 (0.0%) |
| 18 to 34 Years | 50 (4.6%) | 20 (2.0%) |
| 35 to 64 Years | 156 (6.2%) | 129 (5.0%) |
| 65 to 74 Years | 120 (9.9%) | 93 (7.4%) |
| 75 Years and over | 175 (26.5%) | 491 (50.3%) |
Disability Class by Sex by Age in Colesville
Disability Class: Hearing Difficulty
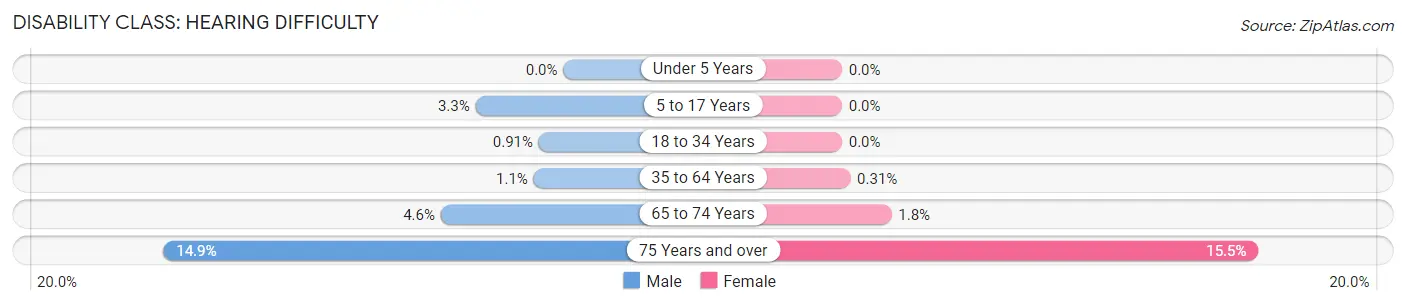
| Age Bracket | Male | Female |
| Under 5 Years | 0 (0.0%) | 0 (0.0%) |
| 5 to 17 Years | 37 (3.3%) | 0 (0.0%) |
| 18 to 34 Years | 10 (0.9%) | 0 (0.0%) |
| 35 to 64 Years | 28 (1.1%) | 8 (0.3%) |
| 65 to 74 Years | 55 (4.5%) | 23 (1.8%) |
| 75 Years and over | 98 (14.8%) | 151 (15.5%) |
Disability Class: Vision Difficulty
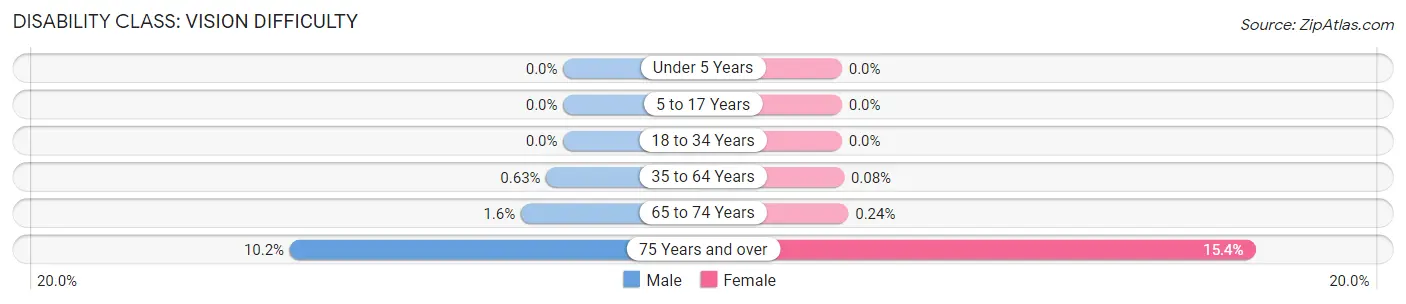
| Age Bracket | Male | Female |
| Under 5 Years | 0 (0.0%) | 0 (0.0%) |
| 5 to 17 Years | 0 (0.0%) | 0 (0.0%) |
| 18 to 34 Years | 0 (0.0%) | 0 (0.0%) |
| 35 to 64 Years | 16 (0.6%) | 2 (0.1%) |
| 65 to 74 Years | 19 (1.6%) | 3 (0.2%) |
| 75 Years and over | 67 (10.2%) | 150 (15.3%) |
Disability Class: Cognitive Difficulty
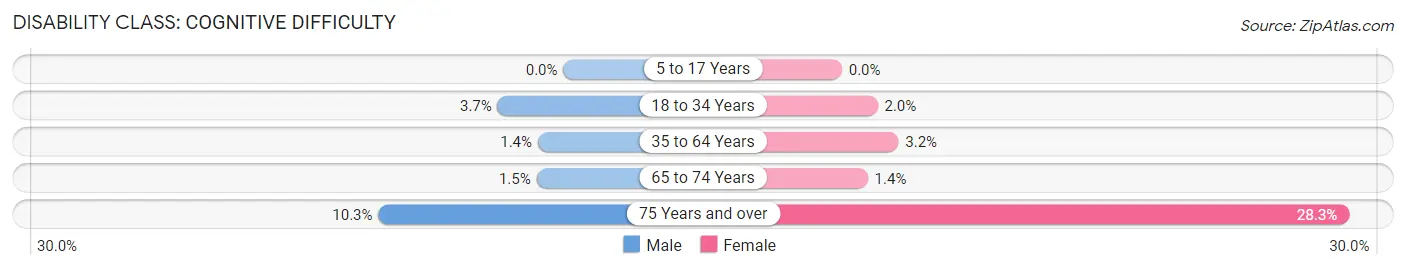
| Age Bracket | Male | Female |
| 5 to 17 Years | 0 (0.0%) | 0 (0.0%) |
| 18 to 34 Years | 40 (3.7%) | 20 (2.0%) |
| 35 to 64 Years | 36 (1.4%) | 81 (3.2%) |
| 65 to 74 Years | 18 (1.5%) | 18 (1.4%) |
| 75 Years and over | 68 (10.3%) | 276 (28.2%) |
Disability Class: Ambulatory Difficulty
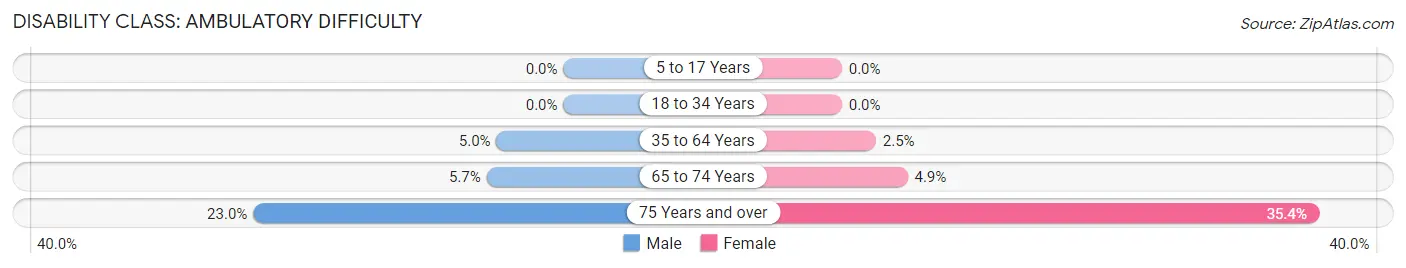
| Age Bracket | Male | Female |
| 5 to 17 Years | 0 (0.0%) | 0 (0.0%) |
| 18 to 34 Years | 0 (0.0%) | 0 (0.0%) |
| 35 to 64 Years | 126 (5.0%) | 65 (2.5%) |
| 65 to 74 Years | 69 (5.7%) | 61 (4.9%) |
| 75 Years and over | 152 (23.0%) | 346 (35.4%) |
Disability Class: Self-Care Difficulty
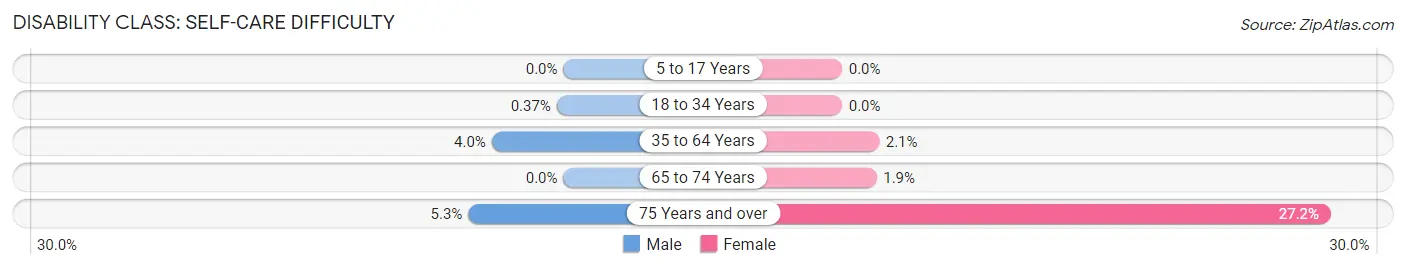
| Age Bracket | Male | Female |
| 5 to 17 Years | 0 (0.0%) | 0 (0.0%) |
| 18 to 34 Years | 4 (0.4%) | 0 (0.0%) |
| 35 to 64 Years | 101 (4.0%) | 53 (2.1%) |
| 65 to 74 Years | 0 (0.0%) | 24 (1.9%) |
| 75 Years and over | 35 (5.3%) | 266 (27.2%) |
Technology Access in Colesville
Computing Device Access in Colesville
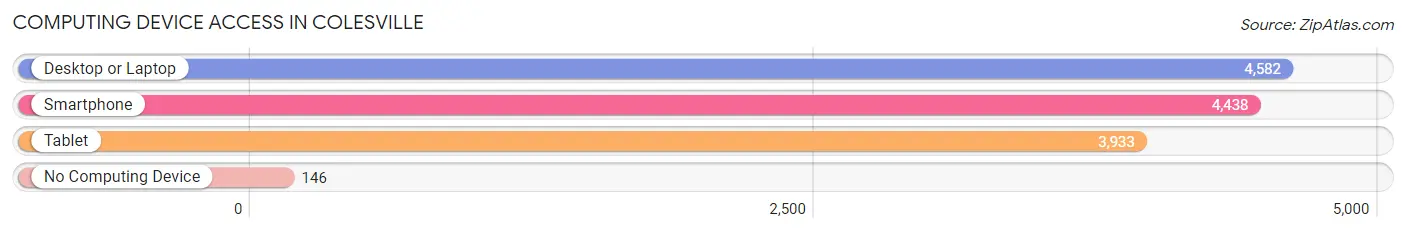
| Device Type | # Households | % Households |
| Desktop or Laptop | 4,582 | 92.2% |
| Smartphone | 4,438 | 89.3% |
| Tablet | 3,933 | 79.1% |
| No Computing Device | 146 | 2.9% |
| Total | 4,969 | 100.0% |
Internet Access in Colesville
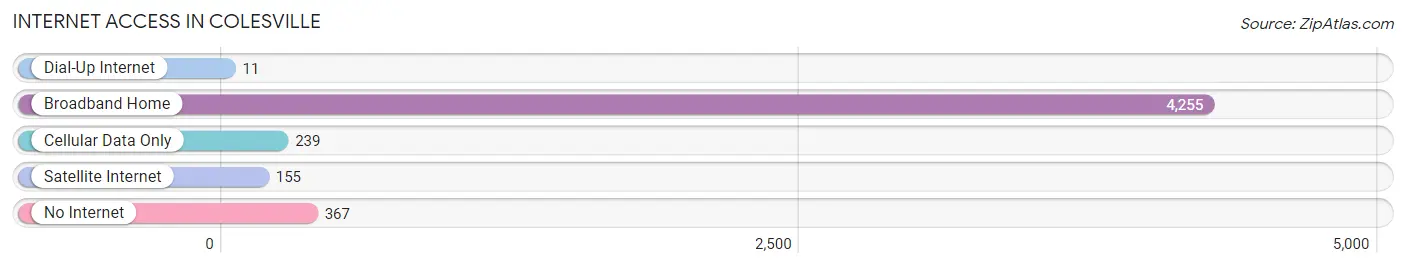
| Internet Type | # Households | % Households |
| Dial-Up Internet | 11 | 0.2% |
| Broadband Home | 4,255 | 85.6% |
| Cellular Data Only | 239 | 4.8% |
| Satellite Internet | 155 | 3.1% |
| No Internet | 367 | 7.4% |
| Total | 4,969 | 100.0% |
Colesville Summary
Colesville is an unincorporated community located in Montgomery County, Maryland, United States. It is situated in the northern part of the county, just south of the city of Silver Spring. The community is bordered by the towns of White Oak, Burtonsville, and Fairland.
History
Colesville was first settled in the late 1700s by the Coles family, who were among the first settlers in the area. The Coles family owned a large tract of land in the area, which was eventually divided up and sold off to other families. The community was named after the Coles family, and the name was officially adopted in 1878.
The area was largely rural until the 1950s, when the construction of the Capital Beltway and the development of nearby Silver Spring began to bring more people to the area. The population of Colesville began to grow rapidly, and by the 1970s it had become a thriving suburban community.
Geography
Colesville is located in northern Montgomery County, just south of the city of Silver Spring. It is bordered by the towns of White Oak, Burtonsville, and Fairland. The community is situated on a plateau, with an elevation of about 500 feet above sea level. The area is mostly flat, with some rolling hills.
The climate in Colesville is typical of the mid-Atlantic region, with hot, humid summers and cold, wet winters. The average annual temperature is around 55 degrees Fahrenheit, and the average annual precipitation is around 40 inches.
Economy
Colesville is primarily a residential community, with most of its residents commuting to nearby cities for work. The area is home to several large employers, including the National Institutes of Health, the National Oceanic and Atmospheric Administration, and the National Institute of Standards and Technology.
The area is also home to several shopping centers, including the White Oak Shopping Center, the Fairland Shopping Center, and the Colesville Shopping Center. There are also several restaurants and other businesses in the area.
Demographics
As of the 2010 census, the population of Colesville was 16,845. The racial makeup of the community was 57.3% White, 24.2% African American, 0.4% Native American, 8.2% Asian, 0.1% Pacific Islander, and 9.8% from other races. The median household income was $76,845, and the median family income was $90,845.
Conclusion
Colesville is a thriving suburban community located in northern Montgomery County, Maryland. It is bordered by the towns of White Oak, Burtonsville, and Fairland, and is home to several large employers. The population of Colesville is diverse, with a median household income of $76,845. The area is mostly residential, with most of its residents commuting to nearby cities for work.
Common Questions
What is the Total Population of Colesville?
Total Population of Colesville is 13,704.
What is the Total Male Population of Colesville?
Total Male Population of Colesville is 6,979.
What is the Total Female Population of Colesville?
Total Female Population of Colesville is 6,725.
What is the Ratio of Males per 100 Females in Colesville?
There are 103.78 Males per 100 Females in Colesville.
What is the Ratio of Females per 100 Males in Colesville?
There are 96.36 Females per 100 Males in Colesville.
What is the Median Population Age in Colesville?
Median Population Age in Colesville is 52.4 Years.
What is the Average Family Size in Colesville
Average Family Size in Colesville is 3.1 People.
What is the Average Household Size in Colesville
Average Household Size in Colesville is 2.7 People.
What is Per Capita Income in Colesville?
Per Capita income in Colesville is $63,950.
What is the Median Family Income in Colesville?
Median Family Income in Colesville is $154,516.
What is the Median Household income in Colesville?
Median Household Income in Colesville is $139,894.
What is Income or Wage Gap in Colesville?
Income or Wage Gap in Colesville is 5.0%.
Women in Colesville earn 95.0 cents for every dollar earned by a man.
What is Inequality or Gini Index in Colesville?
Inequality or Gini Index in Colesville is 0.44.
How Large is the Labor Force in Colesville?
There are 7,040 People in the Labor Forcein in Colesville.
What is the Percentage of People in the Labor Force in Colesville?
59.7% of People are in the Labor Force in Colesville.
What is the Unemployment Rate in Colesville?
Unemployment Rate in Colesville is 3.7%.