Cities with the Highest Percentage of Immigrants from Eastern Europe in Oregon
RELATED REPORTS & OPTIONS
Eastern Europe
Oregon
Compare Cities
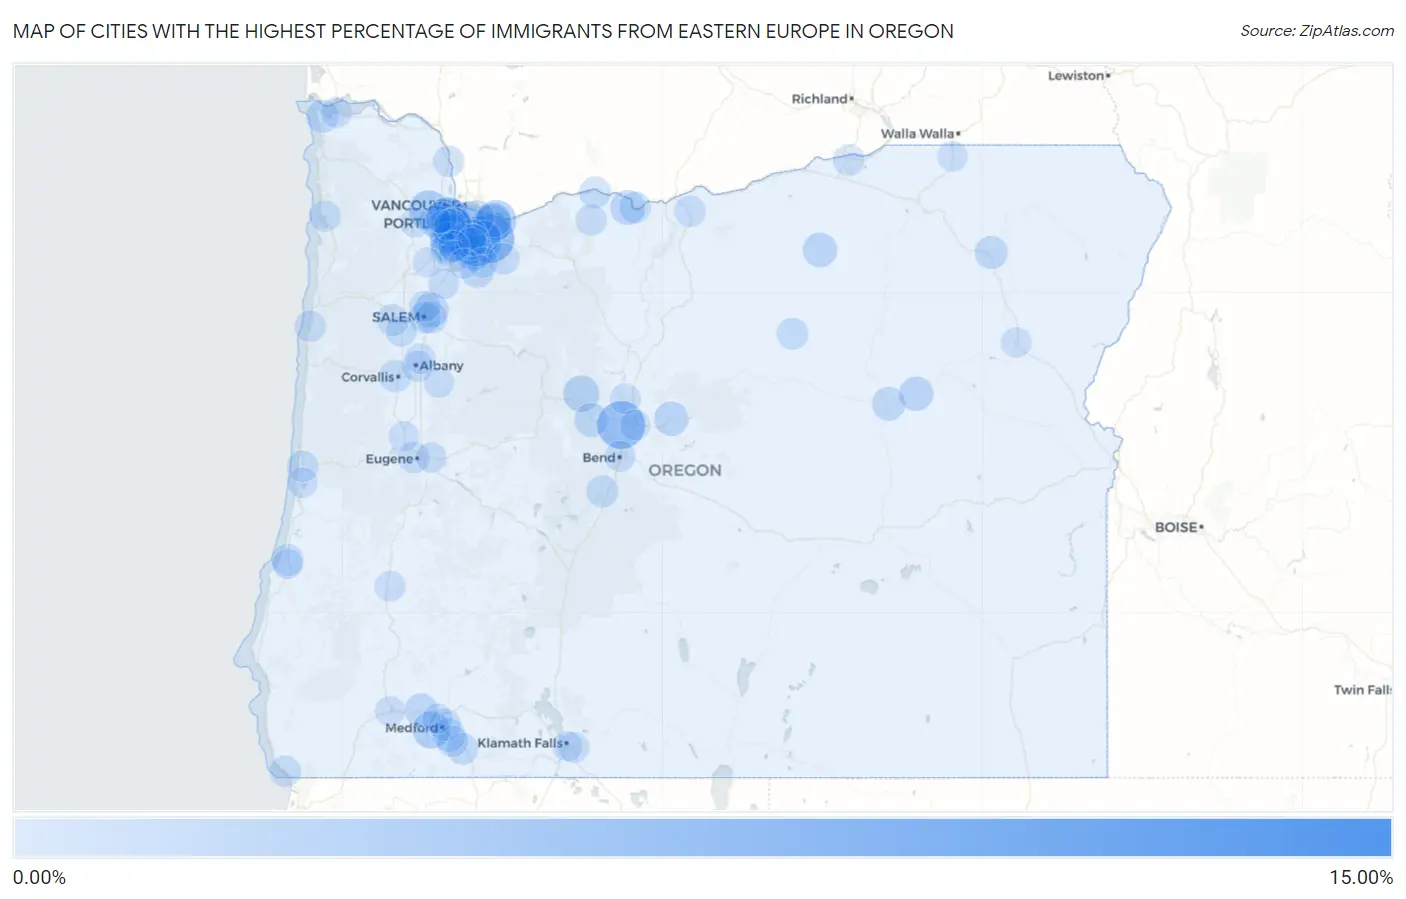
Map of Cities with the Highest Percentage of Immigrants from Eastern Europe in Oregon
0.00%
15.00%
Cities with the Highest Percentage of Immigrants from Eastern Europe in Oregon
| City | Eastern Europe | vs State | vs National | |
| 1. | Oregon Shores | 11.34% | 0.65%(+10.7)#1 | 0.67%(+10.7)#60 |
| 2. | Johnson City | 4.88% | 0.65%(+4.23)#2 | 0.67%(+4.22)#280 |
| 3. | Damascus | 4.65% | 0.65%(+4.00)#3 | 0.67%(+3.98)#304 |
| 4. | Eagle Crest | 4.46% | 0.65%(+3.80)#4 | 0.67%(+3.79)#326 |
| 5. | Oak Hills | 2.69% | 0.65%(+2.04)#5 | 0.67%(+2.02)#708 |
| 6. | Garden Home Whitford | 2.65% | 0.65%(+2.00)#6 | 0.67%(+1.99)#724 |
| 7. | Metzger | 2.52% | 0.65%(+1.87)#7 | 0.67%(+1.85)#789 |
| 8. | Troutdale | 2.51% | 0.65%(+1.86)#8 | 0.67%(+1.85)#794 |
| 9. | King City | 2.47% | 0.65%(+1.82)#9 | 0.67%(+1.80)#822 |
| 10. | North Plains | 2.38% | 0.65%(+1.73)#10 | 0.67%(+1.71)#864 |
| 11. | Bethany | 2.24% | 0.65%(+1.59)#11 | 0.67%(+1.58)#945 |
| 12. | Gresham | 2.07% | 0.65%(+1.42)#12 | 0.67%(+1.41)#1,051 |
| 13. | Cherry Grove | 2.04% | 0.65%(+1.39)#13 | 0.67%(+1.38)#1,072 |
| 14. | Oregon City | 1.98% | 0.65%(+1.33)#14 | 0.67%(+1.31)#1,109 |
| 15. | Cedar Mill | 1.84% | 0.65%(+1.19)#15 | 0.67%(+1.18)#1,221 |
| 16. | Jacksonville | 1.83% | 0.65%(+1.18)#16 | 0.67%(+1.16)#1,237 |
| 17. | Dunthorpe | 1.75% | 0.65%(+1.10)#17 | 0.67%(+1.09)#1,313 |
| 18. | West Slope | 1.61% | 0.65%(+0.954)#18 | 0.67%(+0.939)#1,468 |
| 19. | Camp Sherman | 1.60% | 0.65%(+0.946)#19 | 0.67%(+0.930)#1,480 |
| 20. | Portland | 1.25% | 0.65%(+0.600)#20 | 0.67%(+0.585)#1,950 |
| 21. | Chenoweth | 1.22% | 0.65%(+0.571)#21 | 0.67%(+0.556)#2,018 |
| 22. | Hayesville | 1.21% | 0.65%(+0.558)#22 | 0.67%(+0.543)#2,046 |
| 23. | Wood Village | 1.21% | 0.65%(+0.558)#23 | 0.67%(+0.542)#2,047 |
| 24. | Heppner | 1.14% | 0.65%(+0.486)#24 | 0.67%(+0.471)#2,162 |
| 25. | Prairie City | 1.12% | 0.65%(+0.464)#25 | 0.67%(+0.449)#2,209 |
| 26. | Prineville | 1.11% | 0.65%(+0.457)#26 | 0.67%(+0.441)#2,227 |
| 27. | West Linn | 1.02% | 0.65%(+0.368)#27 | 0.67%(+0.353)#2,426 |
| 28. | Bull Mountain | 1.01% | 0.65%(+0.357)#28 | 0.67%(+0.342)#2,444 |
| 29. | Sisters | 1.00% | 0.65%(+0.351)#29 | 0.67%(+0.336)#2,459 |
| 30. | Happy Valley | 0.98% | 0.65%(+0.324)#30 | 0.67%(+0.309)#2,520 |
| 31. | Canyon City | 0.96% | 0.65%(+0.307)#31 | 0.67%(+0.292)#2,566 |
| 32. | Maywood Park | 0.96% | 0.65%(+0.307)#32 | 0.67%(+0.292)#2,567 |
| 33. | Tigard | 0.95% | 0.65%(+0.302)#33 | 0.67%(+0.286)#2,577 |
| 34. | Aloha | 0.92% | 0.65%(+0.273)#34 | 0.67%(+0.258)#2,656 |
| 35. | Gold Hill | 0.87% | 0.65%(+0.221)#35 | 0.67%(+0.205)#2,803 |
| 36. | Mulino | 0.86% | 0.65%(+0.211)#36 | 0.67%(+0.195)#2,837 |
| 37. | Island City | 0.85% | 0.65%(+0.202)#37 | 0.67%(+0.187)#2,865 |
| 38. | Lake Oswego | 0.83% | 0.65%(+0.179)#38 | 0.67%(+0.163)#2,924 |
| 39. | Beaverton | 0.83% | 0.65%(+0.178)#39 | 0.67%(+0.162)#2,929 |
| 40. | Phoenix | 0.80% | 0.65%(+0.146)#40 | 0.67%(+0.130)#3,025 |
| 41. | Warrenton | 0.78% | 0.65%(+0.132)#41 | 0.67%(+0.116)#3,080 |
| 42. | Oak Grove | 0.75% | 0.65%(+0.095)#42 | 0.67%(+0.080)#3,196 |
| 43. | West Haven Sylvan | 0.73% | 0.65%(+0.076)#43 | 0.67%(+0.061)#3,252 |
| 44. | Hillsboro | 0.68% | 0.65%(+0.027)#44 | 0.67%(+0.012)#3,453 |
| 45. | Corvallis | 0.66% | 0.65%(+0.009)#45 | 0.67%(-0.006)#3,525 |
| 46. | Three Rivers | 0.61% | 0.65%(-0.040)#46 | 0.67%(-0.056)#3,737 |
| 47. | North Bend | 0.60% | 0.65%(-0.047)#47 | 0.67%(-0.062)#3,765 |
| 48. | Four Corners | 0.56% | 0.65%(-0.089)#48 | 0.67%(-0.104)#3,942 |
| 49. | Dallas | 0.53% | 0.65%(-0.127)#49 | 0.67%(-0.142)#4,105 |
| 50. | Medford | 0.52% | 0.65%(-0.129)#50 | 0.67%(-0.145)#4,128 |
| 51. | Sherwood | 0.52% | 0.65%(-0.129)#51 | 0.67%(-0.145)#4,129 |
| 52. | Ashland | 0.52% | 0.65%(-0.133)#52 | 0.67%(-0.148)#4,157 |
| 53. | Salem | 0.52% | 0.65%(-0.134)#53 | 0.67%(-0.149)#4,162 |
| 54. | Milwaukie | 0.51% | 0.65%(-0.138)#54 | 0.67%(-0.153)#4,180 |
| 55. | Cedar Hills | 0.51% | 0.65%(-0.145)#55 | 0.67%(-0.160)#4,209 |
| 56. | Spray | 0.50% | 0.65%(-0.149)#56 | 0.67%(-0.165)#4,230 |
| 57. | The Dalles | 0.49% | 0.65%(-0.158)#57 | 0.67%(-0.173)#4,267 |
| 58. | Jennings Lodge | 0.48% | 0.65%(-0.169)#58 | 0.67%(-0.184)#4,322 |
| 59. | Hood River | 0.48% | 0.65%(-0.169)#59 | 0.67%(-0.185)#4,327 |
| 60. | Eugene | 0.46% | 0.65%(-0.188)#60 | 0.67%(-0.203)#4,430 |
| 61. | Wilsonville | 0.46% | 0.65%(-0.194)#61 | 0.67%(-0.209)#4,460 |
| 62. | Estacada | 0.45% | 0.65%(-0.197)#62 | 0.67%(-0.212)#4,476 |
| 63. | Umatilla | 0.44% | 0.65%(-0.208)#63 | 0.67%(-0.223)#4,539 |
| 64. | Garibaldi | 0.42% | 0.65%(-0.233)#64 | 0.67%(-0.248)#4,691 |
| 65. | Wasco | 0.41% | 0.65%(-0.237)#65 | 0.67%(-0.252)#4,717 |
| 66. | Rockcreek | 0.41% | 0.65%(-0.239)#66 | 0.67%(-0.254)#4,726 |
| 67. | Oatfield | 0.41% | 0.65%(-0.246)#67 | 0.67%(-0.262)#4,775 |
| 68. | Harbor | 0.40% | 0.65%(-0.252)#68 | 0.67%(-0.268)#4,814 |
| 69. | Lincoln Beach | 0.40% | 0.65%(-0.256)#69 | 0.67%(-0.271)#4,839 |
| 70. | Columbia City | 0.39% | 0.65%(-0.257)#70 | 0.67%(-0.272)#4,842 |
| 71. | Mount Hood | 0.39% | 0.65%(-0.266)#71 | 0.67%(-0.281)#4,900 |
| 72. | Florence | 0.38% | 0.65%(-0.268)#72 | 0.67%(-0.283)#4,918 |
| 73. | Talent | 0.38% | 0.65%(-0.268)#73 | 0.67%(-0.283)#4,919 |
| 74. | Keizer | 0.38% | 0.65%(-0.273)#74 | 0.67%(-0.289)#4,959 |
| 75. | Marlene | 0.36% | 0.65%(-0.292)#75 | 0.67%(-0.308)#5,078 |
| 76. | Albany | 0.36% | 0.65%(-0.295)#76 | 0.67%(-0.310)#5,095 |
| 77. | Monmouth | 0.33% | 0.65%(-0.317)#77 | 0.67%(-0.332)#5,243 |
| 78. | Altamont | 0.31% | 0.65%(-0.337)#78 | 0.67%(-0.353)#5,376 |
| 79. | Bend | 0.29% | 0.65%(-0.360)#79 | 0.67%(-0.375)#5,566 |
| 80. | Tualatin | 0.29% | 0.65%(-0.364)#80 | 0.67%(-0.379)#5,604 |
| 81. | Millersburg | 0.27% | 0.65%(-0.382)#81 | 0.67%(-0.397)#5,785 |
| 82. | Astoria | 0.25% | 0.65%(-0.406)#82 | 0.67%(-0.422)#6,013 |
| 83. | Roseburg | 0.24% | 0.65%(-0.415)#83 | 0.67%(-0.430)#6,102 |
| 84. | Crooked River Ranch | 0.22% | 0.65%(-0.428)#84 | 0.67%(-0.443)#6,230 |
| 85. | Woodburn | 0.21% | 0.65%(-0.438)#85 | 0.67%(-0.454)#6,322 |
| 86. | Springfield | 0.20% | 0.65%(-0.449)#86 | 0.67%(-0.465)#6,433 |
| 87. | Beavercreek | 0.20% | 0.65%(-0.453)#87 | 0.67%(-0.469)#6,464 |
| 88. | Baker City | 0.19% | 0.65%(-0.464)#88 | 0.67%(-0.479)#6,582 |
| 89. | Junction City | 0.18% | 0.65%(-0.476)#89 | 0.67%(-0.491)#6,704 |
| 90. | Coos Bay | 0.17% | 0.65%(-0.482)#90 | 0.67%(-0.498)#6,751 |
| 91. | Dunes City | 0.16% | 0.65%(-0.488)#91 | 0.67%(-0.504)#6,813 |
| 92. | Canby | 0.16% | 0.65%(-0.492)#92 | 0.67%(-0.507)#6,845 |
| 93. | Milton Freewater | 0.15% | 0.65%(-0.498)#93 | 0.67%(-0.513)#6,909 |
| 94. | Redmond | 0.14% | 0.65%(-0.511)#94 | 0.67%(-0.527)#7,054 |
| 95. | Lebanon | 0.14% | 0.65%(-0.512)#95 | 0.67%(-0.527)#7,062 |
| 96. | Grants Pass | 0.11% | 0.65%(-0.539)#96 | 0.67%(-0.555)#7,292 |
| 97. | Central Point | 0.099% | 0.65%(-0.552)#97 | 0.67%(-0.568)#7,406 |
| 98. | Klamath Falls | 0.096% | 0.65%(-0.555)#98 | 0.67%(-0.571)#7,439 |
| 99. | Dundee | 0.093% | 0.65%(-0.559)#99 | 0.67%(-0.574)#7,463 |
| 100. | Forest Grove | 0.080% | 0.65%(-0.571)#100 | 0.67%(-0.587)#7,570 |
Common Questions
What are the Top 10 Cities with the Highest Percentage of Immigrants from Eastern Europe in Oregon?
Top 10 Cities with the Highest Percentage of Immigrants from Eastern Europe in Oregon are:
#1
4.88%
#2
4.65%
#3
4.46%
#4
2.69%
#5
2.65%
#6
2.52%
#7
2.51%
#8
2.47%
#9
2.38%
#10
2.24%
What city has the Highest Percentage of Immigrants from Eastern Europe in Oregon?
Johnson City has the Highest Percentage of Immigrants from Eastern Europe in Oregon with 4.88%.
What is the Percentage of Immigrants from Eastern Europe in the State of Oregon?
Percentage of Immigrants from Eastern Europe in Oregon is 0.65%.
What is the Percentage of Immigrants from Eastern Europe in the United States?
Percentage of Immigrants from Eastern Europe in the United States is 0.67%.