Immigrants from Guyana Disability
COMPARE
Immigrants from Guyana
Select to Compare
Disability
Immigrants from Guyana Disability
11.4%
DISABILITY
88.3/ 100
METRIC RATING
134th/ 347
METRIC RANK
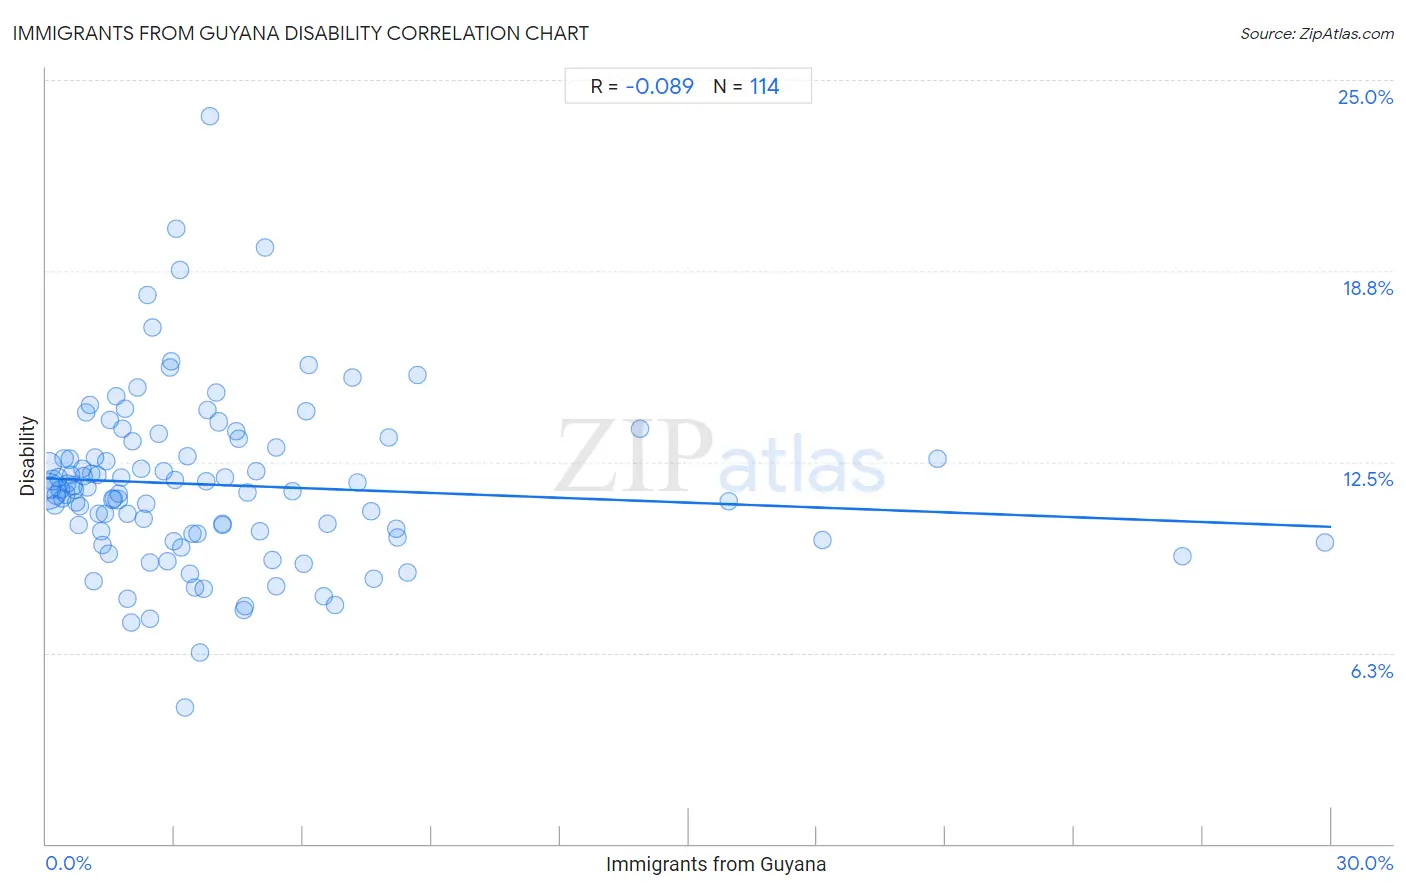
Immigrants from Guyana Disability Correlation Chart
The statistical analysis conducted on geographies consisting of 183,715,267 people shows a slight negative correlation between the proportion of Immigrants from Guyana and percentage of population with a disability in the United States with a correlation coefficient (R) of -0.089 and weighted average of 11.4%. On average, for every 1% (one percent) increase in Immigrants from Guyana within a typical geography, there is a decrease of 0.053% in percentage of population with a disability.
It is essential to understand that the correlation between the percentage of Immigrants from Guyana and percentage of population with a disability does not imply a direct cause-and-effect relationship. It remains uncertain whether the presence of Immigrants from Guyana influences an upward or downward trend in the level of percentage of population with a disability within an area, or if Immigrants from Guyana simply ended up residing in those areas with higher or lower levels of percentage of population with a disability due to other factors.
Demographics Similar to Immigrants from Guyana by Disability
In terms of disability, the demographic groups most similar to Immigrants from Guyana are Ugandan (11.4%, a difference of 0.050%), Immigrants from St. Vincent and the Grenadines (11.4%, a difference of 0.060%), Arab (11.4%, a difference of 0.080%), Immigrants from Africa (11.4%, a difference of 0.11%), and Kenyan (11.5%, a difference of 0.13%).
| Demographics | Rating | Rank | Disability |
| Immigrants from Italy | 90.4 /100 | #127 | Exceptional 11.4% |
| Immigrants from Europe | 90.4 /100 | #128 | Exceptional 11.4% |
| Macedonians | 90.3 /100 | #129 | Exceptional 11.4% |
| Latvians | 89.8 /100 | #130 | Excellent 11.4% |
| Immigrants from Croatia | 89.8 /100 | #131 | Excellent 11.4% |
| Immigrants from Africa | 89.3 /100 | #132 | Excellent 11.4% |
| Arabs | 89.1 /100 | #133 | Excellent 11.4% |
| Immigrants from Guyana | 88.3 /100 | #134 | Excellent 11.4% |
| Ugandans | 87.9 /100 | #135 | Excellent 11.4% |
| Immigrants from St. Vincent and the Grenadines | 87.8 /100 | #136 | Excellent 11.4% |
| Kenyans | 87.1 /100 | #137 | Excellent 11.5% |
| New Zealanders | 87.0 /100 | #138 | Excellent 11.5% |
| Ghanaians | 87.0 /100 | #139 | Excellent 11.5% |
| Russians | 86.8 /100 | #140 | Excellent 11.5% |
| Immigrants from Grenada | 86.1 /100 | #141 | Excellent 11.5% |
Immigrants from Guyana Disability Correlation Summary
| Measurement | Immigrants from Guyana Data | Disability Data |
| Minimum | 0.017% | 4.4% |
| Maximum | 29.8% | 23.8% |
| Range | 29.8% | 19.4% |
| Mean | 3.9% | 11.8% |
| Median | 2.8% | 11.6% |
| Interquartile 25% (IQ1) | 1.2% | 10.1% |
| Interquartile 75% (IQ3) | 4.7% | 13.0% |
| Interquartile Range (IQR) | 3.5% | 2.8% |
| Standard Deviation (Sample) | 4.8% | 2.8% |
| Standard Deviation (Population) | 4.7% | 2.8% |
Correlation Details
| Immigrants from Guyana Percentile | Sample Size | Disability |
[ 0.0% - 0.5% ] 0.017% | 79,496,090 | 11.6% |
[ 0.0% - 0.5% ] 0.063% | 31,778,458 | 12.4% |
[ 0.0% - 0.5% ] 0.11% | 14,448,312 | 11.7% |
[ 0.0% - 0.5% ] 0.15% | 9,938,106 | 11.9% |
[ 0.0% - 0.5% ] 0.19% | 6,448,118 | 11.1% |
[ 0.0% - 0.5% ] 0.24% | 4,621,864 | 11.4% |
[ 0.0% - 0.5% ] 0.28% | 3,872,636 | 12.0% |
[ 0.0% - 0.5% ] 0.32% | 3,065,902 | 11.6% |
[ 0.0% - 0.5% ] 0.37% | 2,152,325 | 11.3% |
[ 0.0% - 0.5% ] 0.41% | 2,015,173 | 12.6% |
[ 0.0% - 0.5% ] 0.46% | 1,329,497 | 11.4% |
[ 0.0% - 0.5% ] 0.50% | 1,443,899 | 11.8% |
[ 0.5% - 1.0% ] 0.54% | 1,698,181 | 12.6% |
[ 0.5% - 1.0% ] 0.58% | 945,390 | 12.1% |
[ 0.5% - 1.0% ] 0.63% | 906,711 | 11.7% |
[ 0.5% - 1.0% ] 0.67% | 788,115 | 11.6% |
[ 0.5% - 1.0% ] 0.71% | 548,581 | 11.2% |
[ 0.5% - 1.0% ] 0.75% | 500,308 | 10.4% |
[ 0.5% - 1.0% ] 0.80% | 698,314 | 11.0% |
[ 0.5% - 1.0% ] 0.85% | 371,701 | 12.3% |
[ 0.5% - 1.0% ] 0.88% | 609,155 | 12.0% |
[ 0.5% - 1.0% ] 0.94% | 639,760 | 14.1% |
[ 0.5% - 1.0% ] 0.97% | 416,003 | 11.7% |
[ 1.0% - 1.5% ] 1.01% | 459,823 | 14.4% |
[ 1.0% - 1.5% ] 1.05% | 175,189 | 12.1% |
[ 1.0% - 1.5% ] 1.11% | 485,074 | 8.6% |
[ 1.0% - 1.5% ] 1.15% | 240,669 | 12.6% |
[ 1.0% - 1.5% ] 1.19% | 262,120 | 12.1% |
[ 1.0% - 1.5% ] 1.24% | 299,100 | 10.8% |
[ 1.0% - 1.5% ] 1.29% | 185,213 | 10.2% |
[ 1.0% - 1.5% ] 1.32% | 118,162 | 9.8% |
[ 1.0% - 1.5% ] 1.37% | 176,200 | 10.8% |
[ 1.0% - 1.5% ] 1.41% | 31,132 | 12.5% |
[ 1.0% - 1.5% ] 1.45% | 128,480 | 9.5% |
[ 1.0% - 1.5% ] 1.49% | 116,733 | 13.9% |
[ 1.5% - 2.0% ] 1.54% | 98,754 | 11.3% |
[ 1.5% - 2.0% ] 1.59% | 100,368 | 11.3% |
[ 1.5% - 2.0% ] 1.63% | 95,034 | 14.7% |
[ 1.5% - 2.0% ] 1.67% | 8,682,331 | 11.3% |
[ 1.5% - 2.0% ] 1.70% | 17,453 | 11.5% |
[ 1.5% - 2.0% ] 1.76% | 41,487 | 12.0% |
[ 1.5% - 2.0% ] 1.79% | 39,833 | 13.6% |
[ 1.5% - 2.0% ] 1.85% | 10,277 | 14.2% |
[ 1.5% - 2.0% ] 1.89% | 9,572 | 10.8% |
[ 1.5% - 2.0% ] 1.91% | 8,592 | 8.0% |
[ 1.5% - 2.0% ] 1.98% | 50,700 | 7.2% |
[ 2.0% - 2.5% ] 2.01% | 62,566 | 13.2% |
[ 2.0% - 2.5% ] 2.13% | 11,841 | 15.0% |
[ 2.0% - 2.5% ] 2.22% | 99,189 | 12.3% |
[ 2.0% - 2.5% ] 2.28% | 163,473 | 10.7% |
[ 2.0% - 2.5% ] 2.32% | 126,582 | 11.1% |
[ 2.0% - 2.5% ] 2.35% | 47,740 | 18.0% |
[ 2.0% - 2.5% ] 2.41% | 8,590 | 7.3% |
[ 2.0% - 2.5% ] 2.44% | 24,174 | 9.2% |
[ 2.0% - 2.5% ] 2.48% | 2,096 | 16.9% |
[ 2.5% - 3.0% ] 2.61% | 72,881 | 13.4% |
[ 2.5% - 3.0% ] 2.73% | 3,110 | 12.2% |
[ 2.5% - 3.0% ] 2.84% | 185,343 | 9.2% |
[ 2.5% - 3.0% ] 2.90% | 59,721 | 15.6% |
[ 2.5% - 3.0% ] 2.92% | 14,937 | 15.8% |
[ 2.5% - 3.0% ] 2.97% | 113,334 | 9.9% |
[ 3.0% - 3.5% ] 3.01% | 24,584 | 11.9% |
[ 3.0% - 3.5% ] 3.05% | 1,804 | 20.1% |
[ 3.0% - 3.5% ] 3.13% | 9,272 | 18.8% |
[ 3.0% - 3.5% ] 3.16% | 71,894 | 9.7% |
[ 3.0% - 3.5% ] 3.25% | 7,653 | 4.4% |
[ 3.0% - 3.5% ] 3.30% | 41,633 | 12.7% |
[ 3.0% - 3.5% ] 3.36% | 44,527 | 8.8% |
[ 3.0% - 3.5% ] 3.41% | 103,664 | 10.1% |
[ 3.0% - 3.5% ] 3.48% | 41,696 | 8.4% |
[ 3.5% - 4.0% ] 3.54% | 4,006 | 10.1% |
[ 3.5% - 4.0% ] 3.59% | 3,568 | 6.2% |
[ 3.5% - 4.0% ] 3.69% | 1,951 | 8.4% |
[ 3.5% - 4.0% ] 3.74% | 34,406 | 11.9% |
[ 3.5% - 4.0% ] 3.77% | 92,588 | 14.2% |
[ 3.5% - 4.0% ] 3.83% | 14,793 | 23.8% |
[ 3.5% - 4.0% ] 3.97% | 1,790 | 14.8% |
[ 4.0% - 4.5% ] 4.02% | 96,801 | 13.8% |
[ 4.0% - 4.5% ] 4.11% | 5,164 | 10.4% |
[ 4.0% - 4.5% ] 4.12% | 14,287 | 10.5% |
[ 4.0% - 4.5% ] 4.18% | 43,014 | 12.0% |
[ 4.0% - 4.5% ] 4.42% | 30,290 | 13.5% |
[ 4.0% - 4.5% ] 4.48% | 218,639 | 13.3% |
[ 4.5% - 5.0% ] 4.60% | 5,938 | 7.7% |
[ 4.5% - 5.0% ] 4.64% | 100,082 | 7.8% |
[ 4.5% - 5.0% ] 4.69% | 135,422 | 11.5% |
[ 4.5% - 5.0% ] 4.91% | 21,329 | 12.2% |
[ 4.5% - 5.0% ] 4.99% | 108,470 | 10.2% |
[ 5.0% - 5.5% ] 5.12% | 15,459 | 19.5% |
[ 5.0% - 5.5% ] 5.30% | 44,832 | 9.3% |
[ 5.0% - 5.5% ] 5.37% | 22,770 | 8.4% |
[ 5.0% - 5.5% ] 5.37% | 29,216 | 13.0% |
[ 5.5% - 6.0% ] 5.74% | 27,845 | 11.6% |
[ 6.0% - 6.5% ] 6.02% | 1,577 | 9.2% |
[ 6.0% - 6.5% ] 6.07% | 25,187 | 14.2% |
[ 6.0% - 6.5% ] 6.13% | 14,367 | 15.7% |
[ 6.0% - 6.5% ] 6.47% | 108,180 | 8.1% |
[ 6.5% - 7.0% ] 6.56% | 78,506 | 10.5% |
[ 6.5% - 7.0% ] 6.74% | 2,135 | 7.8% |
[ 7.0% - 7.5% ] 7.15% | 21,901 | 15.2% |
[ 7.0% - 7.5% ] 7.27% | 38,317 | 11.8% |
[ 7.5% - 8.0% ] 7.59% | 40,593 | 10.9% |
[ 7.5% - 8.0% ] 7.64% | 59,961 | 8.7% |
[ 7.5% - 8.0% ] 7.99% | 413 | 13.3% |
[ 8.0% - 8.5% ] 8.16% | 38,865 | 10.3% |
[ 8.0% - 8.5% ] 8.19% | 31,200 | 10.0% |
[ 8.0% - 8.5% ] 8.44% | 27,794 | 8.9% |
[ 8.5% - 9.0% ] 8.66% | 68,476 | 15.3% |
[ 13.5% - 14.0% ] 13.87% | 29,921 | 13.6% |
[ 15.5% - 16.0% ] 15.94% | 19,554 | 11.2% |
[ 18.0% - 18.5% ] 18.13% | 21,349 | 9.9% |
[ 20.5% - 21.0% ] 20.81% | 7,863 | 12.6% |
[ 26.5% - 27.0% ] 26.52% | 51,153 | 9.4% |
[ 29.5% - 30.0% ] 29.84% | 48,096 | 9.9% |