Romanian Male Disability
COMPARE
Romanian
Select to Compare
Male Disability
Romanian Male Disability
11.2%
DISABILITY | MALES
50.7/ 100
METRIC RATING
172nd/ 347
METRIC RANK
Romanian Male Disability Correlation Chart
The statistical analysis conducted on geographies consisting of 377,848,419 people shows a significant positive correlation between the proportion of Romanians and percentage of males with a disability in the United States with a correlation coefficient (R) of 0.618 and weighted average of 11.2%. On average, for every 1% (one percent) increase in Romanians within a typical geography, there is an increase of 0.65% in percentage of males with a disability.
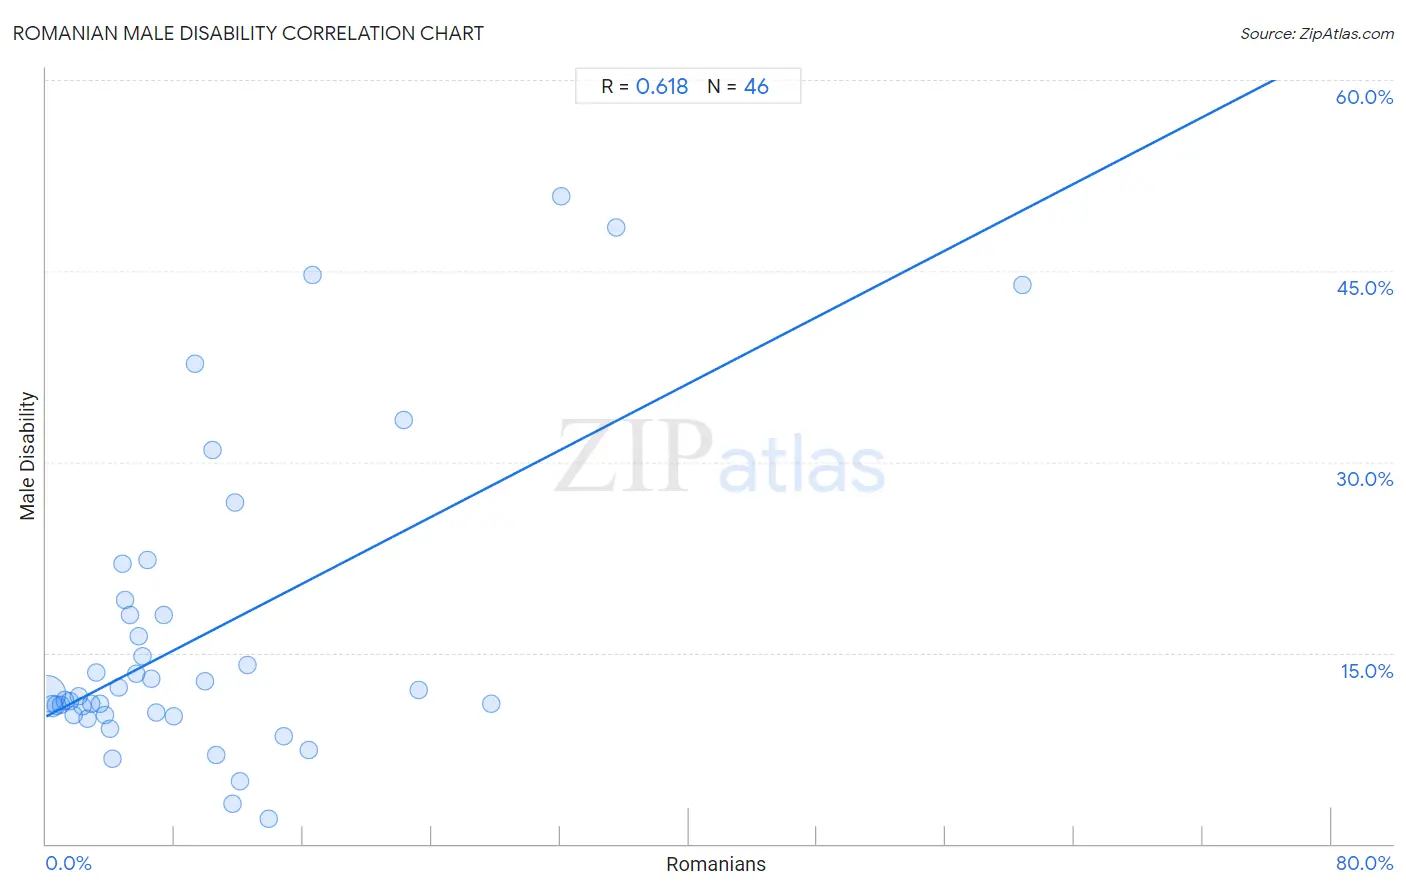
It is essential to understand that the correlation between the percentage of Romanians and percentage of males with a disability does not imply a direct cause-and-effect relationship. It remains uncertain whether the presence of Romanians influences an upward or downward trend in the level of percentage of males with a disability within an area, or if Romanians simply ended up residing in those areas with higher or lower levels of percentage of males with a disability due to other factors.
Demographics Similar to Romanians by Male Disability
In terms of male disability, the demographic groups most similar to Romanians are Immigrants from Burma/Myanmar (11.2%, a difference of 0.020%), Maltese (11.2%, a difference of 0.040%), Haitian (11.2%, a difference of 0.10%), New Zealander (11.2%, a difference of 0.12%), and Immigrants from Honduras (11.2%, a difference of 0.12%).
| Demographics | Rating | Rank | Male Disability |
| Luxembourgers | 61.9 /100 | #165 | Good 11.1% |
| Immigrants from Hungary | 61.2 /100 | #166 | Good 11.1% |
| Immigrants from Southern Europe | 54.4 /100 | #167 | Average 11.2% |
| Immigrants from Latin America | 54.0 /100 | #168 | Average 11.2% |
| Barbadians | 53.4 /100 | #169 | Average 11.2% |
| New Zealanders | 52.9 /100 | #170 | Average 11.2% |
| Haitians | 52.5 /100 | #171 | Average 11.2% |
| Romanians | 50.7 /100 | #172 | Average 11.2% |
| Immigrants from Burma/Myanmar | 50.4 /100 | #173 | Average 11.2% |
| Maltese | 50.0 /100 | #174 | Average 11.2% |
| Immigrants from Honduras | 48.7 /100 | #175 | Average 11.2% |
| Syrians | 46.6 /100 | #176 | Average 11.2% |
| Immigrants from Norway | 44.2 /100 | #177 | Average 11.3% |
| Australians | 42.2 /100 | #178 | Average 11.3% |
| Immigrants from Caribbean | 41.4 /100 | #179 | Average 11.3% |
Romanian Male Disability Correlation Summary
| Measurement | Romanian Data | Male Disability Data |
| Minimum | 0.10% | 2.0% |
| Maximum | 60.8% | 50.8% |
| Range | 60.7% | 48.8% |
| Mean | 9.9% | 16.5% |
| Median | 6.1% | 11.7% |
| Interquartile 25% (IQ1) | 3.1% | 10.2% |
| Interquartile 75% (IQ3) | 12.1% | 18.0% |
| Interquartile Range (IQR) | 9.0% | 7.8% |
| Standard Deviation (Sample) | 11.3% | 11.9% |
| Standard Deviation (Population) | 11.1% | 11.8% |
Correlation Details
| Romanian Percentile | Sample Size | Male Disability |
[ 0.0% - 0.5% ] 0.10% | 284,524,796 | 11.8% |
[ 0.0% - 0.5% ] 0.36% | 62,682,702 | 10.8% |
[ 0.5% - 1.0% ] 0.66% | 15,572,227 | 10.9% |
[ 0.5% - 1.0% ] 0.93% | 7,459,596 | 10.9% |
[ 1.0% - 1.5% ] 1.19% | 3,348,367 | 11.3% |
[ 1.0% - 1.5% ] 1.46% | 1,442,105 | 11.2% |
[ 1.5% - 2.0% ] 1.75% | 926,396 | 10.2% |
[ 2.0% - 2.5% ] 2.02% | 583,206 | 11.6% |
[ 2.0% - 2.5% ] 2.28% | 341,552 | 10.8% |
[ 2.5% - 3.0% ] 2.53% | 297,832 | 9.8% |
[ 2.5% - 3.0% ] 2.82% | 216,524 | 11.0% |
[ 3.0% - 3.5% ] 3.09% | 39,061 | 13.5% |
[ 3.0% - 3.5% ] 3.35% | 120,201 | 11.0% |
[ 3.5% - 4.0% ] 3.63% | 85,739 | 10.1% |
[ 3.5% - 4.0% ] 3.94% | 64,297 | 9.0% |
[ 4.0% - 4.5% ] 4.13% | 65,225 | 6.7% |
[ 4.0% - 4.5% ] 4.49% | 7,647 | 12.3% |
[ 4.5% - 5.0% ] 4.78% | 3,285 | 22.0% |
[ 4.5% - 5.0% ] 4.93% | 3,898 | 19.2% |
[ 5.0% - 5.5% ] 5.22% | 7,065 | 17.9% |
[ 5.5% - 6.0% ] 5.58% | 3,494 | 13.4% |
[ 5.5% - 6.0% ] 5.79% | 18,526 | 16.3% |
[ 5.5% - 6.0% ] 5.97% | 4,839 | 14.7% |
[ 6.0% - 6.5% ] 6.30% | 540 | 22.3% |
[ 6.5% - 7.0% ] 6.57% | 4,903 | 12.9% |
[ 6.5% - 7.0% ] 6.84% | 3,858 | 10.3% |
[ 7.0% - 7.5% ] 7.32% | 164 | 18.0% |
[ 7.5% - 8.0% ] 7.98% | 326 | 10.0% |
[ 9.0% - 9.5% ] 9.30% | 1,990 | 37.7% |
[ 9.5% - 10.0% ] 9.90% | 3,586 | 12.8% |
[ 10.0% - 10.5% ] 10.32% | 659 | 31.0% |
[ 10.5% - 11.0% ] 10.55% | 919 | 7.0% |
[ 11.5% - 12.0% ] 11.56% | 5,501 | 3.1% |
[ 11.5% - 12.0% ] 11.74% | 426 | 26.8% |
[ 12.0% - 12.5% ] 12.10% | 1,885 | 4.9% |
[ 12.0% - 12.5% ] 12.50% | 40 | 14.0% |
[ 13.5% - 14.0% ] 13.88% | 353 | 2.0% |
[ 14.5% - 15.0% ] 14.75% | 278 | 8.5% |
[ 16.0% - 16.5% ] 16.36% | 220 | 7.4% |
[ 16.5% - 17.0% ] 16.61% | 319 | 44.7% |
[ 22.0% - 22.5% ] 22.22% | 783 | 33.3% |
[ 23.0% - 23.5% ] 23.18% | 962 | 12.1% |
[ 27.5% - 28.0% ] 27.70% | 1,668 | 11.0% |
[ 32.0% - 32.5% ] 32.05% | 78 | 50.8% |
[ 35.0% - 35.5% ] 35.48% | 93 | 48.4% |
[ 60.5% - 61.0% ] 60.76% | 288 | 43.9% |