Nonimmigrants Receiving Food Stamps
COMPARE
Nonimmigrants
Select to Compare
Receiving Food Stamps
Nonimmigrants Receiving Food Stamps
12.4%
PUBLIC INCOME | FOOD STAMPS
17.6/ 100
METRIC RATING
204th/ 347
METRIC RANK
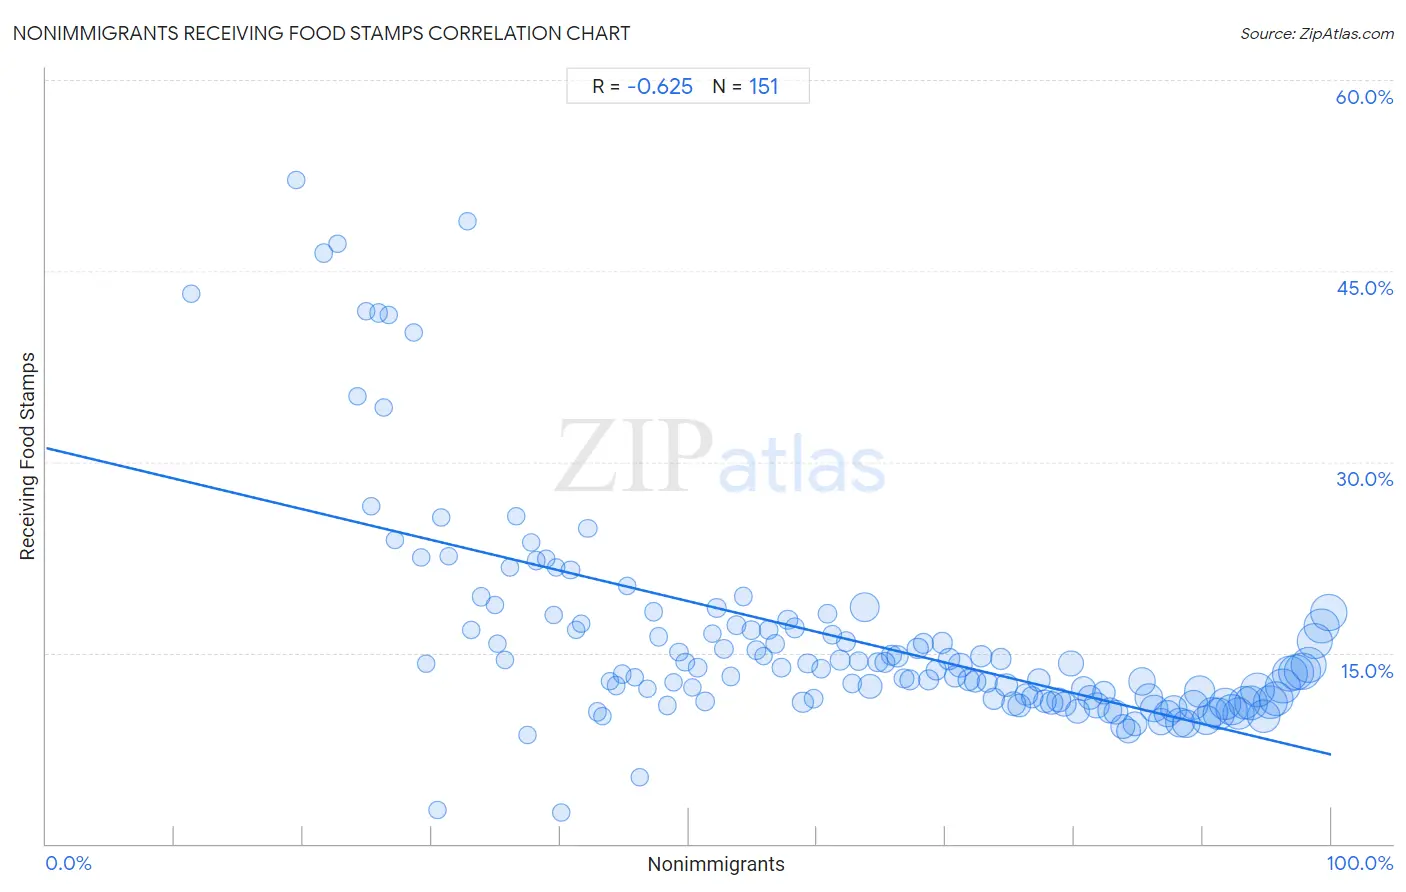
Nonimmigrants Receiving Food Stamps Correlation Chart
The statistical analysis conducted on geographies consisting of 580,622,931 people shows a significant negative correlation between the proportion of Nonimmigrants and percentage of population receiving government assistance and/or food stamps in the United States with a correlation coefficient (R) of -0.625 and weighted average of 12.4%. On average, for every 1% (one percent) increase in Nonimmigrants within a typical geography, there is a decrease of 0.24% in percentage of population receiving government assistance and/or food stamps.
It is essential to understand that the correlation between the percentage of Nonimmigrants and percentage of population receiving government assistance and/or food stamps does not imply a direct cause-and-effect relationship. It remains uncertain whether the presence of Nonimmigrants influences an upward or downward trend in the level of percentage of population receiving government assistance and/or food stamps within an area, or if Nonimmigrants simply ended up residing in those areas with higher or lower levels of percentage of population receiving government assistance and/or food stamps due to other factors.
Demographics Similar to Nonimmigrants by Receiving Food Stamps
In terms of receiving food stamps, the demographic groups most similar to Nonimmigrants are Shoshone (12.4%, a difference of 0.030%), Aleut (12.4%, a difference of 0.070%), Immigrants from Thailand (12.4%, a difference of 0.13%), South American (12.4%, a difference of 0.39%), and Immigrants from Venezuela (12.3%, a difference of 0.56%).
| Demographics | Rating | Rank | Receiving Food Stamps |
| Delaware | 26.1 /100 | #197 | Fair 12.2% |
| Immigrants from Costa Rica | 25.4 /100 | #198 | Fair 12.2% |
| Portuguese | 25.1 /100 | #199 | Fair 12.2% |
| Sierra Leoneans | 23.6 /100 | #200 | Fair 12.2% |
| Ugandans | 22.5 /100 | #201 | Fair 12.2% |
| Immigrants from Venezuela | 20.1 /100 | #202 | Fair 12.3% |
| Shoshone | 17.7 /100 | #203 | Poor 12.4% |
| Nonimmigrants | 17.6 /100 | #204 | Poor 12.4% |
| Aleuts | 17.3 /100 | #205 | Poor 12.4% |
| Immigrants from Thailand | 17.0 /100 | #206 | Poor 12.4% |
| South Americans | 16.0 /100 | #207 | Poor 12.4% |
| Potawatomi | 14.6 /100 | #208 | Poor 12.5% |
| Immigrants from Sierra Leone | 12.9 /100 | #209 | Poor 12.5% |
| Immigrants from Uruguay | 12.8 /100 | #210 | Poor 12.5% |
| Colombians | 10.2 /100 | #211 | Poor 12.6% |
Nonimmigrants Receiving Food Stamps Correlation Summary
| Measurement | Nonimmigrants Data | Receiving Food Stamps Data |
| Minimum | 11.3% | 2.4% |
| Maximum | 99.8% | 52.1% |
| Range | 88.5% | 49.7% |
| Mean | 61.9% | 16.2% |
| Median | 62.2% | 13.8% |
| Interquartile 25% (IQ1) | 43.3% | 11.2% |
| Interquartile 75% (IQ3) | 81.2% | 17.1% |
| Interquartile Range (IQR) | 37.9% | 5.9% |
| Standard Deviation (Sample) | 22.5% | 8.7% |
| Standard Deviation (Population) | 22.4% | 8.6% |
Correlation Details
| Nonimmigrants Percentile | Sample Size | Receiving Food Stamps |
[ 11.0% - 11.5% ] 11.31% | 168 | 43.2% |
[ 19.0% - 19.5% ] 19.42% | 1,030 | 52.1% |
[ 21.5% - 22.0% ] 21.63% | 42,081 | 46.4% |
[ 22.5% - 23.0% ] 22.62% | 84 | 47.1% |
[ 24.0% - 24.5% ] 24.26% | 1,018 | 35.2% |
[ 24.5% - 25.0% ] 24.90% | 71,088 | 41.8% |
[ 25.0% - 25.5% ] 25.32% | 46,798 | 26.5% |
[ 25.5% - 26.0% ] 25.85% | 257,769 | 41.7% |
[ 26.0% - 26.5% ] 26.25% | 19,452 | 34.3% |
[ 26.5% - 27.0% ] 26.69% | 29,830 | 41.5% |
[ 27.0% - 27.5% ] 27.15% | 57,226 | 23.8% |
[ 28.5% - 29.0% ] 28.63% | 45,620 | 40.2% |
[ 29.0% - 29.5% ] 29.21% | 137,895 | 22.5% |
[ 29.5% - 30.0% ] 29.61% | 115,169 | 14.2% |
[ 30.0% - 30.5% ] 30.42% | 766 | 2.7% |
[ 30.5% - 31.0% ] 30.74% | 90,791 | 25.6% |
[ 31.0% - 31.5% ] 31.32% | 119,624 | 22.6% |
[ 32.5% - 33.0% ] 32.81% | 128 | 48.9% |
[ 33.0% - 33.5% ] 33.09% | 109,218 | 16.8% |
[ 33.5% - 34.0% ] 33.83% | 152,851 | 19.4% |
[ 34.5% - 35.0% ] 34.90% | 53,206 | 18.8% |
[ 35.0% - 35.5% ] 35.12% | 105,802 | 15.8% |
[ 35.5% - 36.0% ] 35.67% | 109,357 | 14.5% |
[ 36.0% - 36.5% ] 36.09% | 117,178 | 21.7% |
[ 36.5% - 37.0% ] 36.58% | 26,777 | 25.7% |
[ 37.0% - 37.5% ] 37.42% | 26,268 | 8.6% |
[ 37.5% - 38.0% ] 37.72% | 94,094 | 23.7% |
[ 38.0% - 38.5% ] 38.12% | 128,746 | 22.3% |
[ 38.5% - 39.0% ] 38.87% | 58,079 | 22.4% |
[ 39.0% - 39.5% ] 39.47% | 36,392 | 17.9% |
[ 39.5% - 40.0% ] 39.70% | 154,064 | 21.7% |
[ 40.0% - 40.5% ] 40.08% | 15,664 | 2.4% |
[ 40.5% - 41.0% ] 40.81% | 87,016 | 21.5% |
[ 41.0% - 41.5% ] 41.20% | 221,458 | 16.8% |
[ 41.5% - 42.0% ] 41.66% | 98,862 | 17.3% |
[ 42.0% - 42.5% ] 42.16% | 598,269 | 24.8% |
[ 42.5% - 43.0% ] 42.87% | 110,508 | 10.4% |
[ 43.0% - 43.5% ] 43.28% | 75,873 | 10.0% |
[ 43.5% - 44.0% ] 43.83% | 91,391 | 12.8% |
[ 44.0% - 44.5% ] 44.39% | 148,280 | 12.4% |
[ 44.5% - 45.0% ] 44.82% | 482,171 | 13.3% |
[ 45.0% - 45.5% ] 45.22% | 593,707 | 20.2% |
[ 45.5% - 46.0% ] 45.83% | 373,613 | 13.1% |
[ 46.0% - 46.5% ] 46.19% | 463,452 | 5.2% |
[ 46.5% - 47.0% ] 46.76% | 134,810 | 12.1% |
[ 47.0% - 47.5% ] 47.24% | 236,458 | 18.2% |
[ 47.5% - 48.0% ] 47.68% | 205,023 | 16.3% |
[ 48.0% - 48.5% ] 48.33% | 305,734 | 10.9% |
[ 48.5% - 49.0% ] 48.82% | 319,766 | 12.7% |
[ 49.0% - 49.5% ] 49.21% | 730,401 | 15.1% |
[ 49.5% - 50.0% ] 49.72% | 640,490 | 14.3% |
[ 50.0% - 50.5% ] 50.31% | 165,718 | 12.3% |
[ 50.5% - 51.0% ] 50.72% | 846,833 | 13.8% |
[ 51.0% - 51.5% ] 51.26% | 845,794 | 11.2% |
[ 51.5% - 52.0% ] 51.86% | 169,402 | 16.5% |
[ 52.0% - 52.5% ] 52.17% | 277,496 | 18.5% |
[ 52.5% - 53.0% ] 52.71% | 816,251 | 15.3% |
[ 53.0% - 53.5% ] 53.28% | 708,226 | 13.1% |
[ 53.5% - 54.0% ] 53.70% | 775,770 | 17.1% |
[ 54.0% - 54.5% ] 54.25% | 709,386 | 19.4% |
[ 54.5% - 55.0% ] 54.86% | 870,345 | 16.7% |
[ 55.0% - 55.5% ] 55.28% | 853,496 | 15.2% |
[ 55.5% - 56.0% ] 55.80% | 369,140 | 14.7% |
[ 56.0% - 56.5% ] 56.21% | 1,284,809 | 16.8% |
[ 56.5% - 57.0% ] 56.74% | 890,335 | 15.7% |
[ 57.0% - 57.5% ] 57.22% | 816,089 | 13.8% |
[ 57.5% - 58.0% ] 57.72% | 1,499,420 | 17.6% |
[ 58.0% - 58.5% ] 58.27% | 1,525,373 | 17.0% |
[ 58.5% - 59.0% ] 58.89% | 2,638,354 | 11.1% |
[ 59.0% - 59.5% ] 59.24% | 1,733,667 | 14.2% |
[ 59.5% - 60.0% ] 59.75% | 1,248,986 | 11.4% |
[ 60.0% - 60.5% ] 60.31% | 1,202,435 | 13.8% |
[ 60.5% - 61.0% ] 60.77% | 1,154,178 | 18.1% |
[ 61.0% - 61.5% ] 61.19% | 1,595,169 | 16.4% |
[ 61.5% - 62.0% ] 61.77% | 1,933,490 | 14.4% |
[ 62.0% - 62.5% ] 62.24% | 1,529,881 | 15.9% |
[ 62.5% - 63.0% ] 62.74% | 1,595,792 | 12.6% |
[ 63.0% - 63.5% ] 63.23% | 1,320,002 | 14.3% |
[ 63.5% - 64.0% ] 63.68% | 10,443,433 | 18.6% |
[ 64.0% - 64.5% ] 64.09% | 5,378,088 | 12.4% |
[ 64.5% - 65.0% ] 64.74% | 1,582,671 | 14.3% |
[ 65.0% - 65.5% ] 65.26% | 2,389,832 | 14.3% |
[ 65.5% - 66.0% ] 65.77% | 1,748,840 | 14.8% |
[ 66.0% - 66.5% ] 66.26% | 3,218,546 | 14.7% |
[ 66.5% - 67.0% ] 66.73% | 1,734,360 | 13.0% |
[ 67.0% - 67.5% ] 67.25% | 2,358,775 | 12.9% |
[ 67.5% - 68.0% ] 67.79% | 2,883,077 | 15.3% |
[ 68.0% - 68.5% ] 68.25% | 2,833,189 | 15.7% |
[ 68.5% - 69.0% ] 68.69% | 2,413,656 | 12.8% |
[ 69.0% - 69.5% ] 69.26% | 2,235,496 | 13.7% |
[ 69.5% - 70.0% ] 69.73% | 2,693,352 | 15.8% |
[ 70.0% - 70.5% ] 70.24% | 2,778,720 | 14.5% |
[ 70.5% - 71.0% ] 70.73% | 3,105,704 | 13.1% |
[ 71.0% - 71.5% ] 71.14% | 5,108,898 | 14.0% |
[ 71.5% - 72.0% ] 71.76% | 3,346,430 | 12.9% |
[ 72.0% - 72.5% ] 72.27% | 2,967,681 | 12.8% |
[ 72.5% - 73.0% ] 72.73% | 3,309,580 | 14.7% |
[ 73.0% - 73.5% ] 73.24% | 2,755,613 | 12.7% |
[ 73.5% - 74.0% ] 73.76% | 3,197,779 | 11.4% |
[ 74.0% - 74.5% ] 74.31% | 2,911,743 | 14.5% |
[ 74.5% - 75.0% ] 74.75% | 4,164,742 | 12.5% |
[ 75.0% - 75.5% ] 75.25% | 5,521,200 | 11.0% |
[ 75.5% - 76.0% ] 75.72% | 3,598,757 | 10.9% |
[ 76.0% - 76.5% ] 76.24% | 4,181,919 | 11.7% |
[ 76.5% - 77.0% ] 76.76% | 3,736,512 | 11.5% |
[ 77.0% - 77.5% ] 77.27% | 4,289,732 | 12.8% |
[ 77.5% - 78.0% ] 77.77% | 4,407,559 | 11.2% |
[ 78.0% - 78.5% ] 78.23% | 3,712,043 | 11.1% |
[ 78.5% - 79.0% ] 78.77% | 5,533,583 | 11.3% |
[ 79.0% - 79.5% ] 79.23% | 4,811,026 | 11.0% |
[ 79.5% - 80.0% ] 79.73% | 7,105,914 | 14.2% |
[ 80.0% - 80.5% ] 80.27% | 5,439,281 | 10.4% |
[ 80.5% - 81.0% ] 80.74% | 5,918,789 | 12.2% |
[ 81.0% - 81.5% ] 81.22% | 5,643,595 | 11.5% |
[ 81.5% - 82.0% ] 81.75% | 5,967,123 | 10.9% |
[ 82.0% - 82.5% ] 82.30% | 4,120,977 | 11.8% |
[ 82.5% - 83.0% ] 82.75% | 5,928,383 | 10.5% |
[ 83.0% - 83.5% ] 83.26% | 6,057,457 | 10.3% |
[ 83.5% - 84.0% ] 83.77% | 4,985,460 | 9.2% |
[ 84.0% - 84.5% ] 84.23% | 5,893,728 | 8.8% |
[ 84.5% - 85.0% ] 84.77% | 5,400,814 | 9.4% |
[ 85.0% - 85.5% ] 85.27% | 8,533,373 | 12.8% |
[ 85.5% - 86.0% ] 85.76% | 8,752,507 | 11.5% |
[ 86.0% - 86.5% ] 86.20% | 8,256,761 | 10.7% |
[ 86.5% - 87.0% ] 86.75% | 7,110,718 | 9.6% |
[ 87.0% - 87.5% ] 87.25% | 7,906,969 | 10.2% |
[ 87.5% - 88.0% ] 87.78% | 7,647,526 | 10.6% |
[ 88.0% - 88.5% ] 88.24% | 9,897,201 | 9.6% |
[ 88.5% - 89.0% ] 88.76% | 8,871,056 | 9.5% |
[ 89.0% - 89.5% ] 89.26% | 10,200,628 | 10.9% |
[ 89.5% - 90.0% ] 89.74% | 11,653,995 | 11.9% |
[ 90.0% - 90.5% ] 90.24% | 9,770,440 | 9.7% |
[ 90.5% - 91.0% ] 90.75% | 10,691,886 | 10.4% |
[ 91.0% - 91.5% ] 91.26% | 12,031,880 | 10.2% |
[ 91.5% - 92.0% ] 91.77% | 11,909,678 | 11.0% |
[ 92.0% - 92.5% ] 92.26% | 11,542,966 | 10.6% |
[ 92.5% - 93.0% ] 92.76% | 12,536,938 | 10.2% |
[ 93.0% - 93.5% ] 93.25% | 12,979,795 | 11.1% |
[ 93.5% - 94.0% ] 93.76% | 13,644,858 | 11.1% |
[ 94.0% - 94.5% ] 94.25% | 14,399,933 | 12.0% |
[ 94.5% - 95.0% ] 94.74% | 13,356,756 | 10.0% |
[ 95.0% - 95.5% ] 95.25% | 13,794,778 | 11.1% |
[ 95.5% - 96.0% ] 95.75% | 14,530,313 | 11.4% |
[ 96.0% - 96.5% ] 96.25% | 14,770,164 | 12.4% |
[ 96.5% - 97.0% ] 96.76% | 15,562,494 | 13.3% |
[ 97.0% - 97.5% ] 97.26% | 15,682,497 | 13.5% |
[ 97.5% - 98.0% ] 97.76% | 16,555,720 | 13.6% |
[ 98.0% - 98.5% ] 98.25% | 15,608,320 | 14.1% |
[ 98.5% - 99.0% ] 98.75% | 15,772,751 | 15.9% |
[ 99.0% - 99.5% ] 99.24% | 14,855,450 | 17.1% |
[ 99.5% - 100.0% ] 99.83% | 16,463,171 | 18.2% |