Mexican Male Disability
COMPARE
Mexican
Select to Compare
Male Disability
Mexican Male Disability
11.8%
DISABILITY | MALES
1.7/ 100
METRIC RATING
233rd/ 347
METRIC RANK
Mexican Male Disability Correlation Chart
The statistical analysis conducted on geographies consisting of 564,830,995 people shows a poor negative correlation between the proportion of Mexicans and percentage of males with a disability in the United States with a correlation coefficient (R) of -0.110 and weighted average of 11.8%. On average, for every 1% (one percent) increase in Mexicans within a typical geography, there is a decrease of 0.0046% in percentage of males with a disability.
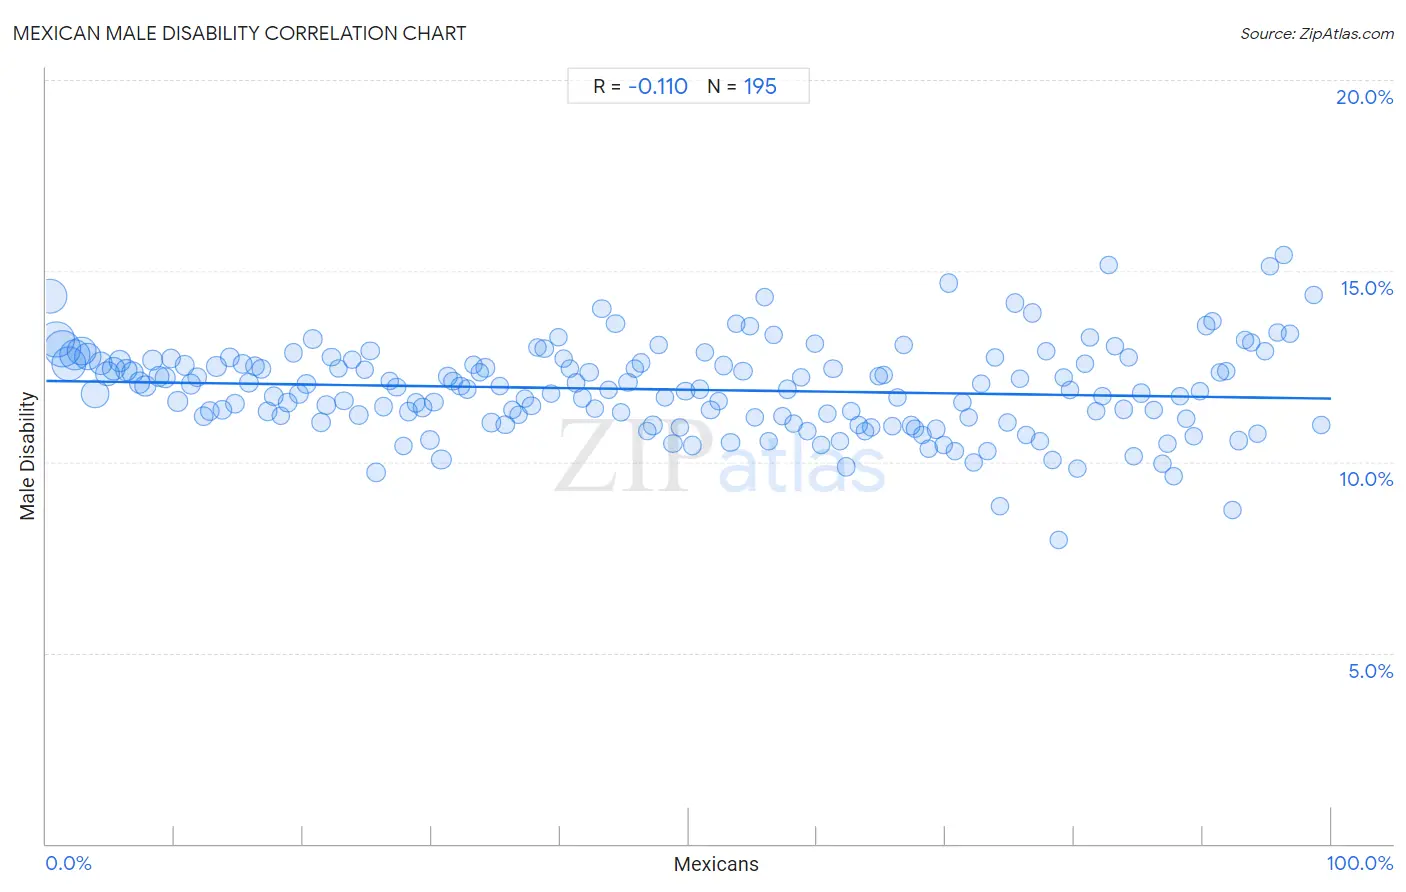
It is essential to understand that the correlation between the percentage of Mexicans and percentage of males with a disability does not imply a direct cause-and-effect relationship. It remains uncertain whether the presence of Mexicans influences an upward or downward trend in the level of percentage of males with a disability within an area, or if Mexicans simply ended up residing in those areas with higher or lower levels of percentage of males with a disability due to other factors.
Demographics Similar to Mexicans by Male Disability
In terms of male disability, the demographic groups most similar to Mexicans are Malaysian (11.8%, a difference of 0.040%), Immigrants from Canada (11.9%, a difference of 0.070%), Dominican (11.8%, a difference of 0.10%), Immigrants from North America (11.9%, a difference of 0.20%), and Croatian (11.8%, a difference of 0.30%).
| Demographics | Rating | Rank | Male Disability |
| Sub-Saharan Africans | 2.8 /100 | #226 | Tragic 11.8% |
| Austrians | 2.5 /100 | #227 | Tragic 11.8% |
| Hispanics or Latinos | 2.3 /100 | #228 | Tragic 11.8% |
| Bermudans | 2.3 /100 | #229 | Tragic 11.8% |
| Croatians | 2.1 /100 | #230 | Tragic 11.8% |
| Dominicans | 1.8 /100 | #231 | Tragic 11.8% |
| Malaysians | 1.8 /100 | #232 | Tragic 11.8% |
| Mexicans | 1.7 /100 | #233 | Tragic 11.8% |
| Immigrants from Canada | 1.6 /100 | #234 | Tragic 11.9% |
| Immigrants from North America | 1.5 /100 | #235 | Tragic 11.9% |
| U.S. Virgin Islanders | 1.3 /100 | #236 | Tragic 11.9% |
| Carpatho Rusyns | 1.3 /100 | #237 | Tragic 11.9% |
| Yugoslavians | 1.2 /100 | #238 | Tragic 11.9% |
| Italians | 1.2 /100 | #239 | Tragic 11.9% |
| Czechs | 1.1 /100 | #240 | Tragic 11.9% |
Mexican Male Disability Correlation Summary
| Measurement | Mexican Data | Male Disability Data |
| Minimum | 0.28% | 8.0% |
| Maximum | 99.2% | 15.4% |
| Range | 98.9% | 7.4% |
| Mean | 48.8% | 11.9% |
| Median | 48.8% | 11.9% |
| Interquartile 25% (IQ1) | 24.3% | 11.1% |
| Interquartile 75% (IQ3) | 73.2% | 12.6% |
| Interquartile Range (IQR) | 48.9% | 1.5% |
| Standard Deviation (Sample) | 28.3% | 1.2% |
| Standard Deviation (Population) | 28.3% | 1.2% |
Correlation Details
| Mexican Percentile | Sample Size | Male Disability |
[ 0.0% - 0.5% ] 0.28% | 40,154,651 | 14.3% |
[ 0.5% - 1.0% ] 0.75% | 45,671,948 | 13.2% |
[ 1.0% - 1.5% ] 1.25% | 46,163,270 | 13.0% |
[ 1.5% - 2.0% ] 1.75% | 39,784,431 | 12.6% |
[ 2.0% - 2.5% ] 2.23% | 31,719,076 | 12.8% |
[ 2.5% - 3.0% ] 2.74% | 25,655,413 | 12.9% |
[ 3.0% - 3.5% ] 3.23% | 20,317,690 | 12.8% |
[ 3.5% - 4.0% ] 3.81% | 24,085,286 | 11.8% |
[ 4.0% - 4.5% ] 4.26% | 14,407,381 | 12.6% |
[ 4.5% - 5.0% ] 4.75% | 15,394,568 | 12.3% |
[ 5.0% - 5.5% ] 5.26% | 12,617,703 | 12.4% |
[ 5.5% - 6.0% ] 5.74% | 10,207,971 | 12.6% |
[ 6.0% - 6.5% ] 6.27% | 8,798,595 | 12.4% |
[ 6.5% - 7.0% ] 6.76% | 9,105,163 | 12.3% |
[ 7.0% - 7.5% ] 7.26% | 8,480,085 | 12.1% |
[ 7.5% - 8.0% ] 7.72% | 7,542,845 | 12.0% |
[ 8.0% - 8.5% ] 8.25% | 5,509,833 | 12.7% |
[ 8.5% - 9.0% ] 8.75% | 5,277,467 | 12.2% |
[ 9.0% - 9.5% ] 9.24% | 5,048,192 | 12.2% |
[ 9.5% - 10.0% ] 9.74% | 4,431,486 | 12.7% |
[ 10.0% - 10.5% ] 10.24% | 5,118,934 | 11.6% |
[ 10.5% - 11.0% ] 10.77% | 4,416,737 | 12.5% |
[ 11.0% - 11.5% ] 11.26% | 4,376,936 | 12.0% |
[ 11.5% - 12.0% ] 11.76% | 4,640,019 | 12.2% |
[ 12.0% - 12.5% ] 12.24% | 3,472,416 | 11.2% |
[ 12.5% - 13.0% ] 12.72% | 4,042,429 | 11.3% |
[ 13.0% - 13.5% ] 13.27% | 5,165,183 | 12.5% |
[ 13.5% - 14.0% ] 13.73% | 3,990,643 | 11.4% |
[ 14.0% - 14.5% ] 14.25% | 3,763,511 | 12.7% |
[ 14.5% - 15.0% ] 14.73% | 3,215,749 | 11.5% |
[ 15.0% - 15.5% ] 15.26% | 2,438,724 | 12.6% |
[ 15.5% - 16.0% ] 15.76% | 2,368,620 | 12.1% |
[ 16.0% - 16.5% ] 16.23% | 3,322,706 | 12.5% |
[ 16.5% - 17.0% ] 16.75% | 2,505,406 | 12.4% |
[ 17.0% - 17.5% ] 17.24% | 2,579,500 | 11.3% |
[ 17.5% - 18.0% ] 17.73% | 3,075,062 | 11.7% |
[ 18.0% - 18.5% ] 18.25% | 2,234,701 | 11.2% |
[ 18.5% - 19.0% ] 18.76% | 2,440,940 | 11.5% |
[ 19.0% - 19.5% ] 19.25% | 1,521,626 | 12.9% |
[ 19.5% - 20.0% ] 19.69% | 2,231,928 | 11.8% |
[ 20.0% - 20.5% ] 20.24% | 2,027,992 | 12.0% |
[ 20.5% - 21.0% ] 20.75% | 1,619,637 | 13.2% |
[ 21.0% - 21.5% ] 21.35% | 3,915,414 | 11.0% |
[ 21.5% - 22.0% ] 21.78% | 2,573,480 | 11.5% |
[ 22.0% - 22.5% ] 22.20% | 1,916,656 | 12.7% |
[ 22.5% - 23.0% ] 22.74% | 1,510,012 | 12.4% |
[ 23.0% - 23.5% ] 23.18% | 2,284,693 | 11.6% |
[ 23.5% - 24.0% ] 23.79% | 1,511,726 | 12.7% |
[ 24.0% - 24.5% ] 24.29% | 2,982,311 | 11.2% |
[ 24.5% - 25.0% ] 24.77% | 1,332,152 | 12.4% |
[ 25.0% - 25.5% ] 25.24% | 1,951,745 | 12.9% |
[ 25.5% - 26.0% ] 25.66% | 3,585,484 | 9.7% |
[ 26.0% - 26.5% ] 26.22% | 1,266,051 | 11.4% |
[ 26.5% - 27.0% ] 26.73% | 1,322,661 | 12.1% |
[ 27.0% - 27.5% ] 27.24% | 1,656,270 | 12.0% |
[ 27.5% - 28.0% ] 27.81% | 1,431,206 | 10.4% |
[ 28.0% - 28.5% ] 28.19% | 1,425,708 | 11.3% |
[ 28.5% - 29.0% ] 28.76% | 1,211,015 | 11.5% |
[ 29.0% - 29.5% ] 29.30% | 3,003,783 | 11.4% |
[ 29.5% - 30.0% ] 29.85% | 3,386,171 | 10.6% |
[ 30.0% - 30.5% ] 30.19% | 1,866,233 | 11.6% |
[ 30.5% - 31.0% ] 30.78% | 5,515,281 | 10.1% |
[ 31.0% - 31.5% ] 31.27% | 1,406,268 | 12.2% |
[ 31.5% - 32.0% ] 31.66% | 608,922 | 12.1% |
[ 32.0% - 32.5% ] 32.22% | 891,575 | 12.0% |
[ 32.5% - 33.0% ] 32.75% | 1,313,245 | 11.9% |
[ 33.0% - 33.5% ] 33.23% | 1,403,214 | 12.5% |
[ 33.5% - 34.0% ] 33.74% | 1,164,542 | 12.4% |
[ 34.0% - 34.5% ] 34.19% | 1,409,331 | 12.5% |
[ 34.5% - 35.0% ] 34.64% | 2,497,222 | 11.0% |
[ 35.0% - 35.5% ] 35.30% | 994,643 | 12.0% |
[ 35.5% - 36.0% ] 35.72% | 1,589,976 | 11.0% |
[ 36.0% - 36.5% ] 36.24% | 531,945 | 11.4% |
[ 36.5% - 37.0% ] 36.73% | 929,179 | 11.2% |
[ 37.0% - 37.5% ] 37.24% | 816,021 | 11.7% |
[ 37.5% - 38.0% ] 37.74% | 2,442,534 | 11.5% |
[ 38.0% - 38.5% ] 38.20% | 402,753 | 13.0% |
[ 38.5% - 39.0% ] 38.76% | 760,855 | 13.0% |
[ 39.0% - 39.5% ] 39.26% | 746,847 | 11.8% |
[ 39.5% - 40.0% ] 39.85% | 1,540,004 | 13.3% |
[ 40.0% - 40.5% ] 40.24% | 687,361 | 12.7% |
[ 40.5% - 41.0% ] 40.78% | 735,650 | 12.4% |
[ 41.0% - 41.5% ] 41.25% | 1,103,767 | 12.1% |
[ 41.5% - 42.0% ] 41.73% | 806,507 | 11.7% |
[ 42.0% - 42.5% ] 42.24% | 1,001,245 | 12.3% |
[ 42.5% - 43.0% ] 42.73% | 652,304 | 11.4% |
[ 43.0% - 43.5% ] 43.23% | 496,212 | 14.0% |
[ 43.5% - 44.0% ] 43.73% | 960,625 | 11.9% |
[ 44.0% - 44.5% ] 44.30% | 633,963 | 13.6% |
[ 44.5% - 45.0% ] 44.74% | 889,898 | 11.3% |
[ 45.0% - 45.5% ] 45.26% | 731,450 | 12.1% |
[ 45.5% - 46.0% ] 45.77% | 871,938 | 12.5% |
[ 46.0% - 46.5% ] 46.29% | 1,150,113 | 12.6% |
[ 46.5% - 47.0% ] 46.78% | 989,925 | 10.8% |
[ 47.0% - 47.5% ] 47.20% | 1,121,162 | 11.0% |
[ 47.5% - 48.0% ] 47.66% | 218,723 | 13.1% |
[ 48.0% - 48.5% ] 48.16% | 518,292 | 11.7% |
[ 48.5% - 49.0% ] 48.77% | 889,766 | 10.5% |
[ 49.0% - 49.5% ] 49.29% | 493,661 | 10.9% |
[ 49.5% - 50.0% ] 49.75% | 547,273 | 11.9% |
[ 50.0% - 50.5% ] 50.28% | 703,504 | 10.4% |
[ 50.5% - 51.0% ] 50.85% | 684,098 | 11.9% |
[ 51.0% - 51.5% ] 51.29% | 674,174 | 12.9% |
[ 51.5% - 52.0% ] 51.70% | 312,914 | 11.4% |
[ 52.0% - 52.5% ] 52.34% | 673,288 | 11.6% |
[ 52.5% - 53.0% ] 52.71% | 522,047 | 12.5% |
[ 53.0% - 53.5% ] 53.25% | 329,811 | 10.5% |
[ 53.5% - 54.0% ] 53.69% | 126,146 | 13.6% |
[ 54.0% - 54.5% ] 54.23% | 506,704 | 12.4% |
[ 54.5% - 55.0% ] 54.80% | 356,547 | 13.6% |
[ 55.0% - 55.5% ] 55.16% | 792,015 | 11.2% |
[ 55.5% - 56.0% ] 55.92% | 1,730,904 | 14.3% |
[ 56.0% - 56.5% ] 56.21% | 290,715 | 10.6% |
[ 56.5% - 57.0% ] 56.65% | 407,664 | 13.3% |
[ 57.0% - 57.5% ] 57.31% | 392,992 | 11.2% |
[ 57.5% - 58.0% ] 57.69% | 573,400 | 11.9% |
[ 58.0% - 58.5% ] 58.19% | 726,687 | 11.0% |
[ 58.5% - 59.0% ] 58.76% | 834,048 | 12.2% |
[ 59.0% - 59.5% ] 59.24% | 526,807 | 10.8% |
[ 59.5% - 60.0% ] 59.79% | 424,331 | 13.1% |
[ 60.0% - 60.5% ] 60.32% | 406,823 | 10.4% |
[ 60.5% - 61.0% ] 60.76% | 476,104 | 11.3% |
[ 61.0% - 61.5% ] 61.23% | 281,769 | 12.4% |
[ 61.5% - 62.0% ] 61.76% | 217,607 | 10.6% |
[ 62.0% - 62.5% ] 62.26% | 270,005 | 9.9% |
[ 62.5% - 63.0% ] 62.63% | 449,785 | 11.3% |
[ 63.0% - 63.5% ] 63.21% | 305,179 | 11.0% |
[ 63.5% - 64.0% ] 63.73% | 194,078 | 10.8% |
[ 64.0% - 64.5% ] 64.15% | 567,789 | 10.9% |
[ 64.5% - 65.0% ] 64.82% | 168,536 | 12.2% |
[ 65.0% - 65.5% ] 65.21% | 203,316 | 12.3% |
[ 65.5% - 66.0% ] 65.89% | 445,746 | 10.9% |
[ 66.0% - 66.5% ] 66.24% | 176,707 | 11.7% |
[ 66.5% - 67.0% ] 66.71% | 296,632 | 13.1% |
[ 67.0% - 67.5% ] 67.29% | 307,563 | 11.0% |
[ 67.5% - 68.0% ] 67.62% | 343,647 | 10.9% |
[ 68.0% - 68.5% ] 68.21% | 466,331 | 10.7% |
[ 68.5% - 69.0% ] 68.71% | 210,684 | 10.3% |
[ 69.0% - 69.5% ] 69.26% | 492,465 | 10.9% |
[ 69.5% - 70.0% ] 69.85% | 264,207 | 10.4% |
[ 70.0% - 70.5% ] 70.20% | 224,484 | 14.7% |
[ 70.5% - 71.0% ] 70.71% | 504,353 | 10.3% |
[ 71.0% - 71.5% ] 71.26% | 544,955 | 11.5% |
[ 71.5% - 72.0% ] 71.75% | 581,358 | 11.2% |
[ 72.0% - 72.5% ] 72.17% | 193,579 | 10.0% |
[ 72.5% - 73.0% ] 72.78% | 385,670 | 12.0% |
[ 73.0% - 73.5% ] 73.22% | 405,058 | 10.3% |
[ 73.5% - 74.0% ] 73.79% | 191,126 | 12.7% |
[ 74.0% - 74.5% ] 74.21% | 397,589 | 8.8% |
[ 74.5% - 75.0% ] 74.76% | 189,841 | 11.0% |
[ 75.0% - 75.5% ] 75.34% | 392,157 | 14.2% |
[ 75.5% - 76.0% ] 75.81% | 238,733 | 12.2% |
[ 76.0% - 76.5% ] 76.29% | 237,471 | 10.7% |
[ 76.5% - 77.0% ] 76.71% | 855,503 | 13.9% |
[ 77.0% - 77.5% ] 77.31% | 383,491 | 10.5% |
[ 77.5% - 78.0% ] 77.85% | 198,774 | 12.9% |
[ 78.0% - 78.5% ] 78.30% | 149,082 | 10.1% |
[ 78.5% - 79.0% ] 78.83% | 272,077 | 8.0% |
[ 79.0% - 79.5% ] 79.22% | 295,581 | 12.2% |
[ 79.5% - 80.0% ] 79.62% | 121,672 | 11.9% |
[ 80.0% - 80.5% ] 80.24% | 673,102 | 9.8% |
[ 80.5% - 81.0% ] 80.81% | 104,614 | 12.6% |
[ 81.0% - 81.5% ] 81.18% | 325,245 | 13.3% |
[ 81.5% - 82.0% ] 81.74% | 357,068 | 11.3% |
[ 82.0% - 82.5% ] 82.18% | 191,421 | 11.7% |
[ 82.5% - 83.0% ] 82.66% | 105,641 | 15.2% |
[ 83.0% - 83.5% ] 83.15% | 265,475 | 13.0% |
[ 83.5% - 84.0% ] 83.84% | 209,818 | 11.4% |
[ 84.0% - 84.5% ] 84.26% | 285,886 | 12.7% |
[ 84.5% - 85.0% ] 84.67% | 77,718 | 10.1% |
[ 85.0% - 85.5% ] 85.20% | 80,340 | 11.8% |
[ 86.0% - 86.5% ] 86.16% | 108,513 | 11.3% |
[ 86.5% - 87.0% ] 86.85% | 169,194 | 9.9% |
[ 87.0% - 87.5% ] 87.27% | 246,599 | 10.5% |
[ 87.5% - 88.0% ] 87.70% | 229,321 | 9.6% |
[ 88.0% - 88.5% ] 88.19% | 132,908 | 11.7% |
[ 88.5% - 89.0% ] 88.74% | 79,623 | 11.1% |
[ 89.0% - 89.5% ] 89.27% | 143,849 | 10.7% |
[ 89.5% - 90.0% ] 89.81% | 318,610 | 11.8% |
[ 90.0% - 90.5% ] 90.22% | 360,166 | 13.6% |
[ 90.5% - 91.0% ] 90.73% | 198,315 | 13.7% |
[ 91.0% - 91.5% ] 91.34% | 513,258 | 12.3% |
[ 91.5% - 92.0% ] 91.78% | 292,775 | 12.4% |
[ 92.0% - 92.5% ] 92.33% | 54,249 | 8.7% |
[ 92.5% - 93.0% ] 92.78% | 178,418 | 10.6% |
[ 93.0% - 93.5% ] 93.28% | 94,418 | 13.2% |
[ 93.5% - 94.0% ] 93.77% | 99,641 | 13.1% |
[ 94.0% - 94.5% ] 94.27% | 178,570 | 10.7% |
[ 94.5% - 95.0% ] 94.80% | 121,197 | 12.9% |
[ 95.0% - 95.5% ] 95.26% | 75,475 | 15.1% |
[ 95.5% - 96.0% ] 95.83% | 23,687 | 13.4% |
[ 96.0% - 96.5% ] 96.30% | 27,319 | 15.4% |
[ 96.5% - 97.0% ] 96.77% | 28,254 | 13.4% |
[ 98.5% - 99.0% ] 98.66% | 27,768 | 14.4% |
[ 99.0% - 99.5% ] 99.18% | 16,801 | 11.0% |