Immigrants from Northern Africa vs Immigrants from Nepal 2 or more Vehicles in Household

COMPARE

Immigrants from Northern Africa
Race
Ancestry
AfghanAfricanAlaska NativeAlaskan AthabascanAlbanianAleutAlsatianAmericanApacheArabArapahoArgentineanArmenianAssyrian/Chaldean/SyriacAustralianAustrianBahamianBangladeshiBarbadianBasqueBelgianBelizeanBermudanBhutaneseBlackfeetBolivianBrazilianBritishBritish West IndianBulgarianBurmeseCajunCambodianCanadianCape VerdeanCarpatho RusynCelticCentral AmericanCentral American IndianCherokeeCheyenneChickasawChileanChineseChippewaChoctawColombianColvilleComancheCosta RicanCreeCreekCroatianCrowCubanCypriotCzechCzechoslovakianDanishDelawareDominicanDutchDutch West IndianEastern EuropeanEcuadorianEgyptianEnglishEstonianEthiopianEuropeanFijianFilipinoFinnishFrenchFrench American IndianFrench CanadianGermanGerman RussianGhanaianGreekGuamanian/ChamorroGuatemalanGuyaneseHaitianHmongHonduranHopiHoumaHungarianIcelanderIndian (Asian)IndonesianInupiatIranianIraqiIrishIroquoisIsraeliItalianJamaicanJapaneseJordanianKenyanKiowaKoreanLaotianLatvianLebaneseLiberianLithuanianLumbeeLuxembourgerMacedonianMalaysianMalteseMarshalleseMenomineeMexicanMexican American IndianMongolianMoroccanNative HawaiianNavajoNepaleseNew ZealanderNicaraguanNigerianNorthern EuropeanNorwegianOkinawanOsageOttawaPaiutePakistaniPalestinianPanamanianParaguayanPennsylvania GermanPeruvianPimaPolishPortuguesePotawatomiPuebloPuerto RicanPuget Sound SalishRomanianRussianSalvadoranSamoanScandinavianScotch-IrishScottishSeminoleSenegaleseSerbianShoshoneSierra LeoneanSiouxSlavicSlovakSloveneSomaliSouth AfricanSouth AmericanSouth American IndianSoviet UnionSpaniardSpanishSpanish AmericanSpanish American IndianSri LankanSubsaharan AfricanSudaneseSwedishSwissSyrianTaiwaneseThaiTlingit-HaidaTohono O'OdhamTonganTrinidadian and TobagonianTsimshianTurkishU.S. Virgin IslanderUgandanUkrainianUruguayanUteVenezuelanVietnameseWelshWest IndianYakamaYaquiYugoslavianYumanYup'ikZimbabwean
Immigration
NonimmigrantsImmigrantsAfghanistanAfricaAlbaniaArgentinaArmeniaAsiaAustraliaAustriaBahamasBangladeshBarbadosBelarusBelgiumBelizeBoliviaBosnia and HerzegovinaBrazilBulgariaBurma/MyanmarCabo VerdeCambodiaCameroonCanadaCaribbeanCentral AmericaChileChinaColombiaCongoCosta RicaCroatiaCubaCzechoslovakiaDenmarkDominicaDominican RepublicEastern AfricaEastern AsiaEastern EuropeEcuadorEgyptEl SalvadorEnglandEritreaEthiopiaEuropeFijiFranceGermanyGhanaGreeceGrenadaGuatemalaGuyanaHaitiHondurasHong KongHungaryIndiaIndonesiaIranIraqIrelandIsraelItalyJamaicaJapanJordanKazakhstanKenyaKoreaKuwaitLaosLatin AmericaLatviaLebanonLiberiaLithuaniaMalaysiaMexicoMicronesiaMiddle AfricaMoldovaMoroccoNetherlandsNicaraguaNigeriaNorth AmericaNorth MacedoniaNorthern AfricaNorthern EuropeNorwayOceaniaPakistanPanamaPeruPhilippinesPolandPortugalRomaniaRussiaSaudi ArabiaScotlandSenegalSerbiaSierra LeoneSingaporeSomaliaSouth AfricaSouth AmericaSouth Central AsiaSouth Eastern AsiaSouthern EuropeSpainSri LankaSt. Vincent and the GrenadinesSudanSwedenSwitzerlandSyriaTaiwanThailandTrinidad and TobagoTurkeyUgandaUkraineUruguayUzbekistanVenezuelaVietnamWest IndiesWestern AfricaWestern AsiaWestern EuropeYemenZaireZimbabweAzores
Immigrants from Nepal
Race
Ancestry
AfghanAfricanAlaska NativeAlaskan AthabascanAlbanianAleutAlsatianAmericanApacheArabArapahoArgentineanArmenianAssyrian/Chaldean/SyriacAustralianAustrianBahamianBangladeshiBarbadianBasqueBelgianBelizeanBermudanBhutaneseBlackfeetBolivianBrazilianBritishBritish West IndianBulgarianBurmeseCajunCambodianCanadianCape VerdeanCarpatho RusynCelticCentral AmericanCentral American IndianCherokeeCheyenneChickasawChileanChineseChippewaChoctawColombianColvilleComancheCosta RicanCreeCreekCroatianCrowCubanCypriotCzechCzechoslovakianDanishDelawareDominicanDutchDutch West IndianEastern EuropeanEcuadorianEgyptianEnglishEstonianEthiopianEuropeanFijianFilipinoFinnishFrenchFrench American IndianFrench CanadianGermanGerman RussianGhanaianGreekGuamanian/ChamorroGuatemalanGuyaneseHaitianHmongHonduranHopiHoumaHungarianIcelanderIndian (Asian)IndonesianInupiatIranianIraqiIrishIroquoisIsraeliItalianJamaicanJapaneseJordanianKenyanKiowaKoreanLaotianLatvianLebaneseLiberianLithuanianLumbeeLuxembourgerMacedonianMalaysianMalteseMarshalleseMenomineeMexicanMexican American IndianMongolianMoroccanNative HawaiianNavajoNepaleseNew ZealanderNicaraguanNigerianNorthern EuropeanNorwegianOkinawanOsageOttawaPaiutePakistaniPalestinianPanamanianParaguayanPennsylvania GermanPeruvianPimaPolishPortuguesePotawatomiPuebloPuerto RicanPuget Sound SalishRomanianRussianSalvadoranSamoanScandinavianScotch-IrishScottishSeminoleSenegaleseSerbianShoshoneSierra LeoneanSiouxSlavicSlovakSloveneSomaliSouth AfricanSouth AmericanSouth American IndianSoviet UnionSpaniardSpanishSpanish AmericanSpanish American IndianSri LankanSubsaharan AfricanSudaneseSwedishSwissSyrianTaiwaneseThaiTlingit-HaidaTohono O'OdhamTonganTrinidadian and TobagonianTsimshianTurkishU.S. Virgin IslanderUgandanUkrainianUruguayanUteVenezuelanVietnameseWelshWest IndianYakamaYaquiYugoslavianYumanYup'ikZimbabwean
Immigration
NonimmigrantsImmigrantsAfghanistanAfricaAlbaniaArgentinaArmeniaAsiaAustraliaAustriaBahamasBangladeshBarbadosBelarusBelgiumBelizeBoliviaBosnia and HerzegovinaBrazilBulgariaBurma/MyanmarCabo VerdeCambodiaCameroonCanadaCaribbeanCentral AmericaChileChinaColombiaCongoCosta RicaCroatiaCubaCzechoslovakiaDenmarkDominicaDominican RepublicEastern AfricaEastern AsiaEastern EuropeEcuadorEgyptEl SalvadorEnglandEritreaEthiopiaEuropeFijiFranceGermanyGhanaGreeceGrenadaGuatemalaGuyanaHaitiHondurasHong KongHungaryIndiaIndonesiaIranIraqIrelandIsraelItalyJamaicaJapanJordanKazakhstanKenyaKoreaKuwaitLaosLatin AmericaLatviaLebanonLiberiaLithuaniaMalaysiaMexicoMicronesiaMiddle AfricaMoldovaMoroccoNepalNetherlandsNicaraguaNigeriaNorth AmericaNorth MacedoniaNorthern EuropeNorwayOceaniaPakistanPanamaPeruPhilippinesPolandPortugalRomaniaRussiaSaudi ArabiaScotlandSenegalSerbiaSierra LeoneSingaporeSomaliaSouth AfricaSouth AmericaSouth Central AsiaSouth Eastern AsiaSouthern EuropeSpainSri LankaSt. Vincent and the GrenadinesSudanSwedenSwitzerlandSyriaTaiwanThailandTrinidad and TobagoTurkeyUgandaUkraineUruguayUzbekistanVenezuelaVietnamWest IndiesWestern AfricaWestern AsiaWestern EuropeYemenZaireZimbabweAzores
2 or more Vehicles in Household
Income
Poverty
Unemployment
Labor Participation
Family Structure
Vehicle Availability
Education Level
Disability

2 or more Vehicles in Household Comparison

Immigrants from Northern Africa

Immigrants from Nepal

Tragic
Tragic
52.3%
2 OR MORE VEHICLES IN HOUSEHOLD
0.4/ 100
METRIC RATING
262nd/ 347
METRIC RANK
53.5%
2 OR MORE VEHICLES IN HOUSEHOLD
3.6/ 100
METRIC RATING
230th/ 347
METRIC RANK

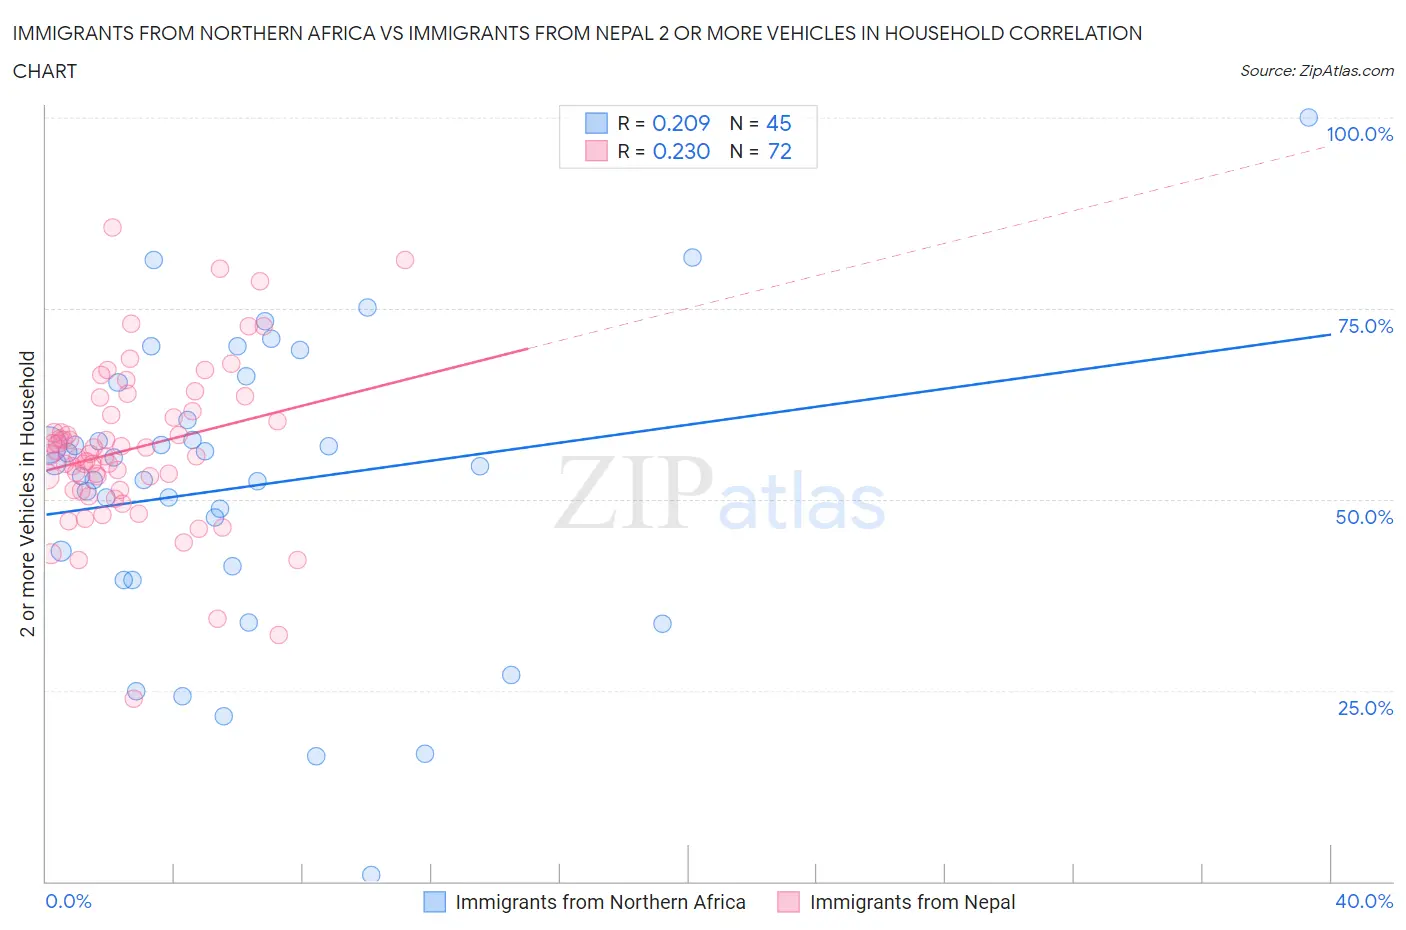
Immigrants from Northern Africa vs Immigrants from Nepal 2 or more Vehicles in Household Correlation Chart

The statistical analysis conducted on geographies consisting of 321,098,836 people shows a weak positive correlation between the proportion of Immigrants from Northern Africa and percentage of households with 2 or more vehicles available in the United States with a correlation coefficient (R) of 0.209 and weighted average of 52.3%. Similarly, the statistical analysis conducted on geographies consisting of 186,595,631 people shows a weak positive correlation between the proportion of Immigrants from Nepal and percentage of households with 2 or more vehicles available in the United States with a correlation coefficient (R) of 0.230 and weighted average of 53.5%, a difference of 2.3%.
Immigrants from Northern Africa vs Immigrants from Nepal 2 or more Vehicles in Household

2 or more Vehicles in Household Correlation Summary

MeasurementImmigrants from Northern AfricaImmigrants from Nepal
Minimum0.83%23.8%
Maximum100.0%85.6%
Range99.2%61.8%
Mean51.7%56.7%
Median54.3%55.9%
Interquartile 25% (IQ1)40.4%51.2%
Interquartile 75% (IQ3)62.8%61.3%
Interquartile Range (IQR)22.4%10.1%
Standard Deviation (Sample)19.3%10.6%
Standard Deviation (Population)19.1%10.5%

Similar Demographics by 2 or more Vehicles in Household

Demographics Similar to Immigrants from Northern Africa by 2 or more Vehicles in Household

In terms of 2 or more vehicles in household, the demographic groups most similar to Immigrants from Northern Africa are Immigrants from Southern Europe (52.3%, a difference of 0.13%), Immigrants from Latvia (52.2%, a difference of 0.17%), Immigrants from Australia (52.4%, a difference of 0.20%), Immigrants from Bahamas (52.5%, a difference of 0.23%), and Alsatian (52.5%, a difference of 0.30%).
DemographicsRating | Rank2 or more Vehicles in Household
Uruguayans
0.7
/100
|
#255
Tragic
52.7%
Immigrants | Eritrea
0.7
/100
|
#256
Tragic
52.6%
Immigrants | Hong Kong
0.6
/100
|
#257
Tragic
52.6%
Central American Indians
0.6
/100
|
#258
Tragic
52.5%
Alsatians
0.6
/100
|
#259
Tragic
52.5%
Immigrants | Bahamas
0.5
/100
|
#260
Tragic
52.5%
Immigrants | Australia
0.5
/100
|
#261
Tragic
52.4%
Immigrants | Northern Africa
0.4
/100
|
#262
Tragic
52.3%
Immigrants | Southern Europe
0.4
/100
|
#263
Tragic
52.3%
Immigrants | Latvia
0.4
/100
|
#264
Tragic
52.2%
Immigrants | Congo
0.3
/100
|
#265
Tragic
52.1%
Immigrants | France
0.2
/100
|
#266
Tragic
52.0%
Immigrants | Colombia
0.2
/100
|
#267
Tragic
52.0%
Pima
0.2
/100
|
#268
Tragic
52.0%
Hondurans
0.2
/100
|
#269
Tragic
52.0%

Demographics Similar to Immigrants from Nepal by 2 or more Vehicles in Household

In terms of 2 or more vehicles in household, the demographic groups most similar to Immigrants from Nepal are Panamanian (53.5%, a difference of 0.050%), Immigrants from Turkey (53.6%, a difference of 0.060%), Alaska Native (53.6%, a difference of 0.080%), Immigrants from Guatemala (53.5%, a difference of 0.12%), and Ugandan (53.5%, a difference of 0.13%).
DemographicsRating | Rank2 or more Vehicles in Household
Immigrants | Bosnia and Herzegovina
5.5
/100
|
#223
Tragic
53.8%
Brazilians
5.3
/100
|
#224
Tragic
53.8%
Immigrants | Egypt
5.2
/100
|
#225
Tragic
53.8%
Immigrants | Eastern Africa
5.1
/100
|
#226
Tragic
53.7%
Sudanese
4.1
/100
|
#227
Tragic
53.6%
Alaska Natives
3.9
/100
|
#228
Tragic
53.6%
Immigrants | Turkey
3.8
/100
|
#229
Tragic
53.6%
Immigrants | Nepal
3.6
/100
|
#230
Tragic
53.5%
Panamanians
3.4
/100
|
#231
Tragic
53.5%
Immigrants | Guatemala
3.2
/100
|
#232
Tragic
53.5%
Ugandans
3.2
/100
|
#233
Tragic
53.5%
Immigrants | Switzerland
3.0
/100
|
#234
Tragic
53.4%
Immigrants | Middle Africa
3.0
/100
|
#235
Tragic
53.4%
Indonesians
2.7
/100
|
#236
Tragic
53.4%
Macedonians
2.4
/100
|
#237
Tragic
53.3%