Arapaho Male Disability
COMPARE
Arapaho
Select to Compare
Male Disability
Arapaho Male Disability
13.3%
DISABILITY | MALES
0.0/ 100
METRIC RATING
307th/ 347
METRIC RANK
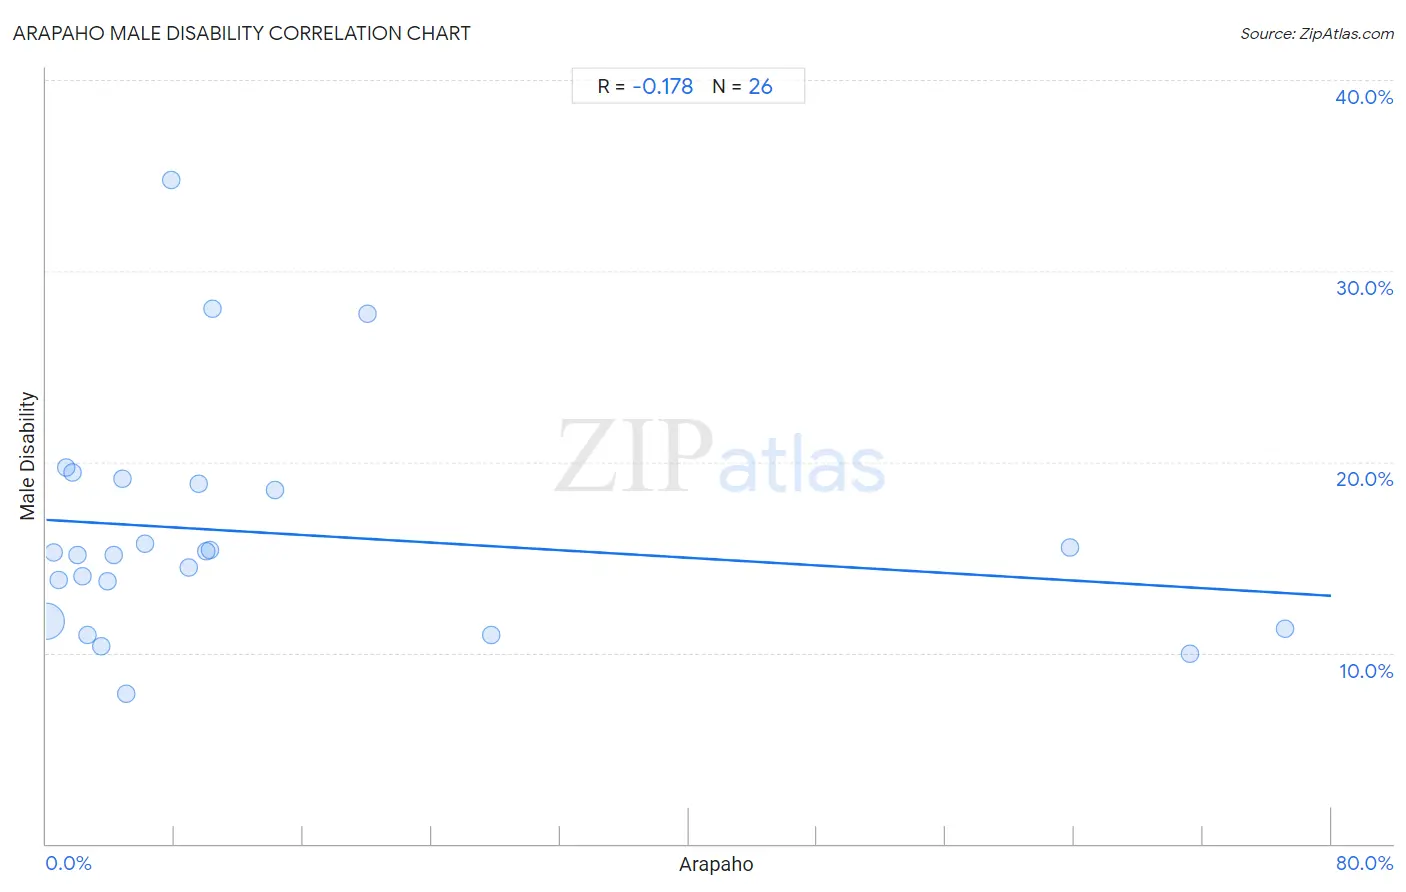
Arapaho Male Disability Correlation Chart
The statistical analysis conducted on geographies consisting of 29,780,236 people shows a poor negative correlation between the proportion of Arapaho and percentage of males with a disability in the United States with a correlation coefficient (R) of -0.178 and weighted average of 13.3%. On average, for every 1% (one percent) increase in Arapaho within a typical geography, there is a decrease of 0.050% in percentage of males with a disability.
It is essential to understand that the correlation between the percentage of Arapaho and percentage of males with a disability does not imply a direct cause-and-effect relationship. It remains uncertain whether the presence of Arapaho influences an upward or downward trend in the level of percentage of males with a disability within an area, or if Arapaho simply ended up residing in those areas with higher or lower levels of percentage of males with a disability due to other factors.
Demographics Similar to Arapaho by Male Disability
In terms of male disability, the demographic groups most similar to Arapaho are French American Indian (13.4%, a difference of 0.15%), Spanish American (13.3%, a difference of 0.22%), French Canadian (13.3%, a difference of 0.42%), Blackfeet (13.4%, a difference of 0.58%), and Immigrants from the Azores (13.4%, a difference of 0.72%).
| Demographics | Rating | Rank | Male Disability |
| Cheyenne | 0.0 /100 | #300 | Tragic 13.0% |
| French | 0.0 /100 | #301 | Tragic 13.0% |
| Crow | 0.0 /100 | #302 | Tragic 13.1% |
| Scotch-Irish | 0.0 /100 | #303 | Tragic 13.2% |
| Blacks/African Americans | 0.0 /100 | #304 | Tragic 13.2% |
| French Canadians | 0.0 /100 | #305 | Tragic 13.3% |
| Spanish Americans | 0.0 /100 | #306 | Tragic 13.3% |
| Arapaho | 0.0 /100 | #307 | Tragic 13.3% |
| French American Indians | 0.0 /100 | #308 | Tragic 13.4% |
| Blackfeet | 0.0 /100 | #309 | Tragic 13.4% |
| Immigrants from the Azores | 0.0 /100 | #310 | Tragic 13.4% |
| Delaware | 0.0 /100 | #311 | Tragic 13.5% |
| Yakama | 0.0 /100 | #312 | Tragic 13.5% |
| Puget Sound Salish | 0.0 /100 | #313 | Tragic 13.5% |
| Aleuts | 0.0 /100 | #314 | Tragic 13.5% |
Arapaho Male Disability Correlation Summary
| Measurement | Arapaho Data | Male Disability Data |
| Minimum | 0.025% | 7.9% |
| Maximum | 77.1% | 34.7% |
| Range | 77.1% | 26.9% |
| Mean | 14.2% | 16.3% |
| Median | 5.6% | 15.2% |
| Interquartile 25% (IQ1) | 2.3% | 11.6% |
| Interquartile 75% (IQ3) | 10.3% | 18.8% |
| Interquartile Range (IQR) | 8.1% | 7.2% |
| Standard Deviation (Sample) | 21.8% | 6.1% |
| Standard Deviation (Population) | 21.4% | 6.0% |
Correlation Details
| Arapaho Percentile | Sample Size | Male Disability |
[ 0.0% - 0.5% ] 0.025% | 29,358,436 | 11.6% |
[ 0.0% - 0.5% ] 0.48% | 195,391 | 15.3% |
[ 0.5% - 1.0% ] 0.81% | 102,518 | 13.8% |
[ 1.0% - 1.5% ] 1.22% | 21,648 | 19.7% |
[ 1.5% - 2.0% ] 1.62% | 13,915 | 19.5% |
[ 1.5% - 2.0% ] 1.95% | 10,849 | 15.1% |
[ 2.0% - 2.5% ] 2.27% | 5,913 | 14.0% |
[ 2.5% - 3.0% ] 2.57% | 1,440 | 11.0% |
[ 3.0% - 3.5% ] 3.43% | 5,514 | 10.4% |
[ 3.5% - 4.0% ] 3.83% | 574 | 13.8% |
[ 4.0% - 4.5% ] 4.18% | 8,010 | 15.1% |
[ 4.5% - 5.0% ] 4.73% | 993 | 19.1% |
[ 5.0% - 5.5% ] 5.01% | 3,093 | 7.9% |
[ 6.0% - 6.5% ] 6.17% | 10,733 | 15.7% |
[ 7.5% - 8.0% ] 7.77% | 283 | 34.7% |
[ 8.5% - 9.0% ] 8.89% | 596 | 14.5% |
[ 9.0% - 9.5% ] 9.48% | 3,122 | 18.8% |
[ 9.5% - 10.0% ] 9.96% | 18,898 | 15.3% |
[ 10.0% - 10.5% ] 10.18% | 13,248 | 15.4% |
[ 10.0% - 10.5% ] 10.34% | 58 | 28.0% |
[ 14.0% - 14.5% ] 14.23% | 513 | 18.5% |
[ 20.0% - 20.5% ] 20.00% | 30 | 27.8% |
[ 27.5% - 28.0% ] 27.72% | 285 | 10.9% |
[ 63.5% - 64.0% ] 63.72% | 1,596 | 15.5% |
[ 71.0% - 71.5% ] 71.24% | 1,471 | 10.0% |
[ 77.0% - 77.5% ] 77.10% | 1,109 | 11.2% |