Nicaraguan vs Cape Verdean Unemployment Among Women with Children Ages 6 to 17 years

COMPARE

Nicaraguan
Race
Ancestry
AfghanAfricanAlaska NativeAlaskan AthabascanAlbanianAleutAlsatianAmericanApacheArabArapahoArgentineanArmenianAssyrian/Chaldean/SyriacAustralianAustrianBahamianBangladeshiBarbadianBasqueBelgianBelizeanBermudanBhutaneseBlackfeetBolivianBrazilianBritishBritish West IndianBulgarianBurmeseCajunCambodianCanadianCarpatho RusynCelticCentral AmericanCentral American IndianCherokeeCheyenneChickasawChileanChineseChippewaChoctawColombianColvilleComancheCosta RicanCreeCreekCroatianCrowCubanCypriotCzechCzechoslovakianDanishDelawareDominicanDutchDutch West IndianEastern EuropeanEcuadorianEgyptianEnglishEstonianEthiopianEuropeanFijianFilipinoFinnishFrenchFrench American IndianFrench CanadianGermanGerman RussianGhanaianGreekGuamanian/ChamorroGuatemalanGuyaneseHaitianHmongHonduranHopiHoumaHungarianIcelanderIndian (Asian)IndonesianInupiatIranianIraqiIrishIroquoisIsraeliItalianJamaicanJapaneseJordanianKenyanKiowaKoreanLaotianLatvianLebaneseLiberianLithuanianLumbeeLuxembourgerMacedonianMalaysianMalteseMarshalleseMenomineeMexicanMexican American IndianMongolianMoroccanNative HawaiianNavajoNepaleseNew ZealanderNicaraguanNigerianNorthern EuropeanNorwegianOkinawanOsageOttawaPaiutePakistaniPalestinianPanamanianParaguayanPennsylvania GermanPeruvianPimaPolishPortuguesePotawatomiPuebloPuerto RicanPuget Sound SalishRomanianRussianSalvadoranSamoanScandinavianScotch-IrishScottishSeminoleSenegaleseSerbianShoshoneSierra LeoneanSiouxSlavicSlovakSloveneSomaliSouth AfricanSouth AmericanSouth American IndianSoviet UnionSpaniardSpanishSpanish AmericanSpanish American IndianSri LankanSubsaharan AfricanSudaneseSwedishSwissSyrianTaiwaneseThaiTlingit-HaidaTohono O'OdhamTonganTrinidadian and TobagonianTsimshianTurkishU.S. Virgin IslanderUgandanUkrainianUruguayanUteVenezuelanVietnameseWelshWest IndianYakamaYaquiYugoslavianYumanYup'ikZimbabwean
Immigration
NonimmigrantsImmigrantsAfghanistanAfricaAlbaniaArgentinaArmeniaAsiaAustraliaAustriaBahamasBangladeshBarbadosBelarusBelgiumBelizeBoliviaBosnia and HerzegovinaBrazilBulgariaBurma/MyanmarCabo VerdeCambodiaCameroonCanadaCaribbeanCentral AmericaChileChinaColombiaCongoCosta RicaCroatiaCubaCzechoslovakiaDenmarkDominicaDominican RepublicEastern AfricaEastern AsiaEastern EuropeEcuadorEgyptEl SalvadorEnglandEritreaEthiopiaEuropeFijiFranceGermanyGhanaGreeceGrenadaGuatemalaGuyanaHaitiHondurasHong KongHungaryIndiaIndonesiaIranIraqIrelandIsraelItalyJamaicaJapanJordanKazakhstanKenyaKoreaKuwaitLaosLatin AmericaLatviaLebanonLiberiaLithuaniaMalaysiaMexicoMicronesiaMiddle AfricaMoldovaMoroccoNepalNetherlandsNicaraguaNigeriaNorth AmericaNorth MacedoniaNorthern AfricaNorthern EuropeNorwayOceaniaPakistanPanamaPeruPhilippinesPolandPortugalRomaniaRussiaSaudi ArabiaScotlandSenegalSerbiaSierra LeoneSingaporeSomaliaSouth AfricaSouth AmericaSouth Central AsiaSouth Eastern AsiaSouthern EuropeSpainSri LankaSt. Vincent and the GrenadinesSudanSwedenSwitzerlandSyriaTaiwanThailandTrinidad and TobagoTurkeyUgandaUkraineUruguayUzbekistanVenezuelaVietnamWest IndiesWestern AfricaWestern AsiaWestern EuropeYemenZaireZimbabweAzores
Cape Verdean
Race
Ancestry
AfghanAfricanAlaska NativeAlaskan AthabascanAlbanianAleutAlsatianAmericanApacheArabArapahoArgentineanArmenianAssyrian/Chaldean/SyriacAustralianAustrianBahamianBangladeshiBarbadianBasqueBelgianBelizeanBermudanBhutaneseBlackfeetBolivianBrazilianBritishBritish West IndianBulgarianBurmeseCajunCambodianCanadianCape VerdeanCarpatho RusynCelticCentral AmericanCentral American IndianCherokeeCheyenneChickasawChileanChineseChippewaChoctawColombianColvilleComancheCosta RicanCreeCreekCroatianCrowCubanCypriotCzechCzechoslovakianDanishDelawareDominicanDutchDutch West IndianEastern EuropeanEcuadorianEgyptianEnglishEstonianEthiopianEuropeanFijianFilipinoFinnishFrenchFrench American IndianFrench CanadianGermanGerman RussianGhanaianGreekGuamanian/ChamorroGuatemalanGuyaneseHaitianHmongHonduranHopiHoumaHungarianIcelanderIndian (Asian)IndonesianInupiatIranianIraqiIrishIroquoisIsraeliItalianJamaicanJapaneseJordanianKenyanKiowaKoreanLaotianLatvianLebaneseLiberianLithuanianLumbeeLuxembourgerMacedonianMalaysianMalteseMarshalleseMenomineeMexicanMexican American IndianMongolianMoroccanNative HawaiianNavajoNepaleseNew ZealanderNigerianNorthern EuropeanNorwegianOkinawanOsageOttawaPaiutePakistaniPalestinianPanamanianParaguayanPennsylvania GermanPeruvianPimaPolishPortuguesePotawatomiPuebloPuerto RicanPuget Sound SalishRomanianRussianSalvadoranSamoanScandinavianScotch-IrishScottishSeminoleSenegaleseSerbianShoshoneSierra LeoneanSiouxSlavicSlovakSloveneSomaliSouth AfricanSouth AmericanSouth American IndianSoviet UnionSpaniardSpanishSpanish AmericanSpanish American IndianSri LankanSubsaharan AfricanSudaneseSwedishSwissSyrianTaiwaneseThaiTlingit-HaidaTohono O'OdhamTonganTrinidadian and TobagonianTsimshianTurkishU.S. Virgin IslanderUgandanUkrainianUruguayanUteVenezuelanVietnameseWelshWest IndianYakamaYaquiYugoslavianYumanYup'ikZimbabwean
Immigration
NonimmigrantsImmigrantsAfghanistanAfricaAlbaniaArgentinaArmeniaAsiaAustraliaAustriaBahamasBangladeshBarbadosBelarusBelgiumBelizeBoliviaBosnia and HerzegovinaBrazilBulgariaBurma/MyanmarCabo VerdeCambodiaCameroonCanadaCaribbeanCentral AmericaChileChinaColombiaCongoCosta RicaCroatiaCubaCzechoslovakiaDenmarkDominicaDominican RepublicEastern AfricaEastern AsiaEastern EuropeEcuadorEgyptEl SalvadorEnglandEritreaEthiopiaEuropeFijiFranceGermanyGhanaGreeceGrenadaGuatemalaGuyanaHaitiHondurasHong KongHungaryIndiaIndonesiaIranIraqIrelandIsraelItalyJamaicaJapanJordanKazakhstanKenyaKoreaKuwaitLaosLatin AmericaLatviaLebanonLiberiaLithuaniaMalaysiaMexicoMicronesiaMiddle AfricaMoldovaMoroccoNepalNetherlandsNicaraguaNigeriaNorth AmericaNorth MacedoniaNorthern AfricaNorthern EuropeNorwayOceaniaPakistanPanamaPeruPhilippinesPolandPortugalRomaniaRussiaSaudi ArabiaScotlandSenegalSerbiaSierra LeoneSingaporeSomaliaSouth AfricaSouth AmericaSouth Central AsiaSouth Eastern AsiaSouthern EuropeSpainSri LankaSt. Vincent and the GrenadinesSudanSwedenSwitzerlandSyriaTaiwanThailandTrinidad and TobagoTurkeyUgandaUkraineUruguayUzbekistanVenezuelaVietnamWest IndiesWestern AfricaWestern AsiaWestern EuropeYemenZaireZimbabweAzores
Unemployment Among Women with Children Ages 6 to 17 years
Income
Poverty
Unemployment
Labor Participation
Family Structure
Vehicle Availability
Education Level
Disability

Unemployment Among Women with Children Ages 6 to 17 years Comparison

Nicaraguans

Cape Verdeans

Tragic
Tragic
9.4%
UNEMPLOYMENT AMONG WOMEN WITH CHILDREN AGES 6 TO 17 YEARS
1.0/ 100
METRIC RATING
254th/ 347
METRIC RANK
10.9%
UNEMPLOYMENT AMONG WOMEN WITH CHILDREN AGES 6 TO 17 YEARS
0.0/ 100
METRIC RATING
327th/ 347
METRIC RANK

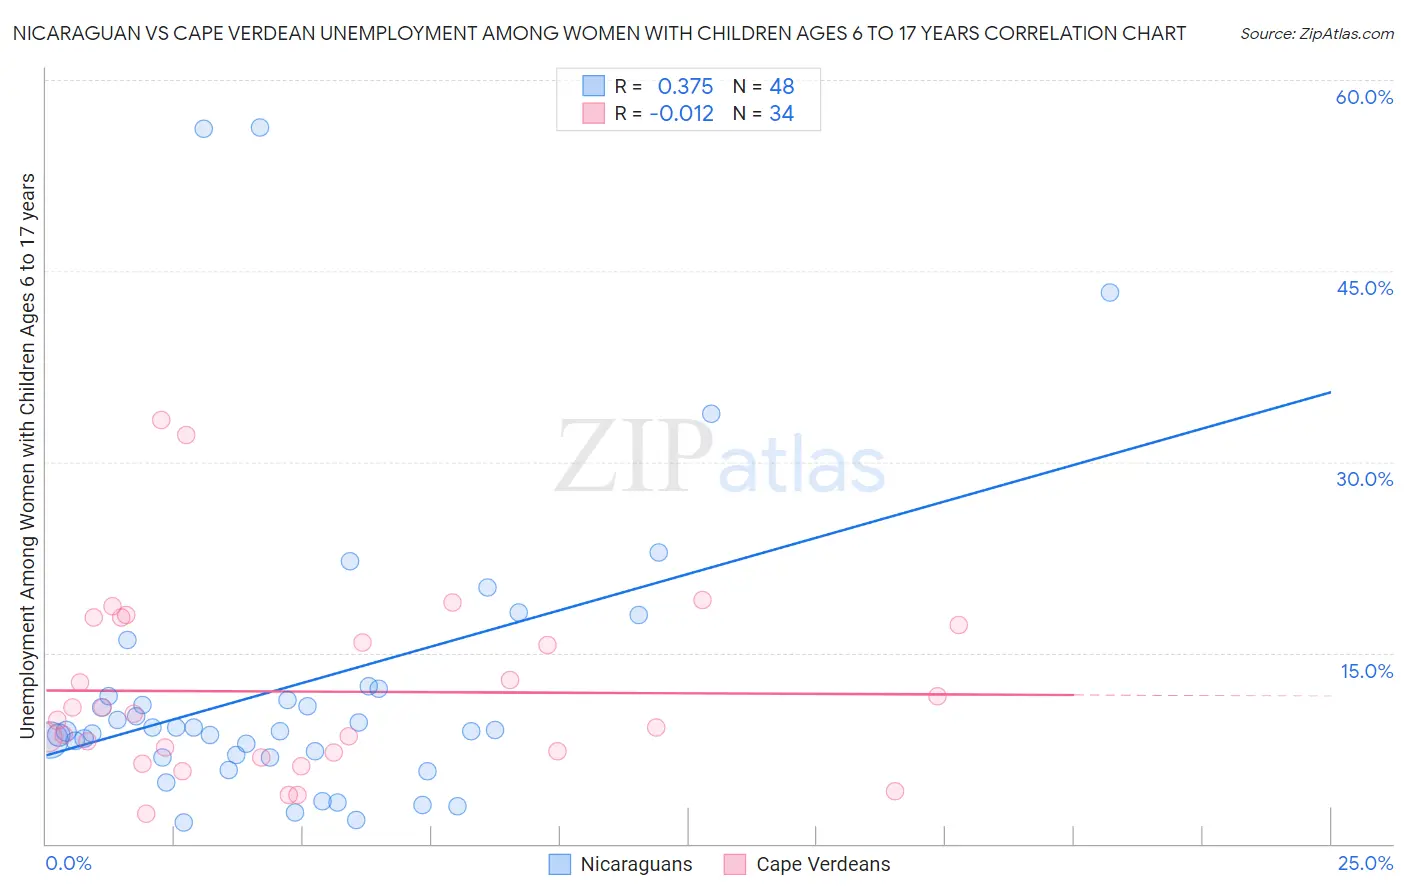
Nicaraguan vs Cape Verdean Unemployment Among Women with Children Ages 6 to 17 years Correlation Chart

The statistical analysis conducted on geographies consisting of 225,411,193 people shows a mild positive correlation between the proportion of Nicaraguans and unemployment rate among women with children between the ages 6 and 17 in the United States with a correlation coefficient (R) of 0.375 and weighted average of 9.4%. Similarly, the statistical analysis conducted on geographies consisting of 93,873,663 people shows no correlation between the proportion of Cape Verdeans and unemployment rate among women with children between the ages 6 and 17 in the United States with a correlation coefficient (R) of -0.012 and weighted average of 10.9%, a difference of 15.2%.
Nicaraguan vs Cape Verdean Unemployment Among Women with Children Ages 6 to 17 years

Unemployment Among Women with Children Ages 6 to 17 years Correlation Summary

MeasurementNicaraguanCape Verdean
Minimum1.6%2.4%
Maximum56.3%33.3%
Range54.7%30.9%
Mean12.5%11.9%
Median8.9%10.0%
Interquartile 25% (IQ1)6.9%7.2%
Interquartile 75% (IQ3)11.9%17.2%
Interquartile Range (IQR)5.0%10.0%
Standard Deviation (Sample)12.0%7.2%
Standard Deviation (Population)11.9%7.1%

Similar Demographics by Unemployment Among Women with Children Ages 6 to 17 years

Demographics Similar to Nicaraguans by Unemployment Among Women with Children Ages 6 to 17 years

In terms of unemployment among women with children ages 6 to 17 years, the demographic groups most similar to Nicaraguans are Lithuanian (9.4%, a difference of 0.060%), Portuguese (9.4%, a difference of 0.17%), Canadian (9.4%, a difference of 0.23%), Creek (9.4%, a difference of 0.26%), and Celtic (9.5%, a difference of 0.26%).
DemographicsRating | RankUnemployment Among Women with Children Ages 6 to 17 years
Poles
1.5
/100
|
#247
Tragic
9.4%
Dutch
1.5
/100
|
#248
Tragic
9.4%
Immigrants | South America
1.5
/100
|
#249
Tragic
9.4%
Immigrants | Guatemala
1.3
/100
|
#250
Tragic
9.4%
Central Americans
1.3
/100
|
#251
Tragic
9.4%
Creek
1.2
/100
|
#252
Tragic
9.4%
Portuguese
1.1
/100
|
#253
Tragic
9.4%
Nicaraguans
1.0
/100
|
#254
Tragic
9.4%
Lithuanians
0.9
/100
|
#255
Tragic
9.4%
Canadians
0.8
/100
|
#256
Tragic
9.4%
Celtics
0.7
/100
|
#257
Tragic
9.5%
Immigrants | Mexico
0.7
/100
|
#258
Tragic
9.5%
Immigrants | Central America
0.6
/100
|
#259
Tragic
9.5%
Italians
0.6
/100
|
#260
Tragic
9.5%
South Americans
0.5
/100
|
#261
Tragic
9.5%

Demographics Similar to Cape Verdeans by Unemployment Among Women with Children Ages 6 to 17 years

In terms of unemployment among women with children ages 6 to 17 years, the demographic groups most similar to Cape Verdeans are Liberian (10.8%, a difference of 0.070%), Cajun (10.8%, a difference of 0.13%), Ottawa (10.9%, a difference of 0.14%), Immigrants from Dominican Republic (10.8%, a difference of 0.32%), and Dominican (10.8%, a difference of 0.38%).
DemographicsRating | RankUnemployment Among Women with Children Ages 6 to 17 years
Apache
0.0
/100
|
#320
Tragic
10.7%
Tohono O'odham
0.0
/100
|
#321
Tragic
10.7%
Cree
0.0
/100
|
#322
Tragic
10.8%
Dominicans
0.0
/100
|
#323
Tragic
10.8%
Immigrants | Dominican Republic
0.0
/100
|
#324
Tragic
10.8%
Cajuns
0.0
/100
|
#325
Tragic
10.8%
Liberians
0.0
/100
|
#326
Tragic
10.8%
Cape Verdeans
0.0
/100
|
#327
Tragic
10.9%
Ottawa
0.0
/100
|
#328
Tragic
10.9%
Pennsylvania Germans
0.0
/100
|
#329
Tragic
11.0%
Chippewa
0.0
/100
|
#330
Tragic
11.1%
Blacks/African Americans
0.0
/100
|
#331
Tragic
11.4%
Tsimshian
0.0
/100
|
#332
Tragic
11.4%
Natives/Alaskans
0.0
/100
|
#333
Tragic
11.5%
Ugandans
0.0
/100
|
#334
Tragic
12.0%