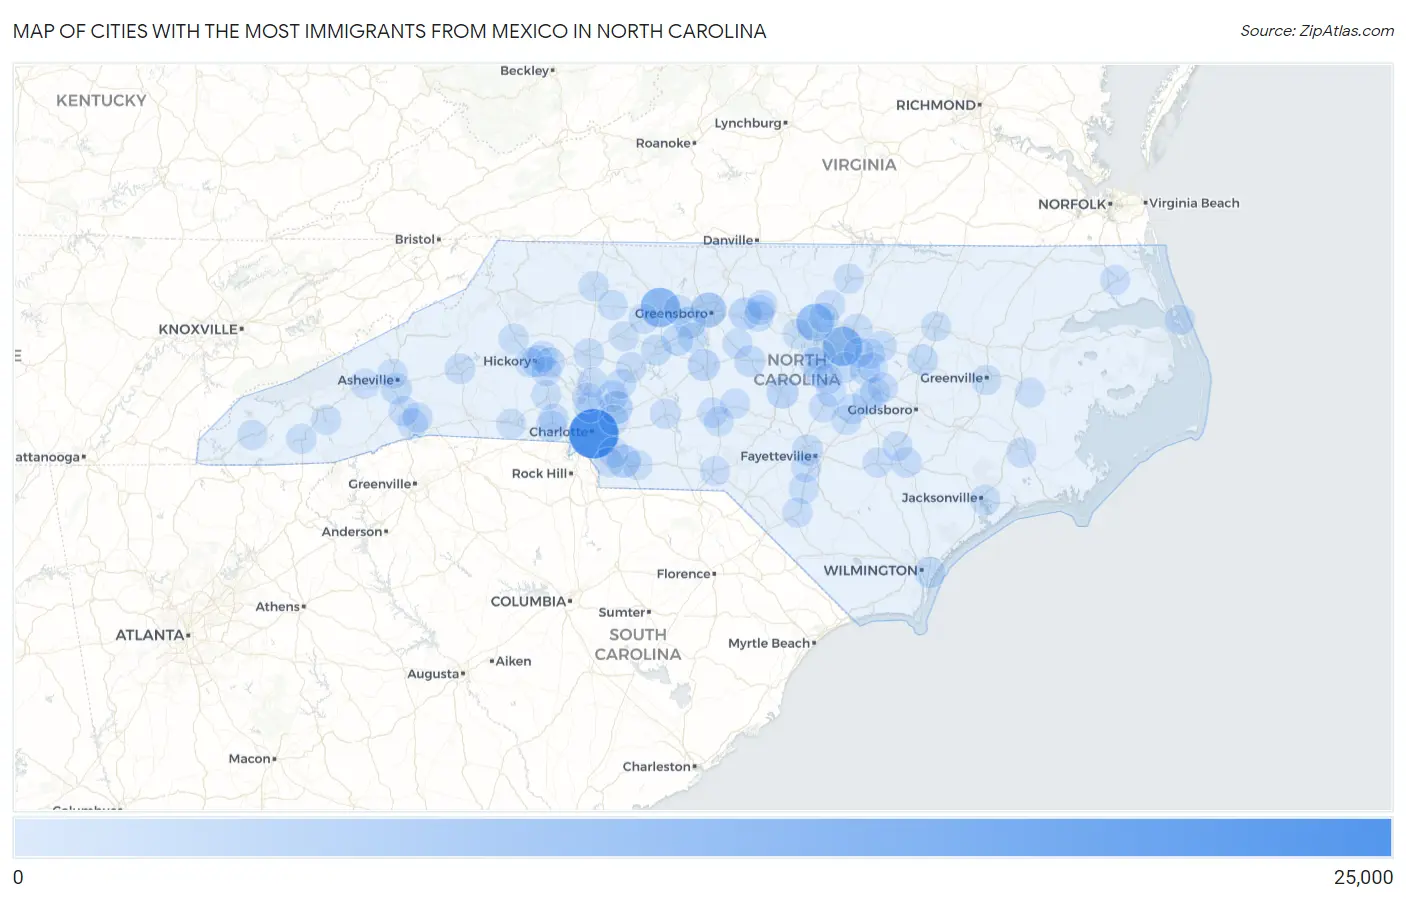
Cities with the Most Immigrants from Mexico in North Carolina
RELATED REPORTS & OPTIONS
Mexico
North Carolina
Compare Cities
Map of Cities with the Most Immigrants from Mexico in North Carolina
0
25,000
Cities with the Most Immigrants from Mexico in North Carolina
| City | Mexico | vs State | vs National | |
| 1. | Charlotte | 21,823 | 214,776(10.16%)#1 | 10,767,104(0.20%)#59 |
| 2. | Winston Salem | 10,293 | 214,776(4.79%)#2 | 10,767,104(0.10%)#141 |
| 3. | Raleigh | 10,047 | 214,776(4.68%)#3 | 10,767,104(0.09%)#144 |
| 4. | Durham | 7,858 | 214,776(3.66%)#4 | 10,767,104(0.07%)#188 |
| 5. | Greensboro | 5,322 | 214,776(2.48%)#5 | 10,767,104(0.05%)#282 |
| 6. | Monroe | 3,367 | 214,776(1.57%)#6 | 10,767,104(0.03%)#455 |
| 7. | Concord | 3,118 | 214,776(1.45%)#7 | 10,767,104(0.03%)#482 |
| 8. | Burlington | 2,605 | 214,776(1.21%)#8 | 10,767,104(0.02%)#563 |
| 9. | Sanford | 2,348 | 214,776(1.09%)#9 | 10,767,104(0.02%)#623 |
| 10. | Asheboro | 2,286 | 214,776(1.06%)#10 | 10,767,104(0.02%)#638 |
| 11. | High Point | 1,996 | 214,776(0.93%)#11 | 10,767,104(0.02%)#713 |
| 12. | Hickory | 1,777 | 214,776(0.83%)#12 | 10,767,104(0.02%)#778 |
| 13. | Cary | 1,626 | 214,776(0.76%)#13 | 10,767,104(0.02%)#837 |
| 14. | Thomasville | 1,543 | 214,776(0.72%)#14 | 10,767,104(0.01%)#858 |
| 15. | Siler City | 1,483 | 214,776(0.69%)#15 | 10,767,104(0.01%)#883 |
| 16. | Kannapolis | 1,452 | 214,776(0.68%)#16 | 10,767,104(0.01%)#895 |
| 17. | Asheville | 1,337 | 214,776(0.62%)#17 | 10,767,104(0.01%)#952 |
| 18. | Gastonia | 1,320 | 214,776(0.61%)#18 | 10,767,104(0.01%)#959 |
| 19. | Wilson | 1,287 | 214,776(0.60%)#19 | 10,767,104(0.01%)#973 |
| 20. | Fayetteville | 1,229 | 214,776(0.57%)#20 | 10,767,104(0.01%)#1,003 |
| 21. | Wilmington | 1,228 | 214,776(0.57%)#21 | 10,767,104(0.01%)#1,005 |
| 22. | Lexington | 1,012 | 214,776(0.47%)#22 | 10,767,104(0.01%)#1,153 |
| 23. | Zebulon | 971 | 214,776(0.45%)#23 | 10,767,104(0.01%)#1,193 |
| 24. | Garner | 933 | 214,776(0.43%)#24 | 10,767,104(0.01%)#1,232 |
| 25. | Statesville | 852 | 214,776(0.40%)#25 | 10,767,104(0.01%)#1,316 |
| 26. | Jacksonville | 710 | 214,776(0.33%)#26 | 10,767,104(0.01%)#1,495 |
| 27. | Indian Trail | 706 | 214,776(0.33%)#27 | 10,767,104(0.01%)#1,504 |
| 28. | Marion | 681 | 214,776(0.32%)#28 | 10,767,104(0.01%)#1,559 |
| 29. | Warsaw | 664 | 214,776(0.31%)#29 | 10,767,104(0.01%)#1,586 |
| 30. | Clayton | 647 | 214,776(0.30%)#30 | 10,767,104(0.01%)#1,612 |
| 31. | Graham | 647 | 214,776(0.30%)#31 | 10,767,104(0.01%)#1,614 |
| 32. | St Stephens | 636 | 214,776(0.30%)#32 | 10,767,104(0.01%)#1,639 |
| 33. | Salisbury | 616 | 214,776(0.29%)#33 | 10,767,104(0.01%)#1,671 |
| 34. | East Flat Rock | 564 | 214,776(0.26%)#34 | 10,767,104(0.01%)#1,771 |
| 35. | Mountain Home | 539 | 214,776(0.25%)#35 | 10,767,104(0.01%)#1,832 |
| 36. | Butner | 537 | 214,776(0.25%)#36 | 10,767,104(0.00%)#1,842 |
| 37. | Apex | 525 | 214,776(0.24%)#37 | 10,767,104(0.00%)#1,866 |
| 38. | Huntersville | 461 | 214,776(0.21%)#38 | 10,767,104(0.00%)#2,024 |
| 39. | Dana | 453 | 214,776(0.21%)#39 | 10,767,104(0.00%)#2,049 |
| 40. | Albemarle | 446 | 214,776(0.21%)#40 | 10,767,104(0.00%)#2,071 |
| 41. | Mooresville | 418 | 214,776(0.19%)#41 | 10,767,104(0.00%)#2,158 |
| 42. | Wendell | 411 | 214,776(0.19%)#42 | 10,767,104(0.00%)#2,181 |
| 43. | Wingate | 408 | 214,776(0.19%)#43 | 10,767,104(0.00%)#2,194 |
| 44. | Holly Springs | 393 | 214,776(0.18%)#44 | 10,767,104(0.00%)#2,252 |
| 45. | Green Level | 390 | 214,776(0.18%)#45 | 10,767,104(0.00%)#2,271 |
| 46. | Wake Forest | 386 | 214,776(0.18%)#46 | 10,767,104(0.00%)#2,279 |
| 47. | Archer Lodge | 364 | 214,776(0.17%)#47 | 10,767,104(0.00%)#2,368 |
| 48. | China Grove | 357 | 214,776(0.17%)#48 | 10,767,104(0.00%)#2,387 |
| 49. | Franklin | 352 | 214,776(0.16%)#49 | 10,767,104(0.00%)#2,411 |
| 50. | Rocky Mount | 349 | 214,776(0.16%)#50 | 10,767,104(0.00%)#2,425 |
| 51. | Haw River | 349 | 214,776(0.16%)#51 | 10,767,104(0.00%)#2,427 |
| 52. | Fuquay Varina | 346 | 214,776(0.16%)#52 | 10,767,104(0.00%)#2,442 |
| 53. | Elkin | 344 | 214,776(0.16%)#53 | 10,767,104(0.00%)#2,455 |
| 54. | Lenoir | 341 | 214,776(0.16%)#54 | 10,767,104(0.00%)#2,467 |
| 55. | Conover | 341 | 214,776(0.16%)#55 | 10,767,104(0.00%)#2,468 |
| 56. | Liberty | 339 | 214,776(0.16%)#56 | 10,767,104(0.00%)#2,481 |
| 57. | Biscoe | 339 | 214,776(0.16%)#57 | 10,767,104(0.00%)#2,482 |
| 58. | Anderson Creek | 329 | 214,776(0.15%)#58 | 10,767,104(0.00%)#2,526 |
| 59. | Chapel Hill | 323 | 214,776(0.15%)#59 | 10,767,104(0.00%)#2,544 |
| 60. | Lincolnton | 311 | 214,776(0.14%)#60 | 10,767,104(0.00%)#2,607 |
| 61. | Gorman | 311 | 214,776(0.14%)#61 | 10,767,104(0.00%)#2,609 |
| 62. | Angier | 309 | 214,776(0.14%)#62 | 10,767,104(0.00%)#2,625 |
| 63. | Benson | 305 | 214,776(0.14%)#63 | 10,767,104(0.00%)#2,647 |
| 64. | Four Oaks | 302 | 214,776(0.14%)#64 | 10,767,104(0.00%)#2,658 |
| 65. | Kernersville | 299 | 214,776(0.14%)#65 | 10,767,104(0.00%)#2,673 |
| 66. | Cullowhee | 296 | 214,776(0.14%)#66 | 10,767,104(0.00%)#2,693 |
| 67. | Mocksville | 294 | 214,776(0.14%)#67 | 10,767,104(0.00%)#2,709 |
| 68. | St Pauls | 294 | 214,776(0.14%)#68 | 10,767,104(0.00%)#2,712 |
| 69. | Smithfield | 289 | 214,776(0.13%)#69 | 10,767,104(0.00%)#2,741 |
| 70. | Yadkinville | 284 | 214,776(0.13%)#70 | 10,767,104(0.00%)#2,775 |
| 71. | Emma | 281 | 214,776(0.13%)#71 | 10,767,104(0.00%)#2,785 |
| 72. | Long View | 278 | 214,776(0.13%)#72 | 10,767,104(0.00%)#2,799 |
| 73. | Kill Devil Hills | 276 | 214,776(0.13%)#73 | 10,767,104(0.00%)#2,808 |
| 74. | Dallas | 273 | 214,776(0.13%)#74 | 10,767,104(0.00%)#2,828 |
| 75. | Clemmons | 266 | 214,776(0.12%)#75 | 10,767,104(0.00%)#2,875 |
| 76. | Greenville | 265 | 214,776(0.12%)#76 | 10,767,104(0.00%)#2,879 |
| 77. | Rockingham | 254 | 214,776(0.12%)#77 | 10,767,104(0.00%)#2,948 |
| 78. | Canton | 251 | 214,776(0.12%)#78 | 10,767,104(0.00%)#2,966 |
| 79. | Harrisburg | 249 | 214,776(0.12%)#79 | 10,767,104(0.00%)#2,977 |
| 80. | Robbins | 248 | 214,776(0.12%)#80 | 10,767,104(0.00%)#2,985 |
| 81. | Lumberton | 239 | 214,776(0.11%)#81 | 10,767,104(0.00%)#3,033 |
| 82. | Cornelius | 236 | 214,776(0.11%)#82 | 10,767,104(0.00%)#3,050 |
| 83. | New Bern | 230 | 214,776(0.11%)#83 | 10,767,104(0.00%)#3,090 |
| 84. | Selma | 229 | 214,776(0.11%)#84 | 10,767,104(0.00%)#3,102 |
| 85. | Elizabeth City | 226 | 214,776(0.11%)#85 | 10,767,104(0.00%)#3,119 |
| 86. | Dunn | 221 | 214,776(0.10%)#86 | 10,767,104(0.00%)#3,152 |
| 87. | Candor | 221 | 214,776(0.10%)#87 | 10,767,104(0.00%)#3,157 |
| 88. | Shelby | 217 | 214,776(0.10%)#88 | 10,767,104(0.00%)#3,184 |
| 89. | Oxford | 207 | 214,776(0.10%)#89 | 10,767,104(0.00%)#3,259 |
| 90. | Clinton | 201 | 214,776(0.09%)#90 | 10,767,104(0.00%)#3,323 |
| 91. | Knightdale | 195 | 214,776(0.09%)#91 | 10,767,104(0.00%)#3,380 |
| 92. | Lillington | 193 | 214,776(0.09%)#92 | 10,767,104(0.00%)#3,402 |
| 93. | Faison | 193 | 214,776(0.09%)#93 | 10,767,104(0.00%)#3,405 |
| 94. | Hope Mills | 186 | 214,776(0.09%)#94 | 10,767,104(0.00%)#3,479 |
| 95. | Newton | 185 | 214,776(0.09%)#95 | 10,767,104(0.00%)#3,494 |
| 96. | Woodfin | 184 | 214,776(0.09%)#96 | 10,767,104(0.00%)#3,502 |
| 97. | Andrews | 184 | 214,776(0.09%)#97 | 10,767,104(0.00%)#3,505 |
| 98. | Wesley Chapel | 182 | 214,776(0.08%)#98 | 10,767,104(0.00%)#3,525 |
| 99. | River Road | 181 | 214,776(0.08%)#99 | 10,767,104(0.00%)#3,549 |
| 100. | Archdale | 176 | 214,776(0.08%)#100 | 10,767,104(0.00%)#3,605 |
Common Questions
What are the Top 10 Cities with the Most Immigrants from Mexico in North Carolina?
Top 10 Cities with the Most Immigrants from Mexico in North Carolina are:
#1
21,823
#2
10,293
#3
10,047
#4
7,858
#5
5,322
#6
3,367
#7
3,118
#8
2,605
#9
2,348
#10
2,286
What city has the Most Immigrants from Mexico in North Carolina?
Charlotte has the Most Immigrants from Mexico in North Carolina with 21,823.
What is the Total Immigrants from Mexico in the State of North Carolina?
Total Immigrants from Mexico in North Carolina is 214,776.
What is the Total Immigrants from Mexico in the United States?
Total Immigrants from Mexico in the United States is 10,767,104.