Cities with the Most Immigrants from Mexico in Delaware
RELATED REPORTS & OPTIONS
Mexico
Delaware
Compare Cities
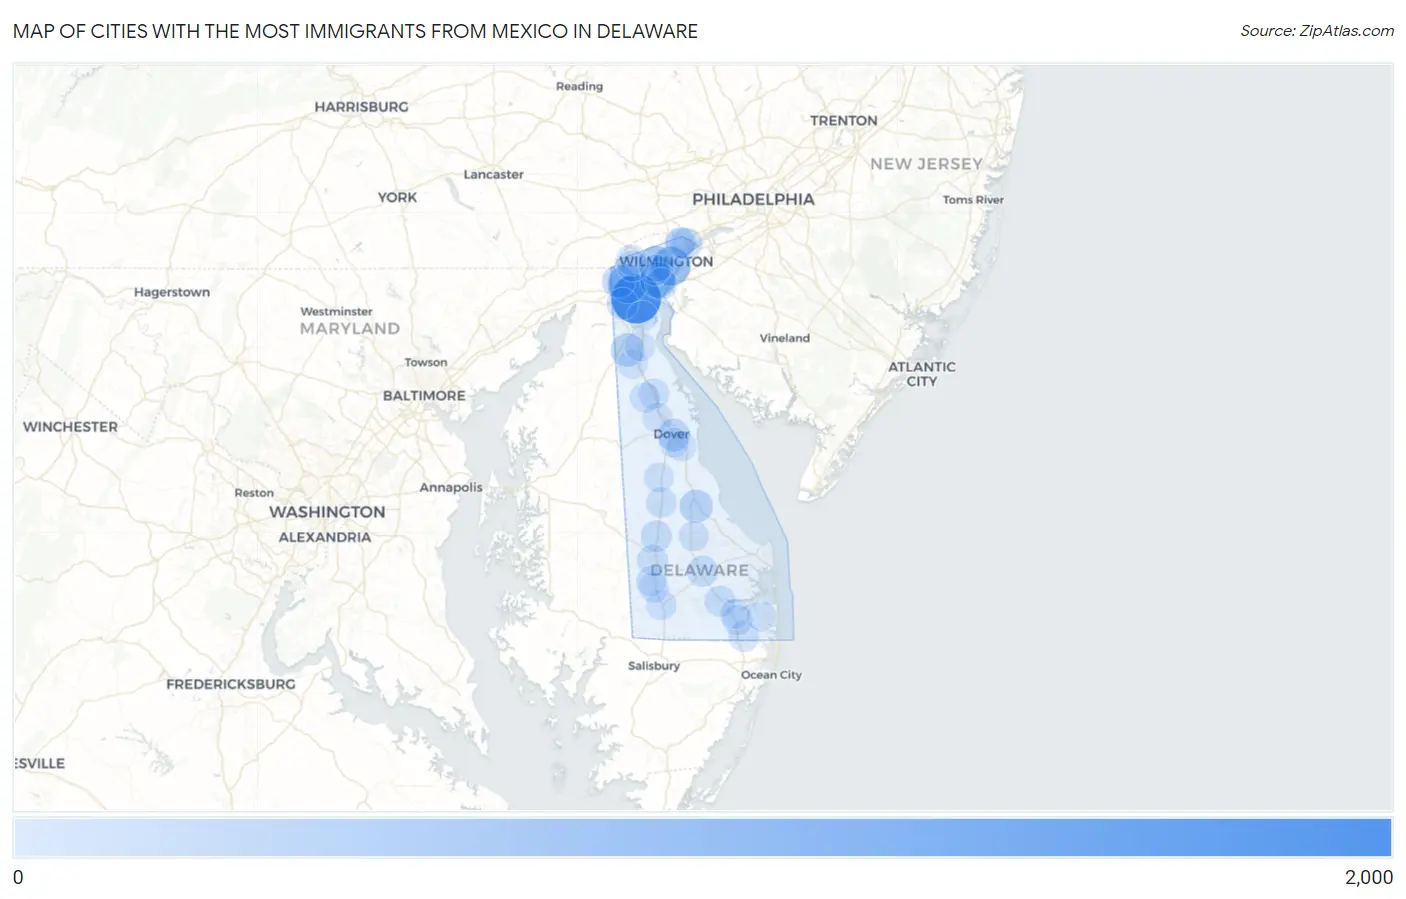
Map of Cities with the Most Immigrants from Mexico in Delaware
0
2,000
Cities with the Most Immigrants from Mexico in Delaware
| City | Mexico | vs State | vs National | |
| 1. | Bear | 1,815 | 14,887(12.19%)#1 | 10,767,104(0.02%)#768 |
| 2. | Brookside | 813 | 14,887(5.46%)#2 | 10,767,104(0.01%)#1,364 |
| 3. | Wilmington | 775 | 14,887(5.21%)#3 | 10,767,104(0.01%)#1,414 |
| 4. | Wilmington Manor | 516 | 14,887(3.47%)#4 | 10,767,104(0.00%)#1,888 |
| 5. | Elsmere | 510 | 14,887(3.43%)#5 | 10,767,104(0.00%)#1,903 |
| 6. | Middletown | 300 | 14,887(2.02%)#6 | 10,767,104(0.00%)#2,665 |
| 7. | Milford | 286 | 14,887(1.92%)#7 | 10,767,104(0.00%)#2,766 |
| 8. | Newark | 269 | 14,887(1.81%)#8 | 10,767,104(0.00%)#2,854 |
| 9. | Dover | 205 | 14,887(1.38%)#9 | 10,767,104(0.00%)#3,271 |
| 10. | Glasgow | 140 | 14,887(0.94%)#10 | 10,767,104(0.00%)#4,072 |
| 11. | Claymont | 128 | 14,887(0.86%)#11 | 10,767,104(0.00%)#4,228 |
| 12. | New Castle | 128 | 14,887(0.86%)#12 | 10,767,104(0.00%)#4,231 |
| 13. | Greenwood | 123 | 14,887(0.83%)#13 | 10,767,104(0.00%)#4,327 |
| 14. | Millsboro | 97 | 14,887(0.65%)#14 | 10,767,104(0.00%)#4,808 |
| 15. | Georgetown | 94 | 14,887(0.63%)#15 | 10,767,104(0.00%)#4,861 |
| 16. | Pike Creek Valley | 63 | 14,887(0.42%)#16 | 10,767,104(0.00%)#5,736 |
| 17. | Bridgeville | 62 | 14,887(0.42%)#17 | 10,767,104(0.00%)#5,785 |
| 18. | Selbyville | 61 | 14,887(0.41%)#18 | 10,767,104(0.00%)#5,825 |
| 19. | Newport | 57 | 14,887(0.38%)#19 | 10,767,104(0.00%)#5,979 |
| 20. | Harrington | 50 | 14,887(0.34%)#20 | 10,767,104(0.00%)#6,297 |
| 21. | St Georges | 45 | 14,887(0.30%)#21 | 10,767,104(0.00%)#6,568 |
| 22. | Frankford | 42 | 14,887(0.28%)#22 | 10,767,104(0.00%)#6,756 |
| 23. | Pike Creek | 33 | 14,887(0.22%)#23 | 10,767,104(0.00%)#7,253 |
| 24. | Smyrna | 31 | 14,887(0.21%)#24 | 10,767,104(0.00%)#7,382 |
| 25. | Laurel | 29 | 14,887(0.19%)#25 | 10,767,104(0.00%)#7,528 |
| 26. | Blades | 25 | 14,887(0.17%)#26 | 10,767,104(0.00%)#7,877 |
| 27. | Ardencroft | 19 | 14,887(0.13%)#27 | 10,767,104(0.00%)#8,562 |
| 28. | Seaford | 18 | 14,887(0.12%)#28 | 10,767,104(0.00%)#8,586 |
| 29. | Clayton | 17 | 14,887(0.11%)#29 | 10,767,104(0.00%)#8,732 |
| 30. | Cheswold | 13 | 14,887(0.09%)#30 | 10,767,104(0.00%)#9,317 |
| 31. | Dagsboro | 9 | 14,887(0.06%)#31 | 10,767,104(0.00%)#10,043 |
| 32. | Dover Base Housing | 4 | 14,887(0.03%)#32 | 10,767,104(0.00%)#11,226 |
| 33. | Townsend | 4 | 14,887(0.03%)#33 | 10,767,104(0.00%)#11,234 |
| 34. | Kent Acres | 4 | 14,887(0.03%)#34 | 10,767,104(0.00%)#11,248 |
| 35. | Millville | 4 | 14,887(0.03%)#35 | 10,767,104(0.00%)#11,250 |
| 36. | Ellendale | 4 | 14,887(0.03%)#36 | 10,767,104(0.00%)#11,375 |
| 37. | Ardentown | 4 | 14,887(0.03%)#37 | 10,767,104(0.00%)#11,453 |
| 38. | Felton | 3 | 14,887(0.02%)#38 | 10,767,104(0.00%)#11,596 |
| 39. | Odessa | 3 | 14,887(0.02%)#39 | 10,767,104(0.00%)#11,721 |
1
Common Questions
What are the Top 10 Cities with the Most Immigrants from Mexico in Delaware?
Top 10 Cities with the Most Immigrants from Mexico in Delaware are:
#1
1,815
#2
813
#3
775
#4
516
#5
510
#6
300
#7
286
#8
269
#9
205
#10
140
What city has the Most Immigrants from Mexico in Delaware?
Bear has the Most Immigrants from Mexico in Delaware with 1,815.
What is the Total Immigrants from Mexico in the State of Delaware?
Total Immigrants from Mexico in Delaware is 14,887.
What is the Total Immigrants from Mexico in the United States?
Total Immigrants from Mexico in the United States is 10,767,104.