Cities with the Most Immigrants from Mexico in Indiana
RELATED REPORTS & OPTIONS
Mexico
Indiana
Compare Cities
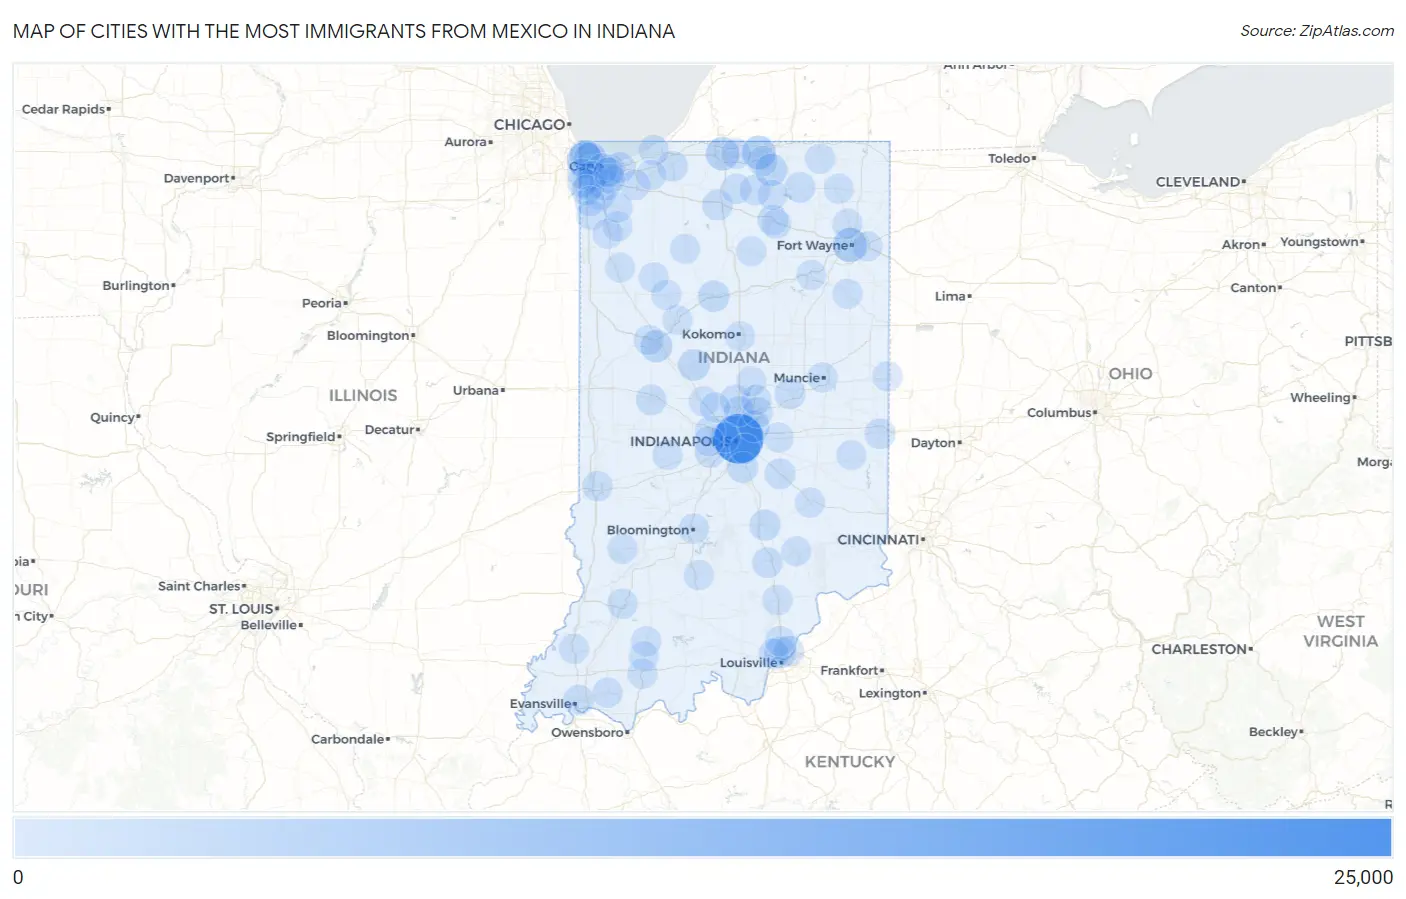
Map of Cities with the Most Immigrants from Mexico in Indiana
0
25,000
Cities with the Most Immigrants from Mexico in Indiana
| City | Mexico | vs State | vs National | |
| 1. | Indianapolis | 24,547 | 101,996(24.07%)#1 | 10,767,104(0.23%)#55 |
| 2. | Hammond | 6,851 | 101,996(6.72%)#2 | 10,767,104(0.06%)#222 |
| 3. | Fort Wayne | 5,117 | 101,996(5.02%)#3 | 10,767,104(0.05%)#303 |
| 4. | Elkhart | 4,085 | 101,996(4.01%)#4 | 10,767,104(0.04%)#384 |
| 5. | South Bend | 3,886 | 101,996(3.81%)#5 | 10,767,104(0.04%)#405 |
| 6. | East Chicago | 3,413 | 101,996(3.35%)#6 | 10,767,104(0.03%)#448 |
| 7. | Goshen | 2,615 | 101,996(2.56%)#7 | 10,767,104(0.02%)#562 |
| 8. | Lafayette | 2,509 | 101,996(2.46%)#8 | 10,767,104(0.02%)#594 |
| 9. | Lawrence | 1,952 | 101,996(1.91%)#9 | 10,767,104(0.02%)#727 |
| 10. | Frankfort | 1,894 | 101,996(1.86%)#10 | 10,767,104(0.02%)#742 |
| 11. | Logansport | 1,675 | 101,996(1.64%)#11 | 10,767,104(0.02%)#817 |
| 12. | Clarksville | 1,517 | 101,996(1.49%)#12 | 10,767,104(0.01%)#866 |
| 13. | Columbus | 1,043 | 101,996(1.02%)#13 | 10,767,104(0.01%)#1,129 |
| 14. | Greenwood | 1,023 | 101,996(1.00%)#14 | 10,767,104(0.01%)#1,142 |
| 15. | Ligonier | 954 | 101,996(0.94%)#15 | 10,767,104(0.01%)#1,208 |
| 16. | Anderson | 834 | 101,996(0.82%)#16 | 10,767,104(0.01%)#1,335 |
| 17. | Merrillville | 800 | 101,996(0.78%)#17 | 10,767,104(0.01%)#1,382 |
| 18. | Plymouth | 787 | 101,996(0.77%)#18 | 10,767,104(0.01%)#1,399 |
| 19. | La Porte | 694 | 101,996(0.68%)#19 | 10,767,104(0.01%)#1,534 |
| 20. | Lake Station | 694 | 101,996(0.68%)#20 | 10,767,104(0.01%)#1,535 |
| 21. | Portage | 682 | 101,996(0.67%)#21 | 10,767,104(0.01%)#1,554 |
| 22. | Shelbyville | 671 | 101,996(0.66%)#22 | 10,767,104(0.01%)#1,575 |
| 23. | Crawfordsville | 644 | 101,996(0.63%)#23 | 10,767,104(0.01%)#1,619 |
| 24. | Richmond | 643 | 101,996(0.63%)#24 | 10,767,104(0.01%)#1,621 |
| 25. | Evansville | 638 | 101,996(0.63%)#25 | 10,767,104(0.01%)#1,631 |
| 26. | Seymour | 625 | 101,996(0.61%)#26 | 10,767,104(0.01%)#1,659 |
| 27. | Valparaiso | 595 | 101,996(0.58%)#27 | 10,767,104(0.01%)#1,711 |
| 28. | Westfield | 575 | 101,996(0.56%)#28 | 10,767,104(0.01%)#1,749 |
| 29. | Whiting | 561 | 101,996(0.55%)#29 | 10,767,104(0.01%)#1,777 |
| 30. | Gary | 538 | 101,996(0.53%)#30 | 10,767,104(0.00%)#1,834 |
| 31. | Nappanee | 526 | 101,996(0.52%)#31 | 10,767,104(0.00%)#1,864 |
| 32. | Jeffersonville | 490 | 101,996(0.48%)#32 | 10,767,104(0.00%)#1,949 |
| 33. | Carmel | 482 | 101,996(0.47%)#33 | 10,767,104(0.00%)#1,968 |
| 34. | Warsaw | 482 | 101,996(0.47%)#34 | 10,767,104(0.00%)#1,970 |
| 35. | New Albany | 433 | 101,996(0.42%)#35 | 10,767,104(0.00%)#2,107 |
| 36. | Schererville | 407 | 101,996(0.40%)#36 | 10,767,104(0.00%)#2,198 |
| 37. | Washington | 383 | 101,996(0.38%)#37 | 10,767,104(0.00%)#2,290 |
| 38. | Griffith | 361 | 101,996(0.35%)#38 | 10,767,104(0.00%)#2,373 |
| 39. | Crown Point | 352 | 101,996(0.35%)#39 | 10,767,104(0.00%)#2,407 |
| 40. | Bloomington | 346 | 101,996(0.34%)#40 | 10,767,104(0.00%)#2,440 |
| 41. | Plainfield | 336 | 101,996(0.33%)#41 | 10,767,104(0.00%)#2,495 |
| 42. | Dyer | 332 | 101,996(0.33%)#42 | 10,767,104(0.00%)#2,514 |
| 43. | Munster | 331 | 101,996(0.32%)#43 | 10,767,104(0.00%)#2,519 |
| 44. | Terre Haute | 308 | 101,996(0.30%)#44 | 10,767,104(0.00%)#2,628 |
| 45. | Fishers | 272 | 101,996(0.27%)#45 | 10,767,104(0.00%)#2,832 |
| 46. | St John | 266 | 101,996(0.26%)#46 | 10,767,104(0.00%)#2,876 |
| 47. | Bremen | 264 | 101,996(0.26%)#47 | 10,767,104(0.00%)#2,886 |
| 48. | Noblesville | 255 | 101,996(0.25%)#48 | 10,767,104(0.00%)#2,940 |
| 49. | Hobart | 255 | 101,996(0.25%)#49 | 10,767,104(0.00%)#2,942 |
| 50. | Michigan City | 233 | 101,996(0.23%)#50 | 10,767,104(0.00%)#3,068 |
| 51. | Speedway | 215 | 101,996(0.21%)#51 | 10,767,104(0.00%)#3,194 |
| 52. | Brownsburg | 212 | 101,996(0.21%)#52 | 10,767,104(0.00%)#3,220 |
| 53. | Boonville | 206 | 101,996(0.20%)#53 | 10,767,104(0.00%)#3,263 |
| 54. | Lowell | 199 | 101,996(0.20%)#54 | 10,767,104(0.00%)#3,339 |
| 55. | Dunlap | 197 | 101,996(0.19%)#55 | 10,767,104(0.00%)#3,363 |
| 56. | Muncie | 190 | 101,996(0.19%)#56 | 10,767,104(0.00%)#3,423 |
| 57. | Kendallville | 184 | 101,996(0.18%)#57 | 10,767,104(0.00%)#3,501 |
| 58. | Princeton | 182 | 101,996(0.18%)#58 | 10,767,104(0.00%)#3,527 |
| 59. | Kokomo | 177 | 101,996(0.17%)#59 | 10,767,104(0.00%)#3,592 |
| 60. | Union City | 174 | 101,996(0.17%)#60 | 10,767,104(0.00%)#3,625 |
| 61. | Delphi | 166 | 101,996(0.16%)#61 | 10,767,104(0.00%)#3,735 |
| 62. | Monticello | 164 | 101,996(0.16%)#62 | 10,767,104(0.00%)#3,755 |
| 63. | Scottsburg | 156 | 101,996(0.15%)#63 | 10,767,104(0.00%)#3,842 |
| 64. | Akron | 151 | 101,996(0.15%)#64 | 10,767,104(0.00%)#3,916 |
| 65. | Lagrange | 149 | 101,996(0.15%)#65 | 10,767,104(0.00%)#3,946 |
| 66. | Lebanon | 148 | 101,996(0.15%)#66 | 10,767,104(0.00%)#3,955 |
| 67. | Winona Lake | 147 | 101,996(0.14%)#67 | 10,767,104(0.00%)#3,976 |
| 68. | Linton | 139 | 101,996(0.14%)#68 | 10,767,104(0.00%)#4,088 |
| 69. | Mishawaka | 137 | 101,996(0.13%)#69 | 10,767,104(0.00%)#4,106 |
| 70. | West Lafayette | 136 | 101,996(0.13%)#70 | 10,767,104(0.00%)#4,116 |
| 71. | Jasper | 136 | 101,996(0.13%)#71 | 10,767,104(0.00%)#4,118 |
| 72. | Roselawn | 134 | 101,996(0.13%)#72 | 10,767,104(0.00%)#4,140 |
| 73. | Fair Oaks | 132 | 101,996(0.13%)#73 | 10,767,104(0.00%)#4,183 |
| 74. | Dale | 125 | 101,996(0.12%)#74 | 10,767,104(0.00%)#4,293 |
| 75. | North Vernon | 124 | 101,996(0.12%)#75 | 10,767,104(0.00%)#4,306 |
| 76. | New Chicago | 119 | 101,996(0.12%)#76 | 10,767,104(0.00%)#4,399 |
| 77. | Huntingburg | 116 | 101,996(0.11%)#77 | 10,767,104(0.00%)#4,440 |
| 78. | Zionsville | 114 | 101,996(0.11%)#78 | 10,767,104(0.00%)#4,467 |
| 79. | Huntertown | 113 | 101,996(0.11%)#79 | 10,767,104(0.00%)#4,493 |
| 80. | Connersville | 112 | 101,996(0.11%)#80 | 10,767,104(0.00%)#4,513 |
| 81. | Arcadia | 102 | 101,996(0.10%)#81 | 10,767,104(0.00%)#4,713 |
| 82. | Huntington | 97 | 101,996(0.10%)#82 | 10,767,104(0.00%)#4,800 |
| 83. | Milford | 93 | 101,996(0.09%)#83 | 10,767,104(0.00%)#4,897 |
| 84. | Sellersburg | 88 | 101,996(0.09%)#84 | 10,767,104(0.00%)#5,010 |
| 85. | Fillmore | 88 | 101,996(0.09%)#85 | 10,767,104(0.00%)#5,021 |
| 86. | Bluffton | 85 | 101,996(0.08%)#86 | 10,767,104(0.00%)#5,084 |
| 87. | Greenfield | 84 | 101,996(0.08%)#87 | 10,767,104(0.00%)#5,104 |
| 88. | New Haven | 81 | 101,996(0.08%)#88 | 10,767,104(0.00%)#5,182 |
| 89. | Beech Grove | 80 | 101,996(0.08%)#89 | 10,767,104(0.00%)#5,207 |
| 90. | Monon | 80 | 101,996(0.08%)#90 | 10,767,104(0.00%)#5,222 |
| 91. | Bedford | 79 | 101,996(0.08%)#91 | 10,767,104(0.00%)#5,234 |
| 92. | Cedar Lake | 78 | 101,996(0.08%)#92 | 10,767,104(0.00%)#5,258 |
| 93. | De Motte | 78 | 101,996(0.08%)#93 | 10,767,104(0.00%)#5,268 |
| 94. | Avon | 77 | 101,996(0.08%)#94 | 10,767,104(0.00%)#5,286 |
| 95. | Greensburg | 74 | 101,996(0.07%)#95 | 10,767,104(0.00%)#5,371 |
| 96. | Westville | 74 | 101,996(0.07%)#96 | 10,767,104(0.00%)#5,378 |
| 97. | Winamac | 74 | 101,996(0.07%)#97 | 10,767,104(0.00%)#5,385 |
| 98. | Hebron | 72 | 101,996(0.07%)#98 | 10,767,104(0.00%)#5,437 |
| 99. | Linn Grove | 70 | 101,996(0.07%)#99 | 10,767,104(0.00%)#5,521 |
| 100. | Rensselaer | 67 | 101,996(0.07%)#100 | 10,767,104(0.00%)#5,601 |
Common Questions
What are the Top 10 Cities with the Most Immigrants from Mexico in Indiana?
Top 10 Cities with the Most Immigrants from Mexico in Indiana are:
#1
24,547
#2
6,851
#3
5,117
#4
4,085
#5
3,886
#6
3,413
#7
2,615
#8
2,509
#9
1,952
#10
1,894
What city has the Most Immigrants from Mexico in Indiana?
Indianapolis has the Most Immigrants from Mexico in Indiana with 24,547.
What is the Total Immigrants from Mexico in the State of Indiana?
Total Immigrants from Mexico in Indiana is 101,996.
What is the Total Immigrants from Mexico in the United States?
Total Immigrants from Mexico in the United States is 10,767,104.