Cities with the Most Immigrants from Mexico in Michigan
RELATED REPORTS & OPTIONS
Mexico
Michigan
Compare Cities
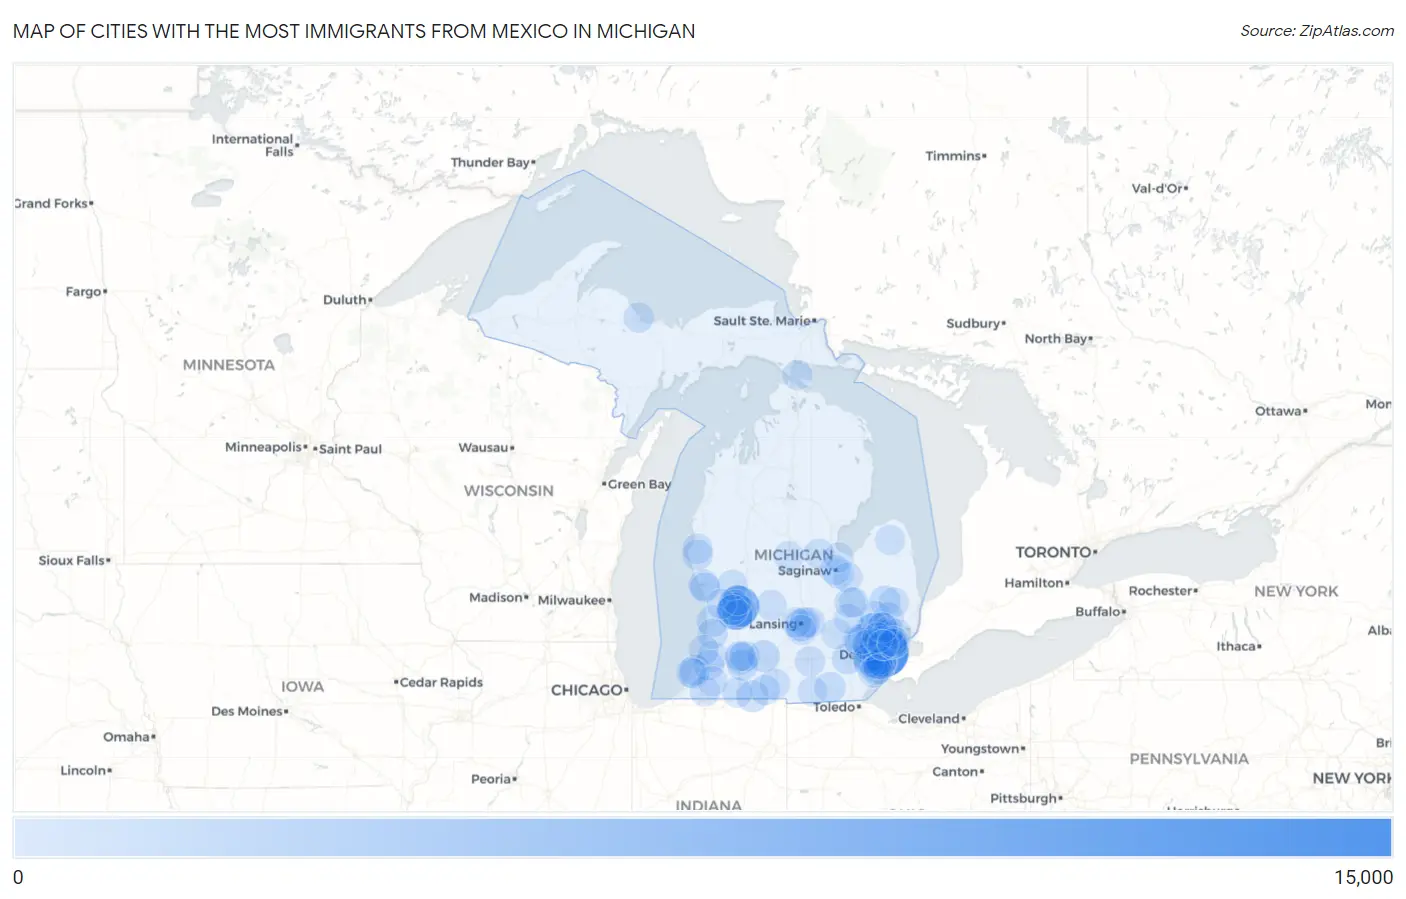
Map of Cities with the Most Immigrants from Mexico in Michigan
0
15,000
Cities with the Most Immigrants from Mexico in Michigan
| City | Mexico | vs State | vs National | |
| 1. | Detroit | 11,022 | 75,965(14.51%)#1 | 10,767,104(0.10%)#134 |
| 2. | Grand Rapids | 6,092 | 75,965(8.02%)#2 | 10,767,104(0.06%)#249 |
| 3. | Wyoming | 3,973 | 75,965(5.23%)#3 | 10,767,104(0.04%)#392 |
| 4. | Lincoln Park | 2,546 | 75,965(3.35%)#4 | 10,767,104(0.02%)#584 |
| 5. | Pontiac | 2,051 | 75,965(2.70%)#5 | 10,767,104(0.02%)#698 |
| 6. | Lansing | 1,253 | 75,965(1.65%)#6 | 10,767,104(0.01%)#992 |
| 7. | Sturgis | 991 | 75,965(1.30%)#7 | 10,767,104(0.01%)#1,174 |
| 8. | Battle Creek | 944 | 75,965(1.24%)#8 | 10,767,104(0.01%)#1,220 |
| 9. | Rochester Hills | 904 | 75,965(1.19%)#9 | 10,767,104(0.01%)#1,262 |
| 10. | Novi | 888 | 75,965(1.17%)#10 | 10,767,104(0.01%)#1,276 |
| 11. | Holland | 778 | 75,965(1.02%)#11 | 10,767,104(0.01%)#1,409 |
| 12. | Kalamazoo | 758 | 75,965(1.00%)#12 | 10,767,104(0.01%)#1,450 |
| 13. | Kentwood | 693 | 75,965(0.91%)#13 | 10,767,104(0.01%)#1,536 |
| 14. | Auburn Hills | 643 | 75,965(0.85%)#14 | 10,767,104(0.01%)#1,622 |
| 15. | Westland | 633 | 75,965(0.83%)#15 | 10,767,104(0.01%)#1,641 |
| 16. | Ann Arbor | 607 | 75,965(0.80%)#16 | 10,767,104(0.01%)#1,686 |
| 17. | Muskegon | 578 | 75,965(0.76%)#17 | 10,767,104(0.01%)#1,743 |
| 18. | Imlay City | 577 | 75,965(0.76%)#18 | 10,767,104(0.01%)#1,745 |
| 19. | Melvindale | 553 | 75,965(0.73%)#19 | 10,767,104(0.01%)#1,792 |
| 20. | Portage | 543 | 75,965(0.71%)#20 | 10,767,104(0.01%)#1,814 |
| 21. | Troy | 528 | 75,965(0.70%)#21 | 10,767,104(0.00%)#1,861 |
| 22. | Taylor | 526 | 75,965(0.69%)#22 | 10,767,104(0.00%)#1,862 |
| 23. | Adrian | 480 | 75,965(0.63%)#23 | 10,767,104(0.00%)#1,975 |
| 24. | Farmington Hills | 429 | 75,965(0.56%)#24 | 10,767,104(0.00%)#2,124 |
| 25. | Sterling Heights | 410 | 75,965(0.54%)#25 | 10,767,104(0.00%)#2,183 |
| 26. | Livonia | 391 | 75,965(0.51%)#26 | 10,767,104(0.00%)#2,265 |
| 27. | Dearborn Heights | 378 | 75,965(0.50%)#27 | 10,767,104(0.00%)#2,316 |
| 28. | Warren | 348 | 75,965(0.46%)#28 | 10,767,104(0.00%)#2,429 |
| 29. | Shelby | 343 | 75,965(0.45%)#29 | 10,767,104(0.00%)#2,461 |
| 30. | Dearborn | 315 | 75,965(0.41%)#30 | 10,767,104(0.00%)#2,587 |
| 31. | Allen Park | 315 | 75,965(0.41%)#31 | 10,767,104(0.00%)#2,589 |
| 32. | Flint | 306 | 75,965(0.40%)#32 | 10,767,104(0.00%)#2,636 |
| 33. | Royal Oak | 306 | 75,965(0.40%)#33 | 10,767,104(0.00%)#2,637 |
| 34. | Kent City | 273 | 75,965(0.36%)#34 | 10,767,104(0.00%)#2,831 |
| 35. | Walker | 271 | 75,965(0.36%)#35 | 10,767,104(0.00%)#2,843 |
| 36. | River Rouge | 270 | 75,965(0.36%)#36 | 10,767,104(0.00%)#2,849 |
| 37. | Wixom | 269 | 75,965(0.35%)#37 | 10,767,104(0.00%)#2,856 |
| 38. | Benton Heights | 267 | 75,965(0.35%)#38 | 10,767,104(0.00%)#2,870 |
| 39. | Coldwater | 265 | 75,965(0.35%)#39 | 10,767,104(0.00%)#2,881 |
| 40. | Eastwood | 265 | 75,965(0.35%)#40 | 10,767,104(0.00%)#2,882 |
| 41. | Bangor | 221 | 75,965(0.29%)#41 | 10,767,104(0.00%)#3,156 |
| 42. | Ionia | 218 | 75,965(0.29%)#42 | 10,767,104(0.00%)#3,177 |
| 43. | Hartford | 205 | 75,965(0.27%)#43 | 10,767,104(0.00%)#3,285 |
| 44. | Southgate | 196 | 75,965(0.26%)#44 | 10,767,104(0.00%)#3,371 |
| 45. | Madison Heights | 178 | 75,965(0.23%)#45 | 10,767,104(0.00%)#3,578 |
| 46. | Wyandotte | 175 | 75,965(0.23%)#46 | 10,767,104(0.00%)#3,614 |
| 47. | Haslett | 173 | 75,965(0.23%)#47 | 10,767,104(0.00%)#3,637 |
| 48. | Cutlerville | 170 | 75,965(0.22%)#48 | 10,767,104(0.00%)#3,674 |
| 49. | Wayne | 158 | 75,965(0.21%)#49 | 10,767,104(0.00%)#3,823 |
| 50. | Howell | 155 | 75,965(0.20%)#50 | 10,767,104(0.00%)#3,860 |
| 51. | Comstock Park | 149 | 75,965(0.20%)#51 | 10,767,104(0.00%)#3,940 |
| 52. | Romulus | 142 | 75,965(0.19%)#52 | 10,767,104(0.00%)#4,044 |
| 53. | Marquette | 138 | 75,965(0.18%)#53 | 10,767,104(0.00%)#4,096 |
| 54. | Jackson | 133 | 75,965(0.18%)#54 | 10,767,104(0.00%)#4,147 |
| 55. | Ecorse | 133 | 75,965(0.18%)#55 | 10,767,104(0.00%)#4,151 |
| 56. | Fennville | 133 | 75,965(0.18%)#56 | 10,767,104(0.00%)#4,157 |
| 57. | Southfield | 132 | 75,965(0.17%)#57 | 10,767,104(0.00%)#4,162 |
| 58. | Hart | 122 | 75,965(0.16%)#58 | 10,767,104(0.00%)#4,347 |
| 59. | Oxford | 119 | 75,965(0.16%)#59 | 10,767,104(0.00%)#4,395 |
| 60. | East Lansing | 117 | 75,965(0.15%)#60 | 10,767,104(0.00%)#4,418 |
| 61. | Romeo | 117 | 75,965(0.15%)#61 | 10,767,104(0.00%)#4,430 |
| 62. | Bronson | 114 | 75,965(0.15%)#62 | 10,767,104(0.00%)#4,484 |
| 63. | Bridgeport | 111 | 75,965(0.15%)#63 | 10,767,104(0.00%)#4,538 |
| 64. | Niles | 110 | 75,965(0.14%)#64 | 10,767,104(0.00%)#4,554 |
| 65. | Farmington | 109 | 75,965(0.14%)#65 | 10,767,104(0.00%)#4,564 |
| 66. | Midland | 107 | 75,965(0.14%)#66 | 10,767,104(0.00%)#4,601 |
| 67. | Westwood | 106 | 75,965(0.14%)#67 | 10,767,104(0.00%)#4,623 |
| 68. | Muskegon Heights | 101 | 75,965(0.13%)#68 | 10,767,104(0.00%)#4,720 |
| 69. | South Haven | 101 | 75,965(0.13%)#69 | 10,767,104(0.00%)#4,724 |
| 70. | Mount Clemens | 97 | 75,965(0.13%)#70 | 10,767,104(0.00%)#4,801 |
| 71. | Constantine | 96 | 75,965(0.13%)#71 | 10,767,104(0.00%)#4,838 |
| 72. | St Clair Shores | 95 | 75,965(0.13%)#72 | 10,767,104(0.00%)#4,846 |
| 73. | Mount Pleasant | 92 | 75,965(0.12%)#73 | 10,767,104(0.00%)#4,903 |
| 74. | Capac | 91 | 75,965(0.12%)#74 | 10,767,104(0.00%)#4,947 |
| 75. | Allendale | 89 | 75,965(0.12%)#75 | 10,767,104(0.00%)#4,979 |
| 76. | Utica | 89 | 75,965(0.12%)#76 | 10,767,104(0.00%)#4,986 |
| 77. | Mackinac Island | 87 | 75,965(0.11%)#77 | 10,767,104(0.00%)#5,041 |
| 78. | Flat Rock | 86 | 75,965(0.11%)#78 | 10,767,104(0.00%)#5,051 |
| 79. | Fair Plain | 86 | 75,965(0.11%)#79 | 10,767,104(0.00%)#5,054 |
| 80. | Hazel Park | 85 | 75,965(0.11%)#80 | 10,767,104(0.00%)#5,083 |
| 81. | Saginaw | 79 | 75,965(0.10%)#81 | 10,767,104(0.00%)#5,230 |
| 82. | Roseville | 78 | 75,965(0.10%)#82 | 10,767,104(0.00%)#5,253 |
| 83. | Waverly | 76 | 75,965(0.10%)#83 | 10,767,104(0.00%)#5,310 |
| 84. | Dowagiac | 76 | 75,965(0.10%)#84 | 10,767,104(0.00%)#5,317 |
| 85. | Frankenmuth | 75 | 75,965(0.10%)#85 | 10,767,104(0.00%)#5,347 |
| 86. | Bad Axe | 69 | 75,965(0.09%)#86 | 10,767,104(0.00%)#5,544 |
| 87. | Walled Lake | 68 | 75,965(0.09%)#87 | 10,767,104(0.00%)#5,562 |
| 88. | Grandville | 67 | 75,965(0.09%)#88 | 10,767,104(0.00%)#5,587 |
| 89. | Birmingham | 61 | 75,965(0.08%)#89 | 10,767,104(0.00%)#5,803 |
| 90. | Fenton | 61 | 75,965(0.08%)#90 | 10,767,104(0.00%)#5,809 |
| 91. | Rochester | 60 | 75,965(0.08%)#91 | 10,767,104(0.00%)#5,843 |
| 92. | Trenton | 58 | 75,965(0.08%)#92 | 10,767,104(0.00%)#5,922 |
| 93. | Bay City | 57 | 75,965(0.08%)#93 | 10,767,104(0.00%)#5,953 |
| 94. | Woodhaven | 55 | 75,965(0.07%)#94 | 10,767,104(0.00%)#6,041 |
| 95. | Ferndale | 54 | 75,965(0.07%)#95 | 10,767,104(0.00%)#6,085 |
| 96. | St Joseph | 53 | 75,965(0.07%)#96 | 10,767,104(0.00%)#6,141 |
| 97. | Hudson | 53 | 75,965(0.07%)#97 | 10,767,104(0.00%)#6,159 |
| 98. | Eastpointe | 52 | 75,965(0.07%)#98 | 10,767,104(0.00%)#6,185 |
| 99. | Holt | 52 | 75,965(0.07%)#99 | 10,767,104(0.00%)#6,187 |
| 100. | Burton | 51 | 75,965(0.07%)#100 | 10,767,104(0.00%)#6,240 |
Common Questions
What are the Top 10 Cities with the Most Immigrants from Mexico in Michigan?
Top 10 Cities with the Most Immigrants from Mexico in Michigan are:
#1
11,022
#2
6,092
#3
3,973
#4
2,546
#5
2,051
#6
1,253
#7
991
#8
944
#9
904
#10
888
What city has the Most Immigrants from Mexico in Michigan?
Detroit has the Most Immigrants from Mexico in Michigan with 11,022.
What is the Total Immigrants from Mexico in the State of Michigan?
Total Immigrants from Mexico in Michigan is 75,965.
What is the Total Immigrants from Mexico in the United States?
Total Immigrants from Mexico in the United States is 10,767,104.