Cities with the Most Immigrants from Mexico in Iowa
RELATED REPORTS & OPTIONS
Mexico
Iowa
Compare Cities
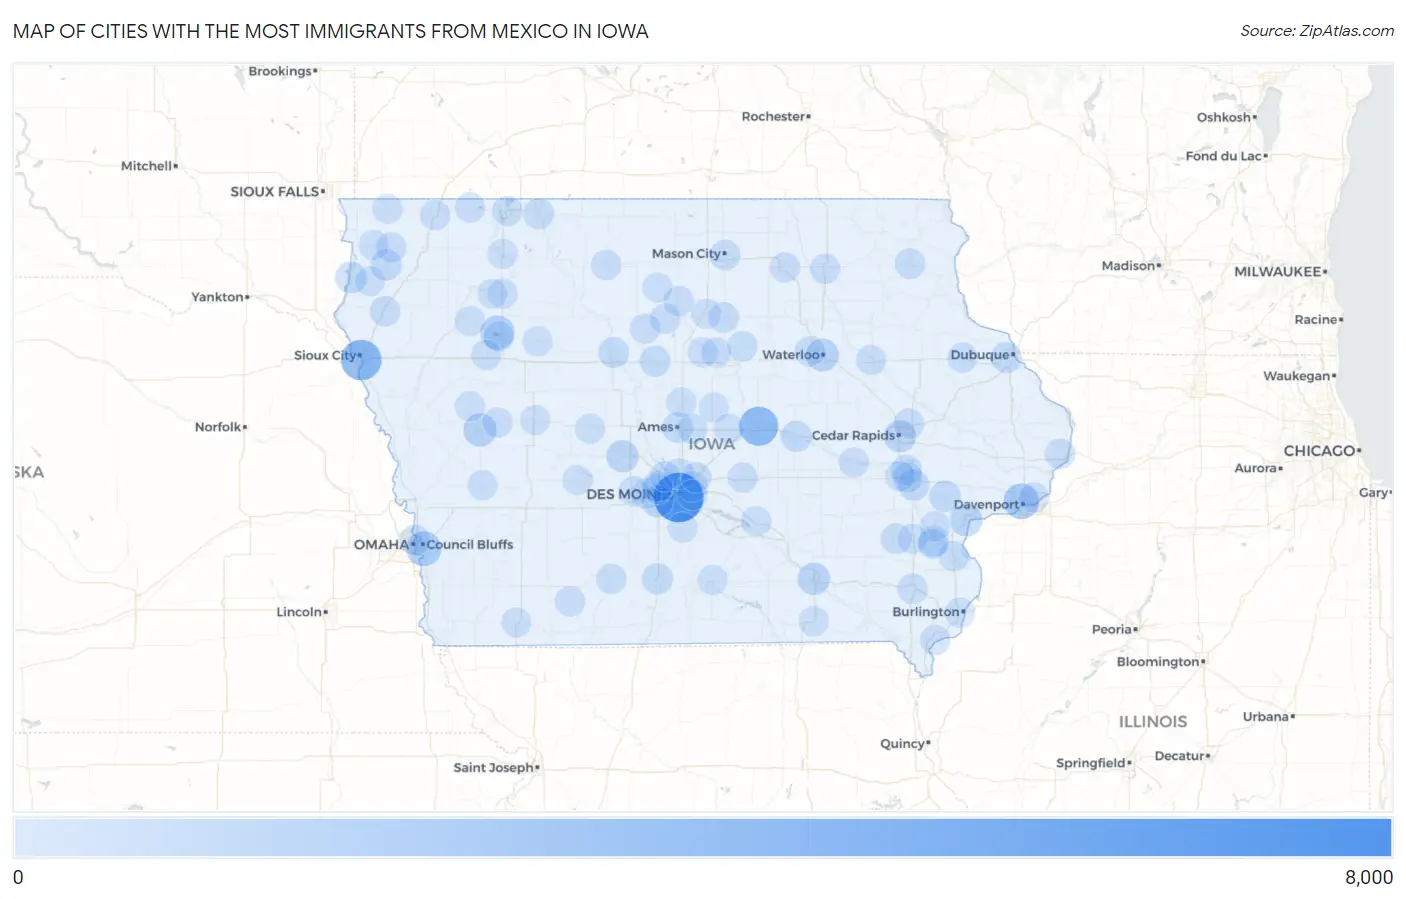
Map of Cities with the Most Immigrants from Mexico in Iowa
0
8,000
Cities with the Most Immigrants from Mexico in Iowa
| City | Mexico | vs State | vs National | |
| 1. | Des Moines | 7,074 | 41,625(16.99%)#1 | 10,767,104(0.07%)#213 |
| 2. | Sioux City | 3,707 | 41,625(8.91%)#2 | 10,767,104(0.03%)#418 |
| 3. | Marshalltown | 3,206 | 41,625(7.70%)#3 | 10,767,104(0.03%)#471 |
| 4. | Davenport | 1,881 | 41,625(4.52%)#4 | 10,767,104(0.02%)#747 |
| 5. | Council Bluffs | 1,697 | 41,625(4.08%)#5 | 10,767,104(0.02%)#812 |
| 6. | Storm Lake | 1,336 | 41,625(3.21%)#6 | 10,767,104(0.01%)#955 |
| 7. | Denison | 1,087 | 41,625(2.61%)#7 | 10,767,104(0.01%)#1,101 |
| 8. | Waterloo | 946 | 41,625(2.27%)#8 | 10,767,104(0.01%)#1,219 |
| 9. | Muscatine | 852 | 41,625(2.05%)#9 | 10,767,104(0.01%)#1,317 |
| 10. | Ottumwa | 808 | 41,625(1.94%)#10 | 10,767,104(0.01%)#1,372 |
| 11. | Perry | 780 | 41,625(1.87%)#11 | 10,767,104(0.01%)#1,406 |
| 12. | Cedar Rapids | 708 | 41,625(1.70%)#12 | 10,767,104(0.01%)#1,499 |
| 13. | West Des Moines | 671 | 41,625(1.61%)#13 | 10,767,104(0.01%)#1,574 |
| 14. | Hawarden | 548 | 41,625(1.32%)#14 | 10,767,104(0.01%)#1,802 |
| 15. | West Liberty | 507 | 41,625(1.22%)#15 | 10,767,104(0.00%)#1,912 |
| 16. | Iowa City | 444 | 41,625(1.07%)#16 | 10,767,104(0.00%)#2,077 |
| 17. | Sioux Center | 426 | 41,625(1.02%)#17 | 10,767,104(0.00%)#2,137 |
| 18. | Tama | 420 | 41,625(1.01%)#18 | 10,767,104(0.00%)#2,155 |
| 19. | Osceola | 408 | 41,625(0.98%)#19 | 10,767,104(0.00%)#2,193 |
| 20. | Columbus Junction | 373 | 41,625(0.90%)#20 | 10,767,104(0.00%)#2,337 |
| 21. | Urbandale | 348 | 41,625(0.84%)#21 | 10,767,104(0.00%)#2,431 |
| 22. | Ames | 319 | 41,625(0.77%)#22 | 10,767,104(0.00%)#2,566 |
| 23. | Webster City | 310 | 41,625(0.74%)#23 | 10,767,104(0.00%)#2,613 |
| 24. | Fort Dodge | 309 | 41,625(0.74%)#24 | 10,767,104(0.00%)#2,618 |
| 25. | Dubuque | 299 | 41,625(0.72%)#25 | 10,767,104(0.00%)#2,672 |
| 26. | Washington | 292 | 41,625(0.70%)#26 | 10,767,104(0.00%)#2,722 |
| 27. | Ankeny | 288 | 41,625(0.69%)#27 | 10,767,104(0.00%)#2,745 |
| 28. | Estherville | 267 | 41,625(0.64%)#28 | 10,767,104(0.00%)#2,867 |
| 29. | Carter Lake | 250 | 41,625(0.60%)#29 | 10,767,104(0.00%)#2,972 |
| 30. | Mason City | 235 | 41,625(0.56%)#30 | 10,767,104(0.00%)#3,056 |
| 31. | Postville | 229 | 41,625(0.55%)#31 | 10,767,104(0.00%)#3,104 |
| 32. | Le Mars | 208 | 41,625(0.50%)#32 | 10,767,104(0.00%)#3,248 |
| 33. | Hampton | 199 | 41,625(0.48%)#33 | 10,767,104(0.00%)#3,343 |
| 34. | North Liberty | 180 | 41,625(0.43%)#34 | 10,767,104(0.00%)#3,554 |
| 35. | Marion | 171 | 41,625(0.41%)#35 | 10,767,104(0.00%)#3,658 |
| 36. | Waukee | 166 | 41,625(0.40%)#36 | 10,767,104(0.00%)#3,719 |
| 37. | Altoona | 148 | 41,625(0.36%)#37 | 10,767,104(0.00%)#3,954 |
| 38. | Algona | 146 | 41,625(0.35%)#38 | 10,767,104(0.00%)#3,994 |
| 39. | Lenox | 143 | 41,625(0.34%)#39 | 10,767,104(0.00%)#4,042 |
| 40. | Cedar Falls | 142 | 41,625(0.34%)#40 | 10,767,104(0.00%)#4,043 |
| 41. | Coralville | 136 | 41,625(0.33%)#41 | 10,767,104(0.00%)#4,117 |
| 42. | Hull | 136 | 41,625(0.33%)#42 | 10,767,104(0.00%)#4,122 |
| 43. | Mount Pleasant | 133 | 41,625(0.32%)#43 | 10,767,104(0.00%)#4,152 |
| 44. | Eagle Grove | 126 | 41,625(0.30%)#44 | 10,767,104(0.00%)#4,266 |
| 45. | Clinton | 124 | 41,625(0.30%)#45 | 10,767,104(0.00%)#4,301 |
| 46. | Pleasant Hill | 117 | 41,625(0.28%)#46 | 10,767,104(0.00%)#4,423 |
| 47. | Wapello | 115 | 41,625(0.28%)#47 | 10,767,104(0.00%)#4,462 |
| 48. | Fort Madison | 112 | 41,625(0.27%)#48 | 10,767,104(0.00%)#4,514 |
| 49. | Clarion | 112 | 41,625(0.27%)#49 | 10,767,104(0.00%)#4,523 |
| 50. | Belmond | 112 | 41,625(0.27%)#50 | 10,767,104(0.00%)#4,524 |
| 51. | Nevada | 107 | 41,625(0.26%)#51 | 10,767,104(0.00%)#4,610 |
| 52. | Clive | 106 | 41,625(0.25%)#52 | 10,767,104(0.00%)#4,620 |
| 53. | Johnston | 100 | 41,625(0.24%)#53 | 10,767,104(0.00%)#4,738 |
| 54. | Charles City | 99 | 41,625(0.24%)#54 | 10,767,104(0.00%)#4,760 |
| 55. | Newton | 92 | 41,625(0.22%)#55 | 10,767,104(0.00%)#4,904 |
| 56. | Sibley | 87 | 41,625(0.21%)#56 | 10,767,104(0.00%)#5,037 |
| 57. | Lakeside | 86 | 41,625(0.21%)#57 | 10,767,104(0.00%)#5,073 |
| 58. | Ackley | 85 | 41,625(0.20%)#58 | 10,767,104(0.00%)#5,092 |
| 59. | Bondurant | 84 | 41,625(0.20%)#59 | 10,767,104(0.00%)#5,114 |
| 60. | Spirit Lake | 81 | 41,625(0.19%)#60 | 10,767,104(0.00%)#5,192 |
| 61. | Harris | 81 | 41,625(0.19%)#61 | 10,767,104(0.00%)#5,201 |
| 62. | Conesville | 78 | 41,625(0.19%)#62 | 10,767,104(0.00%)#5,281 |
| 63. | New Hampton | 72 | 41,625(0.17%)#63 | 10,767,104(0.00%)#5,439 |
| 64. | Afton | 69 | 41,625(0.17%)#64 | 10,767,104(0.00%)#5,552 |
| 65. | Independence | 68 | 41,625(0.16%)#65 | 10,767,104(0.00%)#5,566 |
| 66. | Bettendorf | 67 | 41,625(0.16%)#66 | 10,767,104(0.00%)#5,584 |
| 67. | Iowa Falls | 67 | 41,625(0.16%)#67 | 10,767,104(0.00%)#5,602 |
| 68. | Marengo | 64 | 41,625(0.15%)#68 | 10,767,104(0.00%)#5,714 |
| 69. | Dyersville | 63 | 41,625(0.15%)#69 | 10,767,104(0.00%)#5,746 |
| 70. | Schaller | 62 | 41,625(0.15%)#70 | 10,767,104(0.00%)#5,796 |
| 71. | Vail | 61 | 41,625(0.15%)#71 | 10,767,104(0.00%)#5,836 |
| 72. | Pella | 58 | 41,625(0.14%)#72 | 10,767,104(0.00%)#5,929 |
| 73. | Kanawha | 58 | 41,625(0.14%)#73 | 10,767,104(0.00%)#5,941 |
| 74. | Ainsworth | 58 | 41,625(0.14%)#74 | 10,767,104(0.00%)#5,943 |
| 75. | Zearing | 56 | 41,625(0.13%)#75 | 10,767,104(0.00%)#6,028 |
| 76. | Tiffin | 55 | 41,625(0.13%)#76 | 10,767,104(0.00%)#6,051 |
| 77. | Schleswig | 54 | 41,625(0.13%)#77 | 10,767,104(0.00%)#6,116 |
| 78. | Latimer | 54 | 41,625(0.13%)#78 | 10,767,104(0.00%)#6,118 |
| 79. | Columbus City | 52 | 41,625(0.12%)#79 | 10,767,104(0.00%)#6,234 |
| 80. | Harlan | 51 | 41,625(0.12%)#80 | 10,767,104(0.00%)#6,257 |
| 81. | Story City | 51 | 41,625(0.12%)#81 | 10,767,104(0.00%)#6,259 |
| 82. | Rock Rapids | 51 | 41,625(0.12%)#82 | 10,767,104(0.00%)#6,264 |
| 83. | Alden | 51 | 41,625(0.12%)#83 | 10,767,104(0.00%)#6,270 |
| 84. | Carroll | 49 | 41,625(0.12%)#84 | 10,767,104(0.00%)#6,331 |
| 85. | Bloomfield | 48 | 41,625(0.12%)#85 | 10,767,104(0.00%)#6,403 |
| 86. | Guthrie Center | 47 | 41,625(0.11%)#86 | 10,767,104(0.00%)#6,453 |
| 87. | Chariton | 46 | 41,625(0.11%)#87 | 10,767,104(0.00%)#6,486 |
| 88. | Indianola | 45 | 41,625(0.11%)#88 | 10,767,104(0.00%)#6,524 |
| 89. | Aurelia | 45 | 41,625(0.11%)#89 | 10,767,104(0.00%)#6,573 |
| 90. | Sioux Rapids | 45 | 41,625(0.11%)#90 | 10,767,104(0.00%)#6,575 |
| 91. | Rock Valley | 44 | 41,625(0.11%)#91 | 10,767,104(0.00%)#6,606 |
| 92. | Burlington | 43 | 41,625(0.10%)#92 | 10,767,104(0.00%)#6,646 |
| 93. | Spencer | 43 | 41,625(0.10%)#93 | 10,767,104(0.00%)#6,652 |
| 94. | State Center | 43 | 41,625(0.10%)#94 | 10,767,104(0.00%)#6,677 |
| 95. | Clarinda | 42 | 41,625(0.10%)#95 | 10,767,104(0.00%)#6,724 |
| 96. | Adel | 41 | 41,625(0.10%)#96 | 10,767,104(0.00%)#6,782 |
| 97. | Jefferson | 41 | 41,625(0.10%)#97 | 10,767,104(0.00%)#6,786 |
| 98. | Ireton | 36 | 41,625(0.09%)#98 | 10,767,104(0.00%)#7,087 |
| 99. | Linn Grove | 36 | 41,625(0.09%)#99 | 10,767,104(0.00%)#7,096 |
| 100. | Fonda | 35 | 41,625(0.08%)#100 | 10,767,104(0.00%)#7,149 |
Common Questions
What are the Top 10 Cities with the Most Immigrants from Mexico in Iowa?
Top 10 Cities with the Most Immigrants from Mexico in Iowa are:
#1
7,074
#2
3,707
#3
3,206
#4
1,881
#5
1,697
#6
1,336
#7
1,087
#8
946
#9
852
#10
808
What city has the Most Immigrants from Mexico in Iowa?
Des Moines has the Most Immigrants from Mexico in Iowa with 7,074.
What is the Total Immigrants from Mexico in the State of Iowa?
Total Immigrants from Mexico in Iowa is 41,625.
What is the Total Immigrants from Mexico in the United States?
Total Immigrants from Mexico in the United States is 10,767,104.