Cities with the Most Immigrants from Mexico in North Dakota
RELATED REPORTS & OPTIONS
Mexico
North Dakota
Compare Cities
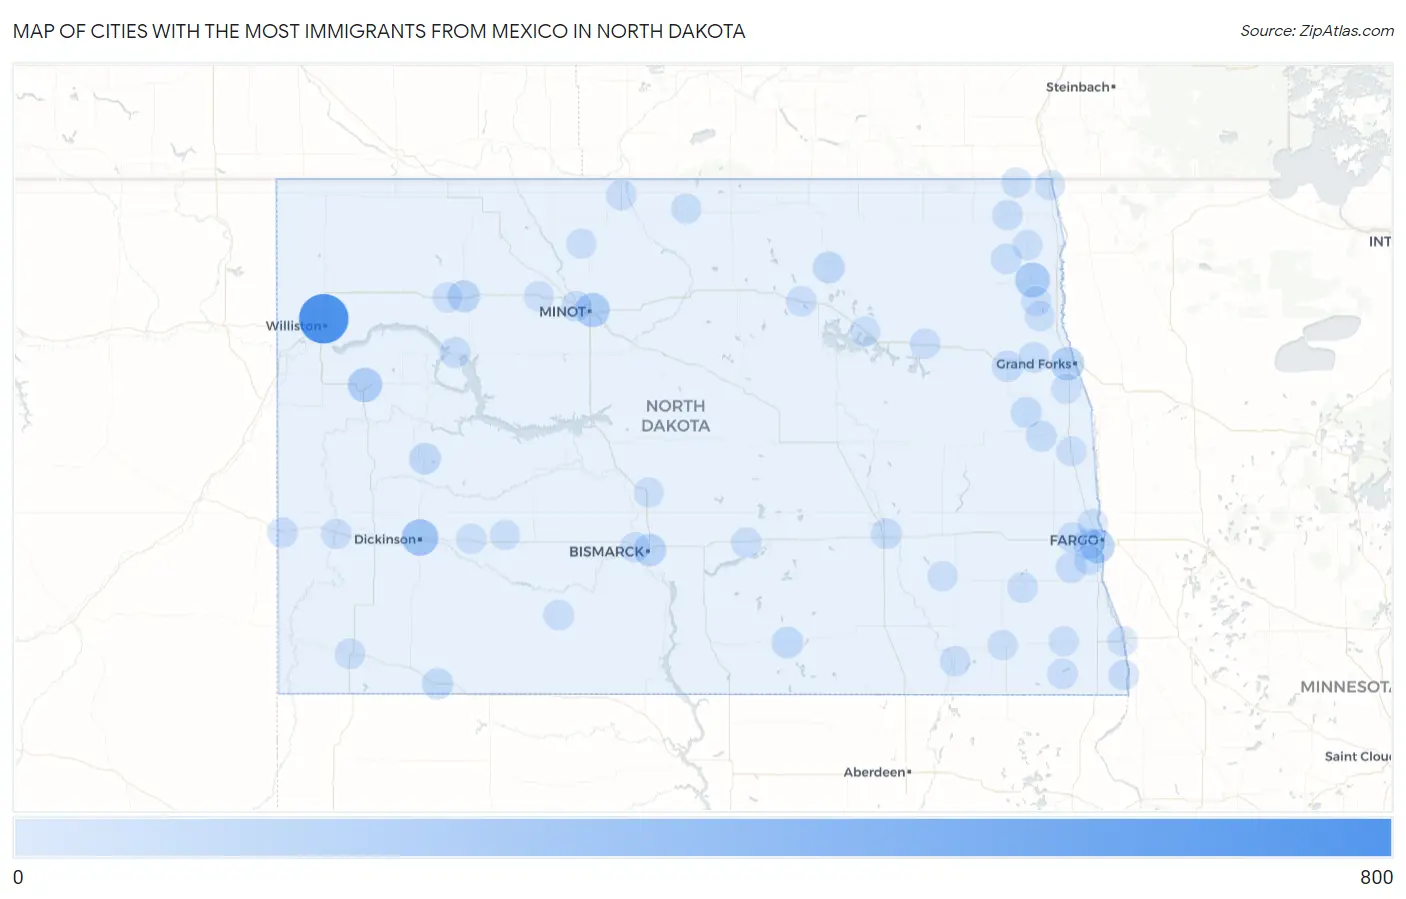
Map of Cities with the Most Immigrants from Mexico in North Dakota
0
800
Cities with the Most Immigrants from Mexico in North Dakota
| City | Mexico | vs State | vs National | |
| 1. | Williston | 724 | 2,889(25.06%)#1 | 10,767,104(0.01%)#1,481 |
| 2. | Dickinson | 230 | 2,889(7.96%)#2 | 10,767,104(0.00%)#3,093 |
| 3. | Grafton | 166 | 2,889(5.75%)#3 | 10,767,104(0.00%)#3,729 |
| 4. | Minot | 158 | 2,889(5.47%)#4 | 10,767,104(0.00%)#3,821 |
| 5. | Watford City | 153 | 2,889(5.30%)#5 | 10,767,104(0.00%)#3,891 |
| 6. | Fargo | 146 | 2,889(5.05%)#6 | 10,767,104(0.00%)#3,984 |
| 7. | Grand Forks | 124 | 2,889(4.29%)#7 | 10,767,104(0.00%)#4,298 |
| 8. | Bismarck | 80 | 2,889(2.77%)#8 | 10,767,104(0.00%)#5,202 |
| 9. | Stanley | 75 | 2,889(2.60%)#9 | 10,767,104(0.00%)#5,352 |
| 10. | Killdeer | 58 | 2,889(2.01%)#10 | 10,767,104(0.00%)#5,944 |
| 11. | Cando | 56 | 2,889(1.94%)#11 | 10,767,104(0.00%)#6,026 |
| 12. | West Fargo | 51 | 2,889(1.77%)#12 | 10,767,104(0.00%)#6,239 |
| 13. | Wishek | 49 | 2,889(1.70%)#13 | 10,767,104(0.00%)#6,364 |
| 14. | Hettinger | 44 | 2,889(1.52%)#14 | 10,767,104(0.00%)#6,628 |
| 15. | Larimore | 40 | 2,889(1.38%)#15 | 10,767,104(0.00%)#6,854 |
| 16. | Hatton | 33 | 2,889(1.14%)#16 | 10,767,104(0.00%)#7,302 |
| 17. | Grand Forks Afb | 30 | 2,889(1.04%)#17 | 10,767,104(0.00%)#7,470 |
| 18. | Mayville | 28 | 2,889(0.97%)#18 | 10,767,104(0.00%)#7,625 |
| 19. | Jamestown | 27 | 2,889(0.93%)#19 | 10,767,104(0.00%)#7,667 |
| 20. | New Town | 25 | 2,889(0.87%)#20 | 10,767,104(0.00%)#7,855 |
| 21. | Davenport | 21 | 2,889(0.73%)#21 | 10,767,104(0.00%)#8,316 |
| 22. | Burlington | 20 | 2,889(0.69%)#22 | 10,767,104(0.00%)#8,407 |
| 23. | Mapleton | 20 | 2,889(0.69%)#23 | 10,767,104(0.00%)#8,414 |
| 24. | Hoople | 19 | 2,889(0.66%)#24 | 10,767,104(0.00%)#8,558 |
| 25. | Cavalier | 17 | 2,889(0.59%)#25 | 10,767,104(0.00%)#8,765 |
| 26. | Sheldon | 17 | 2,889(0.59%)#26 | 10,767,104(0.00%)#8,815 |
| 27. | Fairmount | 16 | 2,889(0.55%)#27 | 10,767,104(0.00%)#8,945 |
| 28. | Mandan | 15 | 2,889(0.52%)#28 | 10,767,104(0.00%)#8,965 |
| 29. | Bowman | 15 | 2,889(0.52%)#29 | 10,767,104(0.00%)#9,030 |
| 30. | Carson | 14 | 2,889(0.48%)#30 | 10,767,104(0.00%)#9,227 |
| 31. | Oakes | 13 | 2,889(0.45%)#31 | 10,767,104(0.00%)#9,303 |
| 32. | Leeds | 13 | 2,889(0.45%)#32 | 10,767,104(0.00%)#9,373 |
| 33. | Westhope | 13 | 2,889(0.45%)#33 | 10,767,104(0.00%)#9,383 |
| 34. | Beach | 12 | 2,889(0.42%)#34 | 10,767,104(0.00%)#9,518 |
| 35. | Lidgerwood | 12 | 2,889(0.42%)#35 | 10,767,104(0.00%)#9,532 |
| 36. | Medora | 12 | 2,889(0.42%)#36 | 10,767,104(0.00%)#9,573 |
| 37. | Lakota | 11 | 2,889(0.38%)#37 | 10,767,104(0.00%)#9,702 |
| 38. | Steele | 9 | 2,889(0.31%)#38 | 10,767,104(0.00%)#10,073 |
| 39. | Horace | 7 | 2,889(0.24%)#39 | 10,767,104(0.00%)#10,435 |
| 40. | Bottineau | 7 | 2,889(0.24%)#40 | 10,767,104(0.00%)#10,466 |
| 41. | Richardton | 6 | 2,889(0.21%)#41 | 10,767,104(0.00%)#10,799 |
| 42. | Wahpeton | 5 | 2,889(0.17%)#42 | 10,767,104(0.00%)#10,919 |
| 43. | Wyndmere | 5 | 2,889(0.17%)#43 | 10,767,104(0.00%)#11,106 |
| 44. | St Thomas | 5 | 2,889(0.17%)#44 | 10,767,104(0.00%)#11,143 |
| 45. | Thompson | 4 | 2,889(0.14%)#45 | 10,767,104(0.00%)#11,321 |
| 46. | Gwinner | 4 | 2,889(0.14%)#46 | 10,767,104(0.00%)#11,343 |
| 47. | Harwood | 4 | 2,889(0.14%)#47 | 10,767,104(0.00%)#11,356 |
| 48. | Pembina | 4 | 2,889(0.14%)#48 | 10,767,104(0.00%)#11,384 |
| 49. | Ardoch | 4 | 2,889(0.14%)#49 | 10,767,104(0.00%)#11,484 |
| 50. | Devils Lake | 3 | 2,889(0.10%)#50 | 10,767,104(0.00%)#11,498 |
| 51. | Minto | 3 | 2,889(0.10%)#51 | 10,767,104(0.00%)#11,672 |
| 52. | Hillsboro | 2 | 2,889(0.07%)#52 | 10,767,104(0.00%)#11,894 |
| 53. | Wilton | 2 | 2,889(0.07%)#53 | 10,767,104(0.00%)#11,976 |
| 54. | Neche | 2 | 2,889(0.07%)#54 | 10,767,104(0.00%)#12,052 |
| 55. | Lansford | 2 | 2,889(0.07%)#55 | 10,767,104(0.00%)#12,117 |
| 56. | Ross | 2 | 2,889(0.07%)#56 | 10,767,104(0.00%)#12,134 |
| 57. | Litchville | 2 | 2,889(0.07%)#57 | 10,767,104(0.00%)#12,152 |
| 58. | Hebron | 1 | 2,889(0.03%)#58 | 10,767,104(0.00%)#12,317 |
| 59. | Berthold | 1 | 2,889(0.03%)#59 | 10,767,104(0.00%)#12,359 |
Common Questions
What are the Top 10 Cities with the Most Immigrants from Mexico in North Dakota?
Top 10 Cities with the Most Immigrants from Mexico in North Dakota are:
#1
724
#2
230
#3
166
#4
158
#5
153
#6
146
#7
124
#8
80
#9
75
#10
58
What city has the Most Immigrants from Mexico in North Dakota?
Williston has the Most Immigrants from Mexico in North Dakota with 724.
What is the Total Immigrants from Mexico in the State of North Dakota?
Total Immigrants from Mexico in North Dakota is 2,889.
What is the Total Immigrants from Mexico in the United States?
Total Immigrants from Mexico in the United States is 10,767,104.