Cities with the Most Immigrants from Mexico in Texas
RELATED REPORTS & OPTIONS
Mexico
Texas
Compare Cities
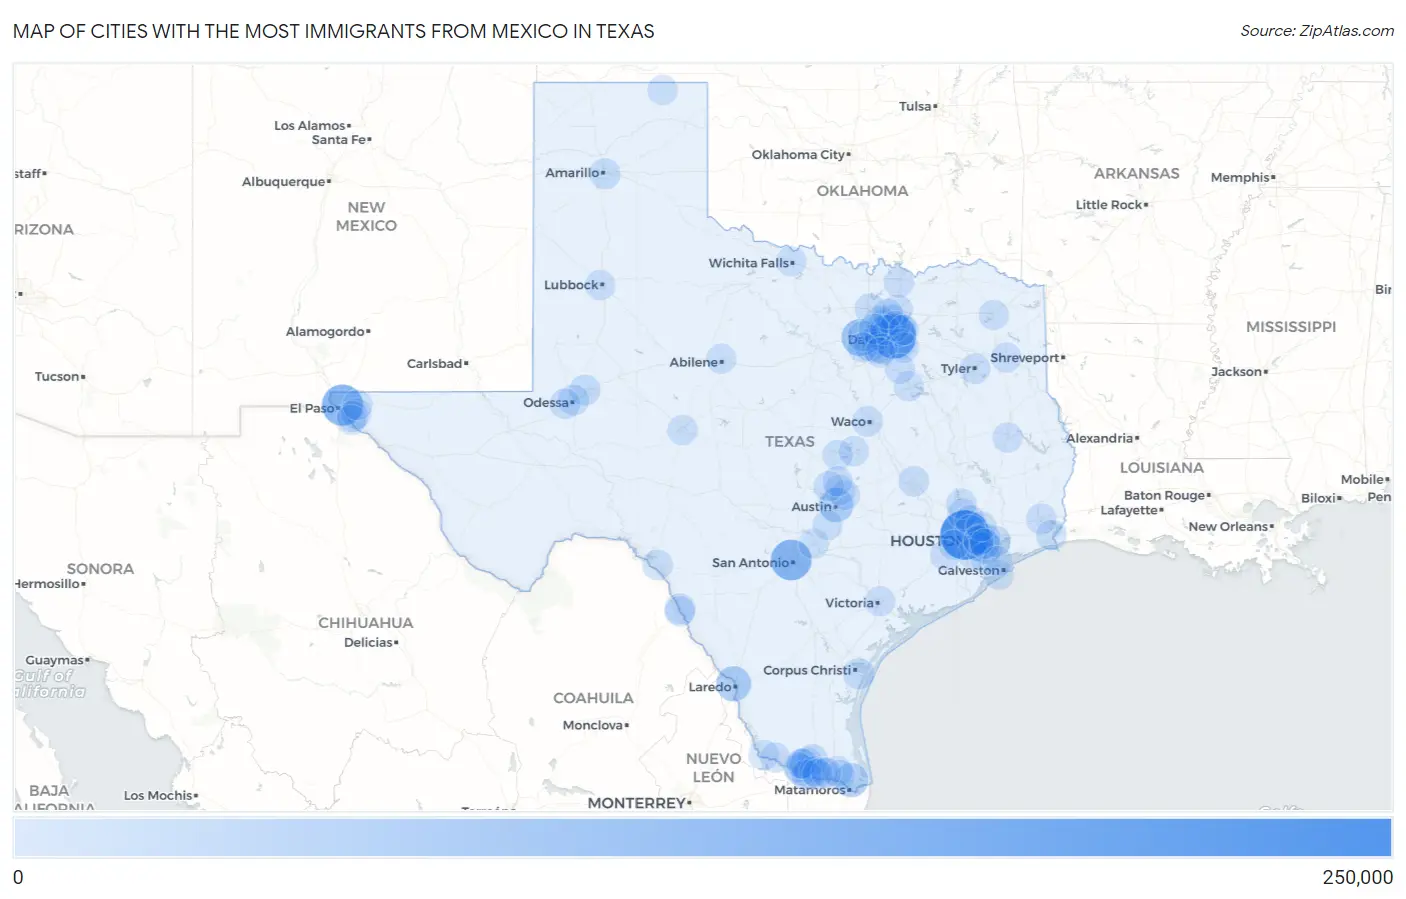
Map of Cities with the Most Immigrants from Mexico in Texas
0
250,000
Cities with the Most Immigrants from Mexico in Texas
| City | Mexico | vs State | vs National | |
| 1. | Houston | 238,486 | 2,411,723(9.89%)#1 | 10,767,104(2.21%)#2 |
| 2. | Dallas | 176,435 | 2,411,723(7.32%)#2 | 10,767,104(1.64%)#5 |
| 3. | El Paso | 133,665 | 2,411,723(5.54%)#3 | 10,767,104(1.24%)#7 |
| 4. | San Antonio | 128,973 | 2,411,723(5.35%)#4 | 10,767,104(1.20%)#8 |
| 5. | Fort Worth | 82,118 | 2,411,723(3.40%)#5 | 10,767,104(0.76%)#12 |
| 6. | Laredo | 59,934 | 2,411,723(2.49%)#6 | 10,767,104(0.56%)#13 |
| 7. | Austin | 54,270 | 2,411,723(2.25%)#7 | 10,767,104(0.50%)#16 |
| 8. | Brownsville | 47,668 | 2,411,723(1.98%)#8 | 10,767,104(0.44%)#22 |
| 9. | Garland | 32,864 | 2,411,723(1.36%)#9 | 10,767,104(0.31%)#34 |
| 10. | Mcallen | 31,812 | 2,411,723(1.32%)#10 | 10,767,104(0.30%)#37 |
| 11. | Pasadena | 29,849 | 2,411,723(1.24%)#11 | 10,767,104(0.28%)#43 |
| 12. | Arlington | 29,153 | 2,411,723(1.21%)#12 | 10,767,104(0.27%)#47 |
| 13. | Irving | 27,471 | 2,411,723(1.14%)#13 | 10,767,104(0.26%)#51 |
| 14. | Grand Prairie | 24,720 | 2,411,723(1.02%)#14 | 10,767,104(0.23%)#54 |
| 15. | Pharr | 23,281 | 2,411,723(0.97%)#15 | 10,767,104(0.22%)#56 |
| 16. | Mission | 21,447 | 2,411,723(0.89%)#16 | 10,767,104(0.20%)#61 |
| 17. | Edinburg | 16,738 | 2,411,723(0.69%)#17 | 10,767,104(0.16%)#81 |
| 18. | Corpus Christi | 16,302 | 2,411,723(0.68%)#18 | 10,767,104(0.15%)#88 |
| 19. | Baytown | 12,947 | 2,411,723(0.54%)#19 | 10,767,104(0.12%)#111 |
| 20. | Carrollton | 12,223 | 2,411,723(0.51%)#20 | 10,767,104(0.11%)#118 |
| 21. | Socorro | 11,517 | 2,411,723(0.48%)#21 | 10,767,104(0.11%)#125 |
| 22. | Amarillo | 11,415 | 2,411,723(0.47%)#22 | 10,767,104(0.11%)#127 |
| 23. | Midland | 11,032 | 2,411,723(0.46%)#23 | 10,767,104(0.10%)#133 |
| 24. | Odessa | 11,013 | 2,411,723(0.46%)#24 | 10,767,104(0.10%)#135 |
| 25. | Channelview | 10,681 | 2,411,723(0.44%)#25 | 10,767,104(0.10%)#136 |
| 26. | Waco | 9,596 | 2,411,723(0.40%)#26 | 10,767,104(0.09%)#156 |
| 27. | Plano | 8,794 | 2,411,723(0.36%)#27 | 10,767,104(0.08%)#172 |
| 28. | Bryan | 8,405 | 2,411,723(0.35%)#28 | 10,767,104(0.08%)#179 |
| 29. | Lewisville | 7,994 | 2,411,723(0.33%)#29 | 10,767,104(0.07%)#183 |
| 30. | Eagle Pass | 7,950 | 2,411,723(0.33%)#30 | 10,767,104(0.07%)#186 |
| 31. | Harlingen | 7,673 | 2,411,723(0.32%)#31 | 10,767,104(0.07%)#197 |
| 32. | Denton | 7,488 | 2,411,723(0.31%)#32 | 10,767,104(0.07%)#202 |
| 33. | Mckinney | 7,170 | 2,411,723(0.30%)#33 | 10,767,104(0.07%)#210 |
| 34. | Beaumont | 6,817 | 2,411,723(0.28%)#34 | 10,767,104(0.06%)#224 |
| 35. | Del Rio | 6,765 | 2,411,723(0.28%)#35 | 10,767,104(0.06%)#225 |
| 36. | Tyler | 6,657 | 2,411,723(0.28%)#36 | 10,767,104(0.06%)#228 |
| 37. | West Odessa | 6,434 | 2,411,723(0.27%)#37 | 10,767,104(0.06%)#237 |
| 38. | Port Arthur | 6,387 | 2,411,723(0.26%)#38 | 10,767,104(0.06%)#238 |
| 39. | Weslaco | 5,824 | 2,411,723(0.24%)#39 | 10,767,104(0.05%)#257 |
| 40. | Round Rock | 5,686 | 2,411,723(0.24%)#40 | 10,767,104(0.05%)#262 |
| 41. | Alton | 5,555 | 2,411,723(0.23%)#41 | 10,767,104(0.05%)#268 |
| 42. | Haltom City | 5,512 | 2,411,723(0.23%)#42 | 10,767,104(0.05%)#270 |
| 43. | Cloverleaf | 5,431 | 2,411,723(0.23%)#43 | 10,767,104(0.05%)#277 |
| 44. | Balch Springs | 5,420 | 2,411,723(0.22%)#44 | 10,767,104(0.05%)#278 |
| 45. | Longview | 5,402 | 2,411,723(0.22%)#45 | 10,767,104(0.05%)#280 |
| 46. | Horizon City | 5,291 | 2,411,723(0.22%)#46 | 10,767,104(0.05%)#284 |
| 47. | The Woodlands | 5,255 | 2,411,723(0.22%)#47 | 10,767,104(0.05%)#288 |
| 48. | Palmview | 5,250 | 2,411,723(0.22%)#48 | 10,767,104(0.05%)#289 |
| 49. | Lubbock | 5,226 | 2,411,723(0.22%)#49 | 10,767,104(0.05%)#294 |
| 50. | Conroe | 4,961 | 2,411,723(0.21%)#50 | 10,767,104(0.05%)#313 |
| 51. | Hidalgo | 4,956 | 2,411,723(0.21%)#51 | 10,767,104(0.05%)#315 |
| 52. | Farmers Branch | 4,573 | 2,411,723(0.19%)#52 | 10,767,104(0.04%)#339 |
| 53. | New Braunfels | 4,374 | 2,411,723(0.18%)#53 | 10,767,104(0.04%)#351 |
| 54. | Aldine | 4,324 | 2,411,723(0.18%)#54 | 10,767,104(0.04%)#356 |
| 55. | Alamo | 4,204 | 2,411,723(0.17%)#55 | 10,767,104(0.04%)#367 |
| 56. | Richardson | 4,127 | 2,411,723(0.17%)#56 | 10,767,104(0.04%)#375 |
| 57. | Pearland | 4,023 | 2,411,723(0.17%)#57 | 10,767,104(0.04%)#388 |
| 58. | Frisco | 4,000 | 2,411,723(0.17%)#58 | 10,767,104(0.04%)#391 |
| 59. | Spring | 3,968 | 2,411,723(0.16%)#59 | 10,767,104(0.04%)#393 |
| 60. | San Benito | 3,954 | 2,411,723(0.16%)#60 | 10,767,104(0.04%)#395 |
| 61. | Killeen | 3,948 | 2,411,723(0.16%)#61 | 10,767,104(0.04%)#397 |
| 62. | Roma | 3,939 | 2,411,723(0.16%)#62 | 10,767,104(0.04%)#398 |
| 63. | Duncanville | 3,932 | 2,411,723(0.16%)#63 | 10,767,104(0.04%)#400 |
| 64. | San Angelo | 3,875 | 2,411,723(0.16%)#64 | 10,767,104(0.04%)#406 |
| 65. | South Houston | 3,729 | 2,411,723(0.15%)#65 | 10,767,104(0.03%)#416 |
| 66. | Rosenberg | 3,678 | 2,411,723(0.15%)#66 | 10,767,104(0.03%)#419 |
| 67. | Lufkin | 3,635 | 2,411,723(0.15%)#67 | 10,767,104(0.03%)#428 |
| 68. | Seagoville | 3,532 | 2,411,723(0.15%)#68 | 10,767,104(0.03%)#437 |
| 69. | Abilene | 3,478 | 2,411,723(0.14%)#69 | 10,767,104(0.03%)#443 |
| 70. | Pflugerville | 3,382 | 2,411,723(0.14%)#70 | 10,767,104(0.03%)#451 |
| 71. | Rio Grande City | 3,246 | 2,411,723(0.13%)#71 | 10,767,104(0.03%)#467 |
| 72. | Corsicana | 3,222 | 2,411,723(0.13%)#72 | 10,767,104(0.03%)#469 |
| 73. | Temple | 3,218 | 2,411,723(0.13%)#73 | 10,767,104(0.03%)#470 |
| 74. | La Homa | 3,173 | 2,411,723(0.13%)#74 | 10,767,104(0.03%)#474 |
| 75. | League City | 3,117 | 2,411,723(0.13%)#75 | 10,767,104(0.03%)#483 |
| 76. | Victoria | 3,102 | 2,411,723(0.13%)#76 | 10,767,104(0.03%)#487 |
| 77. | Galena Park | 3,099 | 2,411,723(0.13%)#77 | 10,767,104(0.03%)#488 |
| 78. | San Elizario | 3,098 | 2,411,723(0.13%)#78 | 10,767,104(0.03%)#489 |
| 79. | Ennis | 3,077 | 2,411,723(0.13%)#79 | 10,767,104(0.03%)#496 |
| 80. | Mount Pleasant | 3,073 | 2,411,723(0.13%)#80 | 10,767,104(0.03%)#497 |
| 81. | Sherman | 3,049 | 2,411,723(0.13%)#81 | 10,767,104(0.03%)#500 |
| 82. | Jacinto City | 3,049 | 2,411,723(0.13%)#82 | 10,767,104(0.03%)#501 |
| 83. | Wichita Falls | 2,898 | 2,411,723(0.12%)#83 | 10,767,104(0.03%)#520 |
| 84. | Atascocita | 2,862 | 2,411,723(0.12%)#84 | 10,767,104(0.03%)#528 |
| 85. | Donna | 2,859 | 2,411,723(0.12%)#85 | 10,767,104(0.03%)#529 |
| 86. | Perryton | 2,849 | 2,411,723(0.12%)#86 | 10,767,104(0.03%)#530 |
| 87. | Eidson Road | 2,831 | 2,411,723(0.12%)#87 | 10,767,104(0.03%)#532 |
| 88. | Grapevine | 2,824 | 2,411,723(0.12%)#88 | 10,767,104(0.03%)#533 |
| 89. | Cedar Hill | 2,806 | 2,411,723(0.12%)#89 | 10,767,104(0.03%)#536 |
| 90. | Kyle | 2,792 | 2,411,723(0.12%)#90 | 10,767,104(0.03%)#539 |
| 91. | Leander | 2,711 | 2,411,723(0.11%)#91 | 10,767,104(0.03%)#547 |
| 92. | Forest Hill | 2,629 | 2,411,723(0.11%)#92 | 10,767,104(0.02%)#559 |
| 93. | Mission Bend | 2,625 | 2,411,723(0.11%)#93 | 10,767,104(0.02%)#560 |
| 94. | Galveston | 2,574 | 2,411,723(0.11%)#94 | 10,767,104(0.02%)#575 |
| 95. | Rowlett | 2,573 | 2,411,723(0.11%)#95 | 10,767,104(0.02%)#577 |
| 96. | Homestead Meadows South | 2,504 | 2,411,723(0.10%)#96 | 10,767,104(0.02%)#595 |
| 97. | Deer Park | 2,403 | 2,411,723(0.10%)#97 | 10,767,104(0.02%)#612 |
| 98. | Texas City | 2,391 | 2,411,723(0.10%)#98 | 10,767,104(0.02%)#615 |
| 99. | Mercedes | 2,315 | 2,411,723(0.10%)#99 | 10,767,104(0.02%)#631 |
| 100. | Georgetown | 2,291 | 2,411,723(0.09%)#100 | 10,767,104(0.02%)#637 |
Common Questions
What are the Top 10 Cities with the Most Immigrants from Mexico in Texas?
Top 10 Cities with the Most Immigrants from Mexico in Texas are:
#1
238,486
#2
176,435
#3
133,665
#4
128,973
#5
82,118
#6
59,934
#7
54,270
#8
47,668
#9
32,864
#10
31,812
What city has the Most Immigrants from Mexico in Texas?
Houston has the Most Immigrants from Mexico in Texas with 238,486.
What is the Total Immigrants from Mexico in the State of Texas?
Total Immigrants from Mexico in Texas is 2,411,723.
What is the Total Immigrants from Mexico in the United States?
Total Immigrants from Mexico in the United States is 10,767,104.