Cities with the Most Immigrants from Mexico in South Carolina
RELATED REPORTS & OPTIONS
Mexico
South Carolina
Compare Cities
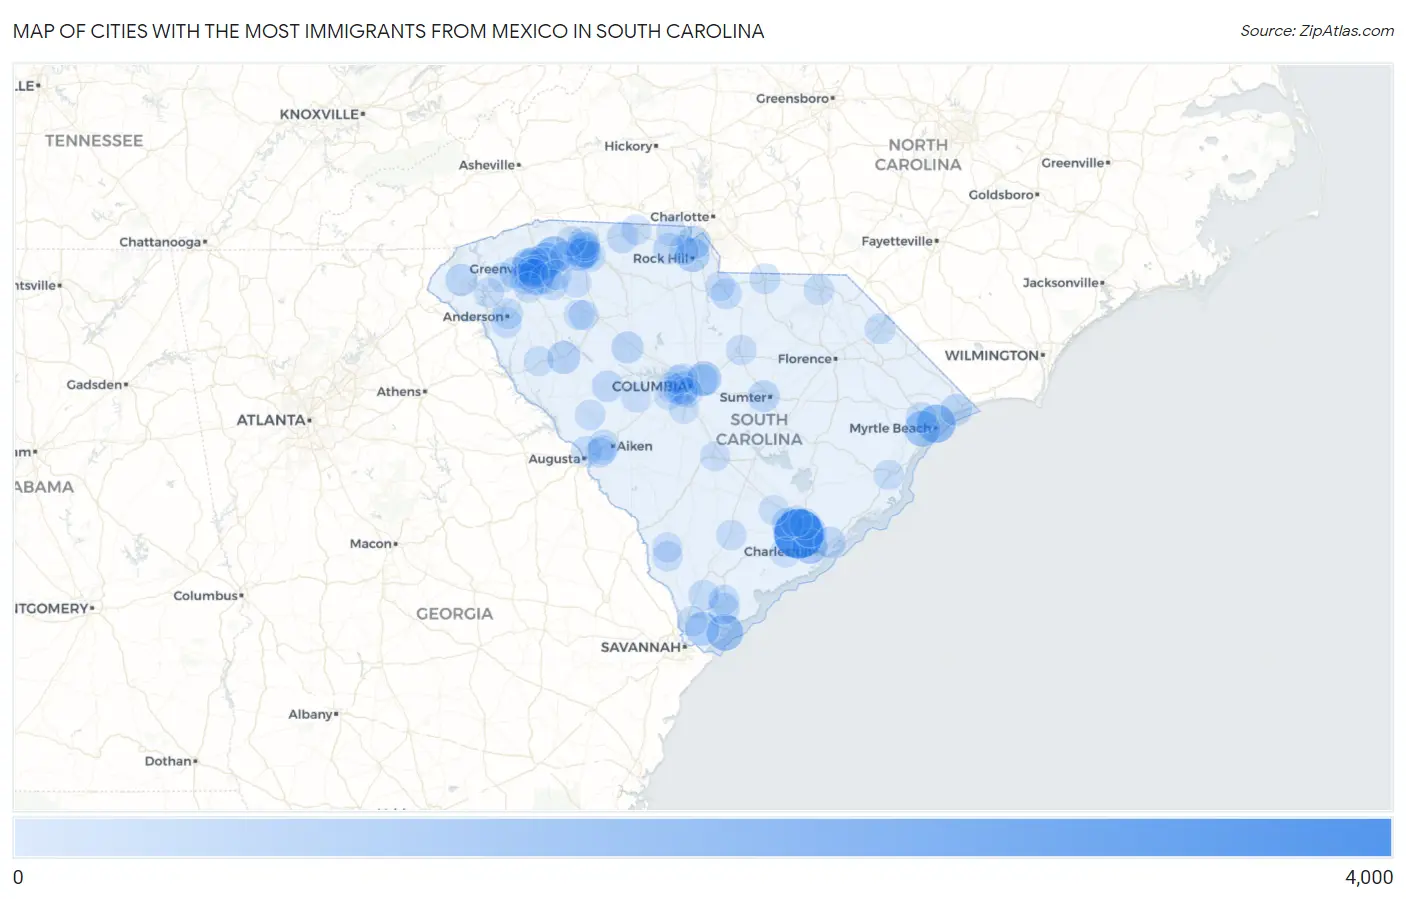
Map of Cities with the Most Immigrants from Mexico in South Carolina
0
4,000
Cities with the Most Immigrants from Mexico in South Carolina
| City | Mexico | vs State | vs National | |
| 1. | North Charleston | 3,366 | 60,774(5.54%)#1 | 10,767,104(0.03%)#456 |
| 2. | Myrtle Beach | 1,425 | 60,774(2.34%)#2 | 10,767,104(0.01%)#912 |
| 3. | Greer | 1,258 | 60,774(2.07%)#3 | 10,767,104(0.01%)#990 |
| 4. | Hilton Head Island | 1,109 | 60,774(1.82%)#4 | 10,767,104(0.01%)#1,083 |
| 5. | Socastee | 992 | 60,774(1.63%)#5 | 10,767,104(0.01%)#1,173 |
| 6. | Taylors | 922 | 60,774(1.52%)#6 | 10,767,104(0.01%)#1,242 |
| 7. | Gantt | 873 | 60,774(1.44%)#7 | 10,767,104(0.01%)#1,296 |
| 8. | Charleston | 847 | 60,774(1.39%)#8 | 10,767,104(0.01%)#1,321 |
| 9. | Woodfield | 775 | 60,774(1.28%)#9 | 10,767,104(0.01%)#1,415 |
| 10. | Parker | 759 | 60,774(1.25%)#10 | 10,767,104(0.01%)#1,447 |
| 11. | Southern Shops | 727 | 60,774(1.20%)#11 | 10,767,104(0.01%)#1,478 |
| 12. | Rock Hill | 702 | 60,774(1.16%)#12 | 10,767,104(0.01%)#1,517 |
| 13. | Bluffton | 682 | 60,774(1.12%)#13 | 10,767,104(0.01%)#1,555 |
| 14. | Berea | 647 | 60,774(1.06%)#14 | 10,767,104(0.01%)#1,615 |
| 15. | Tega Cay | 587 | 60,774(0.97%)#15 | 10,767,104(0.01%)#1,728 |
| 16. | Wade Hampton | 542 | 60,774(0.89%)#16 | 10,767,104(0.01%)#1,818 |
| 17. | Greenwood | 497 | 60,774(0.82%)#17 | 10,767,104(0.00%)#1,936 |
| 18. | Greenville | 449 | 60,774(0.74%)#18 | 10,767,104(0.00%)#2,064 |
| 19. | Welcome | 438 | 60,774(0.72%)#19 | 10,767,104(0.00%)#2,098 |
| 20. | Hanahan | 426 | 60,774(0.70%)#20 | 10,767,104(0.00%)#2,136 |
| 21. | West Columbia | 415 | 60,774(0.68%)#21 | 10,767,104(0.00%)#2,168 |
| 22. | Carolina Forest | 394 | 60,774(0.65%)#22 | 10,767,104(0.00%)#2,247 |
| 23. | Walhalla | 382 | 60,774(0.63%)#23 | 10,767,104(0.00%)#2,294 |
| 24. | Fairforest | 382 | 60,774(0.63%)#24 | 10,767,104(0.00%)#2,297 |
| 25. | Newberry | 371 | 60,774(0.61%)#25 | 10,767,104(0.00%)#2,339 |
| 26. | Summerville | 364 | 60,774(0.60%)#26 | 10,767,104(0.00%)#2,363 |
| 27. | Saxon | 346 | 60,774(0.57%)#27 | 10,767,104(0.00%)#2,448 |
| 28. | Sumter | 345 | 60,774(0.57%)#28 | 10,767,104(0.00%)#2,451 |
| 29. | North Myrtle Beach | 338 | 60,774(0.56%)#29 | 10,767,104(0.00%)#2,484 |
| 30. | Arcadia | 335 | 60,774(0.55%)#30 | 10,767,104(0.00%)#2,504 |
| 31. | Boiling Springs | 297 | 60,774(0.49%)#31 | 10,767,104(0.00%)#2,688 |
| 32. | Columbia | 296 | 60,774(0.49%)#32 | 10,767,104(0.00%)#2,689 |
| 33. | Mount Pleasant | 295 | 60,774(0.49%)#33 | 10,767,104(0.00%)#2,696 |
| 34. | Gaffney | 291 | 60,774(0.48%)#34 | 10,767,104(0.00%)#2,727 |
| 35. | Port Royal | 287 | 60,774(0.47%)#35 | 10,767,104(0.00%)#2,756 |
| 36. | Saluda | 282 | 60,774(0.46%)#36 | 10,767,104(0.00%)#2,782 |
| 37. | York | 274 | 60,774(0.45%)#37 | 10,767,104(0.00%)#2,820 |
| 38. | Sans Souci | 272 | 60,774(0.45%)#38 | 10,767,104(0.00%)#2,837 |
| 39. | Easley | 257 | 60,774(0.42%)#39 | 10,767,104(0.00%)#2,930 |
| 40. | Spartanburg | 246 | 60,774(0.40%)#40 | 10,767,104(0.00%)#2,990 |
| 41. | Goose Creek | 212 | 60,774(0.35%)#41 | 10,767,104(0.00%)#3,218 |
| 42. | Ladson | 208 | 60,774(0.34%)#42 | 10,767,104(0.00%)#3,247 |
| 43. | Elgin | 206 | 60,774(0.34%)#43 | 10,767,104(0.00%)#3,264 |
| 44. | Conestee | 203 | 60,774(0.33%)#44 | 10,767,104(0.00%)#3,309 |
| 45. | Arkwright | 198 | 60,774(0.33%)#45 | 10,767,104(0.00%)#3,355 |
| 46. | Powdersville | 196 | 60,774(0.32%)#46 | 10,767,104(0.00%)#3,373 |
| 47. | Simpsonville | 192 | 60,774(0.32%)#47 | 10,767,104(0.00%)#3,409 |
| 48. | Homeland Park | 190 | 60,774(0.31%)#48 | 10,767,104(0.00%)#3,430 |
| 49. | Red Hill | 182 | 60,774(0.30%)#49 | 10,767,104(0.00%)#3,523 |
| 50. | Mauldin | 181 | 60,774(0.30%)#50 | 10,767,104(0.00%)#3,534 |
| 51. | Judson | 180 | 60,774(0.30%)#51 | 10,767,104(0.00%)#3,559 |
| 52. | Oak Grove | 162 | 60,774(0.27%)#52 | 10,767,104(0.00%)#3,777 |
| 53. | Graniteville | 161 | 60,774(0.26%)#53 | 10,767,104(0.00%)#3,797 |
| 54. | Ridgeland | 160 | 60,774(0.26%)#54 | 10,767,104(0.00%)#3,807 |
| 55. | North Augusta | 155 | 60,774(0.26%)#55 | 10,767,104(0.00%)#3,855 |
| 56. | Burton | 155 | 60,774(0.26%)#56 | 10,767,104(0.00%)#3,864 |
| 57. | Whitney | 153 | 60,774(0.25%)#57 | 10,767,104(0.00%)#3,895 |
| 58. | Pageland | 149 | 60,774(0.25%)#58 | 10,767,104(0.00%)#3,947 |
| 59. | Dillon | 146 | 60,774(0.24%)#59 | 10,767,104(0.00%)#3,991 |
| 60. | Anderson | 144 | 60,774(0.24%)#60 | 10,767,104(0.00%)#4,012 |
| 61. | St Andrews | 140 | 60,774(0.23%)#61 | 10,767,104(0.00%)#4,069 |
| 62. | Litchfield Beach | 126 | 60,774(0.21%)#62 | 10,767,104(0.00%)#4,260 |
| 63. | Hardeeville | 124 | 60,774(0.20%)#63 | 10,767,104(0.00%)#4,305 |
| 64. | Blacksburg | 111 | 60,774(0.18%)#64 | 10,767,104(0.00%)#4,544 |
| 65. | Estill | 110 | 60,774(0.18%)#65 | 10,767,104(0.00%)#4,557 |
| 66. | Liberty | 107 | 60,774(0.18%)#66 | 10,767,104(0.00%)#4,612 |
| 67. | Georgetown | 106 | 60,774(0.17%)#67 | 10,767,104(0.00%)#4,624 |
| 68. | Walterboro | 106 | 60,774(0.17%)#68 | 10,767,104(0.00%)#4,628 |
| 69. | Cheraw | 106 | 60,774(0.17%)#69 | 10,767,104(0.00%)#4,630 |
| 70. | Laurens | 104 | 60,774(0.17%)#70 | 10,767,104(0.00%)#4,660 |
| 71. | Camden | 103 | 60,774(0.17%)#71 | 10,767,104(0.00%)#4,679 |
| 72. | Edgefield | 100 | 60,774(0.16%)#72 | 10,767,104(0.00%)#4,747 |
| 73. | Piedmont | 90 | 60,774(0.15%)#73 | 10,767,104(0.00%)#4,963 |
| 74. | Duncan | 90 | 60,774(0.15%)#74 | 10,767,104(0.00%)#4,968 |
| 75. | Springdale | 88 | 60,774(0.14%)#75 | 10,767,104(0.00%)#5,018 |
| 76. | Newport | 86 | 60,774(0.14%)#76 | 10,767,104(0.00%)#5,058 |
| 77. | Watts Mills | 84 | 60,774(0.14%)#77 | 10,767,104(0.00%)#5,126 |
| 78. | Five Forks | 83 | 60,774(0.14%)#78 | 10,767,104(0.00%)#5,138 |
| 79. | Lexington | 81 | 60,774(0.13%)#79 | 10,767,104(0.00%)#5,181 |
| 80. | Clover | 81 | 60,774(0.13%)#80 | 10,767,104(0.00%)#5,190 |
| 81. | Cayce | 79 | 60,774(0.13%)#81 | 10,767,104(0.00%)#5,235 |
| 82. | Dunean | 79 | 60,774(0.13%)#82 | 10,767,104(0.00%)#5,244 |
| 83. | Batesburg Leesville | 77 | 60,774(0.13%)#83 | 10,767,104(0.00%)#5,291 |
| 84. | Abbeville | 76 | 60,774(0.13%)#84 | 10,767,104(0.00%)#5,321 |
| 85. | Unity | 75 | 60,774(0.12%)#85 | 10,767,104(0.00%)#5,359 |
| 86. | Luray | 71 | 60,774(0.12%)#86 | 10,767,104(0.00%)#5,488 |
| 87. | Ridgeville | 68 | 60,774(0.11%)#87 | 10,767,104(0.00%)#5,575 |
| 88. | Lancaster | 65 | 60,774(0.11%)#88 | 10,767,104(0.00%)#5,667 |
| 89. | Valley Falls | 64 | 60,774(0.11%)#89 | 10,767,104(0.00%)#5,706 |
| 90. | Inman | 64 | 60,774(0.11%)#90 | 10,767,104(0.00%)#5,713 |
| 91. | Langley | 64 | 60,774(0.11%)#91 | 10,767,104(0.00%)#5,721 |
| 92. | Red Bank | 61 | 60,774(0.10%)#92 | 10,767,104(0.00%)#5,810 |
| 93. | Seven Oaks | 59 | 60,774(0.10%)#93 | 10,767,104(0.00%)#5,875 |
| 94. | Woodruff | 59 | 60,774(0.10%)#94 | 10,767,104(0.00%)#5,893 |
| 95. | Wilkinson Heights | 59 | 60,774(0.10%)#95 | 10,767,104(0.00%)#5,899 |
| 96. | Gaston | 56 | 60,774(0.09%)#96 | 10,767,104(0.00%)#6,024 |
| 97. | Gloverville | 53 | 60,774(0.09%)#97 | 10,767,104(0.00%)#6,158 |
| 98. | Ravenel | 52 | 60,774(0.09%)#98 | 10,767,104(0.00%)#6,213 |
| 99. | Sandy Springs | 52 | 60,774(0.09%)#99 | 10,767,104(0.00%)#6,228 |
| 100. | Clemson | 50 | 60,774(0.08%)#100 | 10,767,104(0.00%)#6,279 |
Common Questions
What are the Top 10 Cities with the Most Immigrants from Mexico in South Carolina?
Top 10 Cities with the Most Immigrants from Mexico in South Carolina are:
#1
3,366
#2
1,425
#3
1,258
#4
1,109
#5
992
#6
922
#7
873
#8
847
#9
775
#10
759
What city has the Most Immigrants from Mexico in South Carolina?
North Charleston has the Most Immigrants from Mexico in South Carolina with 3,366.
What is the Total Immigrants from Mexico in the State of South Carolina?
Total Immigrants from Mexico in South Carolina is 60,774.
What is the Total Immigrants from Mexico in the United States?
Total Immigrants from Mexico in the United States is 10,767,104.