Cities with the Most Immigrants from Mexico in Montana
RELATED REPORTS & OPTIONS
Mexico
Montana
Compare Cities
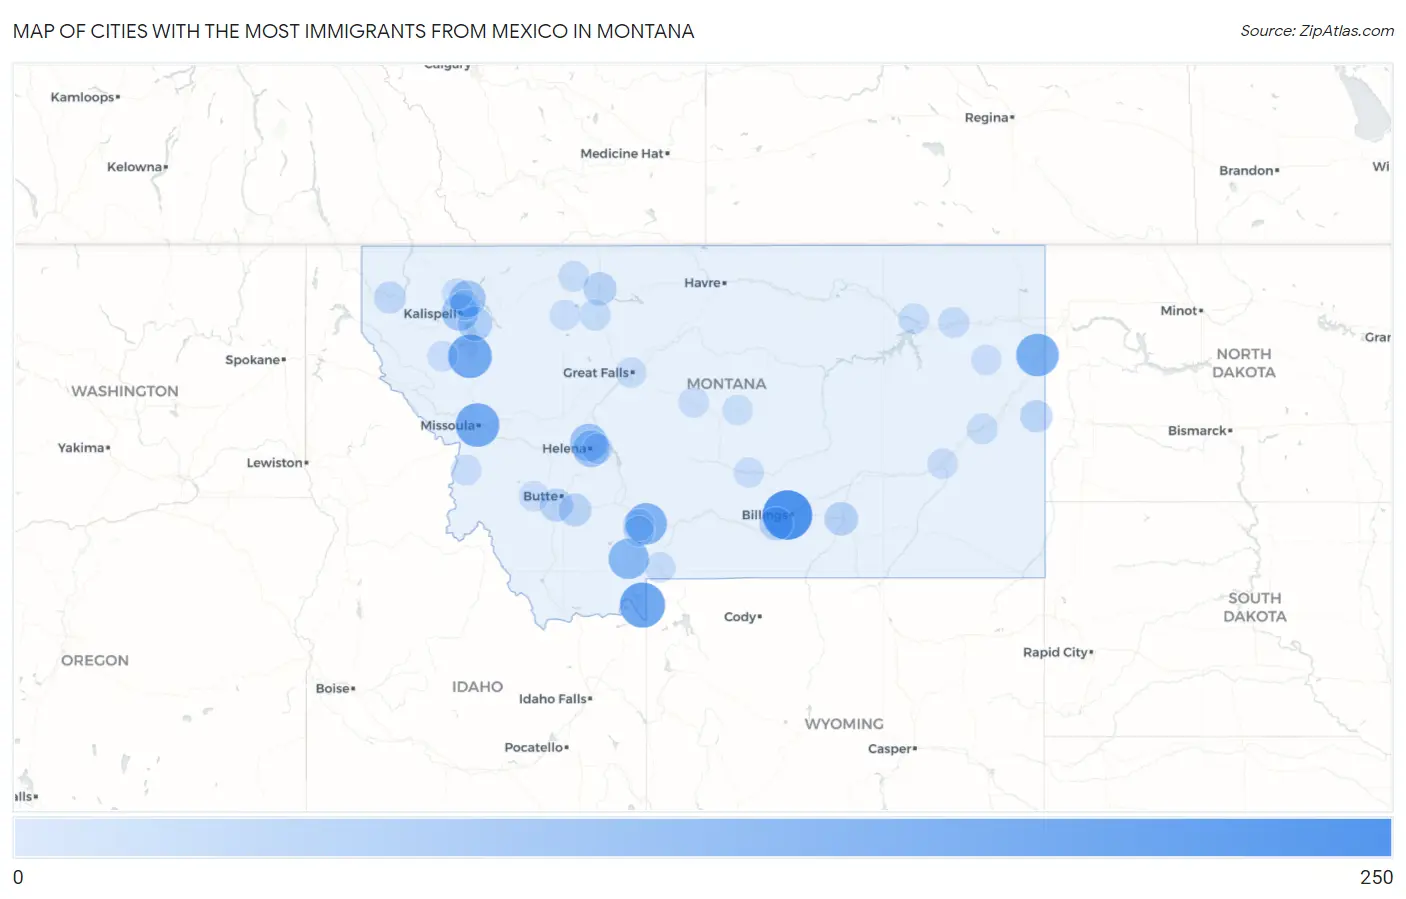
Map of Cities with the Most Immigrants from Mexico in Montana
0
250
Cities with the Most Immigrants from Mexico in Montana
| City | Mexico | vs State | vs National | |
| 1. | Billings | 230 | 2,608(8.82%)#1 | 10,767,104(0.00%)#3,089 |
| 2. | West Yellowstone | 177 | 2,608(6.79%)#2 | 10,767,104(0.00%)#3,599 |
| 3. | Missoula | 159 | 2,608(6.10%)#3 | 10,767,104(0.00%)#3,812 |
| 4. | Polson | 158 | 2,608(6.06%)#4 | 10,767,104(0.00%)#3,826 |
| 5. | Sidney | 146 | 2,608(5.60%)#5 | 10,767,104(0.00%)#3,992 |
| 6. | Bozeman | 131 | 2,608(5.02%)#6 | 10,767,104(0.00%)#4,184 |
| 7. | Big Sky | 119 | 2,608(4.56%)#7 | 10,767,104(0.00%)#4,398 |
| 8. | Helena Valley West Central | 85 | 2,608(3.26%)#8 | 10,767,104(0.00%)#5,086 |
| 9. | Helena | 76 | 2,608(2.91%)#9 | 10,767,104(0.00%)#5,308 |
| 10. | Kalispell | 73 | 2,608(2.80%)#10 | 10,767,104(0.00%)#5,394 |
| 11. | Columbia Falls | 72 | 2,608(2.76%)#11 | 10,767,104(0.00%)#5,435 |
| 12. | Bigfork | 49 | 2,608(1.88%)#12 | 10,767,104(0.00%)#6,340 |
| 13. | Laurel | 38 | 2,608(1.46%)#13 | 10,767,104(0.00%)#6,945 |
| 14. | Hardin | 38 | 2,608(1.46%)#14 | 10,767,104(0.00%)#6,954 |
| 15. | Butte Silver Bow Balance | 34 | 2,608(1.30%)#15 | 10,767,104(0.00%)#7,161 |
| 16. | Shelby | 34 | 2,608(1.30%)#16 | 10,767,104(0.00%)#7,185 |
| 17. | Rader Creek | 31 | 2,608(1.19%)#17 | 10,767,104(0.00%)#7,428 |
| 18. | Wibaux | 27 | 2,608(1.04%)#18 | 10,767,104(0.00%)#7,716 |
| 19. | Libby | 21 | 2,608(0.81%)#19 | 10,767,104(0.00%)#8,247 |
| 20. | Four Corners | 19 | 2,608(0.73%)#20 | 10,767,104(0.00%)#8,478 |
| 21. | St. Mary | 17 | 2,608(0.65%)#21 | 10,767,104(0.00%)#8,812 |
| 22. | Conrad | 10 | 2,608(0.38%)#22 | 10,767,104(0.00%)#9,806 |
| 23. | Pine Creek | 10 | 2,608(0.38%)#23 | 10,767,104(0.00%)#9,919 |
| 24. | Wolf Point | 9 | 2,608(0.35%)#24 | 10,767,104(0.00%)#10,003 |
| 25. | Whitefish | 7 | 2,608(0.27%)#25 | 10,767,104(0.00%)#10,400 |
| 26. | Fallon | 7 | 2,608(0.27%)#26 | 10,767,104(0.00%)#10,618 |
| 27. | Nashua | 7 | 2,608(0.27%)#27 | 10,767,104(0.00%)#10,622 |
| 28. | Corwin Springs | 7 | 2,608(0.27%)#28 | 10,767,104(0.00%)#10,642 |
| 29. | Cut Bank | 6 | 2,608(0.23%)#29 | 10,767,104(0.00%)#10,705 |
| 30. | Gallatin Gateway | 6 | 2,608(0.23%)#30 | 10,767,104(0.00%)#10,790 |
| 31. | Great Falls | 5 | 2,608(0.19%)#31 | 10,767,104(0.00%)#10,894 |
| 32. | Miles City | 5 | 2,608(0.19%)#32 | 10,767,104(0.00%)#10,916 |
| 33. | Pinesdale | 5 | 2,608(0.19%)#33 | 10,767,104(0.00%)#11,054 |
| 34. | Dupuyer | 5 | 2,608(0.19%)#34 | 10,767,104(0.00%)#11,185 |
| 35. | Anaconda Deer Lodge County | 4 | 2,608(0.15%)#35 | 10,767,104(0.00%)#11,204 |
| 36. | Lewistown | 4 | 2,608(0.15%)#36 | 10,767,104(0.00%)#11,214 |
| 37. | Richey | 4 | 2,608(0.15%)#37 | 10,767,104(0.00%)#11,448 |
| 38. | Stanford | 4 | 2,608(0.15%)#38 | 10,767,104(0.00%)#11,452 |
| 39. | Lonepine | 4 | 2,608(0.15%)#39 | 10,767,104(0.00%)#11,470 |
| 40. | East Helena | 2 | 2,608(0.08%)#40 | 10,767,104(0.00%)#11,885 |
| 41. | Ryegate | 2 | 2,608(0.08%)#41 | 10,767,104(0.00%)#12,111 |
| 42. | Helena Flats | 1 | 2,608(0.04%)#42 | 10,767,104(0.00%)#12,296 |
Common Questions
What are the Top 10 Cities with the Most Immigrants from Mexico in Montana?
Top 10 Cities with the Most Immigrants from Mexico in Montana are:
#1
230
#2
177
#3
159
#4
158
#5
146
#6
131
#7
119
#8
85
#9
76
#10
73
What city has the Most Immigrants from Mexico in Montana?
Billings has the Most Immigrants from Mexico in Montana with 230.
What is the Total Immigrants from Mexico in the State of Montana?
Total Immigrants from Mexico in Montana is 2,608.
What is the Total Immigrants from Mexico in the United States?
Total Immigrants from Mexico in the United States is 10,767,104.