Cities with the Most Immigrants from Mexico in Pennsylvania
RELATED REPORTS & OPTIONS
Mexico
Pennsylvania
Compare Cities
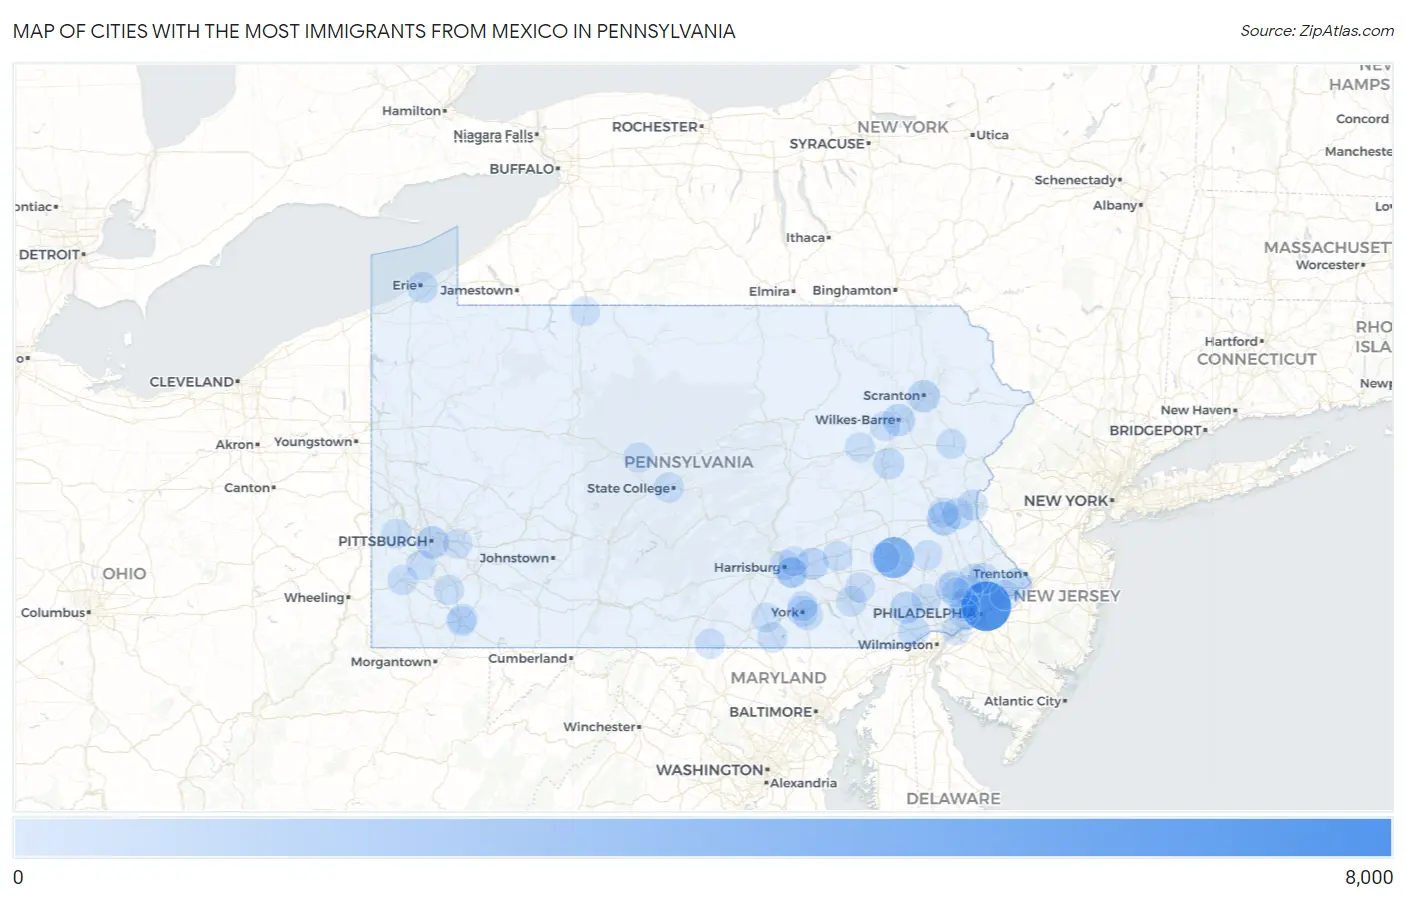
Map of Cities with the Most Immigrants from Mexico in Pennsylvania
0
8,000
Cities with the Most Immigrants from Mexico in Pennsylvania
| City | Mexico | vs State | vs National | |
| 1. | Philadelphia | 7,767 | 54,190(14.33%)#1 | 10,767,104(0.07%)#194 |
| 2. | Reading | 4,243 | 54,190(7.83%)#2 | 10,767,104(0.04%)#363 |
| 3. | Norristown Borough | 2,210 | 54,190(4.08%)#3 | 10,767,104(0.02%)#658 |
| 4. | Allentown | 1,408 | 54,190(2.60%)#4 | 10,767,104(0.01%)#917 |
| 5. | Kennett Square Borough | 1,214 | 54,190(2.24%)#5 | 10,767,104(0.01%)#1,020 |
| 6. | Pittsburgh | 1,029 | 54,190(1.90%)#6 | 10,767,104(0.01%)#1,140 |
| 7. | Scranton | 953 | 54,190(1.76%)#7 | 10,767,104(0.01%)#1,209 |
| 8. | Wilkes Barre | 888 | 54,190(1.64%)#8 | 10,767,104(0.01%)#1,277 |
| 9. | Hershey | 800 | 54,190(1.48%)#9 | 10,767,104(0.01%)#1,384 |
| 10. | Coatesville | 773 | 54,190(1.43%)#10 | 10,767,104(0.01%)#1,420 |
| 11. | Oxford Borough | 710 | 54,190(1.31%)#11 | 10,767,104(0.01%)#1,496 |
| 12. | Hazleton | 529 | 54,190(0.98%)#12 | 10,767,104(0.00%)#1,860 |
| 13. | Horsham | 502 | 54,190(0.93%)#13 | 10,767,104(0.00%)#1,923 |
| 14. | Levittown | 478 | 54,190(0.88%)#14 | 10,767,104(0.00%)#1,983 |
| 15. | Bethlehem | 447 | 54,190(0.82%)#15 | 10,767,104(0.00%)#2,068 |
| 16. | Toughkenamon | 433 | 54,190(0.80%)#16 | 10,767,104(0.00%)#2,111 |
| 17. | Hanover Borough | 408 | 54,190(0.75%)#17 | 10,767,104(0.00%)#2,190 |
| 18. | Easton | 383 | 54,190(0.71%)#18 | 10,767,104(0.00%)#2,289 |
| 19. | Quakertown Borough | 380 | 54,190(0.70%)#19 | 10,767,104(0.00%)#2,309 |
| 20. | Erie | 374 | 54,190(0.69%)#20 | 10,767,104(0.00%)#2,328 |
| 21. | Bressler | 358 | 54,190(0.66%)#21 | 10,767,104(0.00%)#2,385 |
| 22. | Chambersburg Borough | 351 | 54,190(0.65%)#22 | 10,767,104(0.00%)#2,416 |
| 23. | Avondale Borough | 346 | 54,190(0.64%)#23 | 10,767,104(0.00%)#2,450 |
| 24. | Pottstown Borough | 309 | 54,190(0.57%)#24 | 10,767,104(0.00%)#2,619 |
| 25. | York | 305 | 54,190(0.56%)#25 | 10,767,104(0.00%)#2,644 |
| 26. | West Grove Borough | 273 | 54,190(0.50%)#26 | 10,767,104(0.00%)#2,829 |
| 27. | Queens Gate | 263 | 54,190(0.49%)#27 | 10,767,104(0.00%)#2,894 |
| 28. | Collingdale Borough | 254 | 54,190(0.47%)#28 | 10,767,104(0.00%)#2,949 |
| 29. | Lancaster | 241 | 54,190(0.44%)#29 | 10,767,104(0.00%)#3,019 |
| 30. | West Chester Borough | 238 | 54,190(0.44%)#30 | 10,767,104(0.00%)#3,039 |
| 31. | York Springs Borough | 222 | 54,190(0.41%)#31 | 10,767,104(0.00%)#3,148 |
| 32. | Nottingham | 189 | 54,190(0.35%)#32 | 10,767,104(0.00%)#3,444 |
| 33. | Fullerton | 188 | 54,190(0.35%)#33 | 10,767,104(0.00%)#3,450 |
| 34. | Wayne | 182 | 54,190(0.34%)#34 | 10,767,104(0.00%)#3,529 |
| 35. | Gettysburg Borough | 175 | 54,190(0.32%)#35 | 10,767,104(0.00%)#3,617 |
| 36. | Tamaqua Borough | 167 | 54,190(0.31%)#36 | 10,767,104(0.00%)#3,712 |
| 37. | Parkesburg Borough | 152 | 54,190(0.28%)#37 | 10,767,104(0.00%)#3,904 |
| 38. | Chester | 143 | 54,190(0.26%)#38 | 10,767,104(0.00%)#4,028 |
| 39. | Park Forest Village | 142 | 54,190(0.26%)#39 | 10,767,104(0.00%)#4,048 |
| 40. | New Oxford Borough | 132 | 54,190(0.24%)#40 | 10,767,104(0.00%)#4,178 |
| 41. | Troy Borough | 124 | 54,190(0.23%)#41 | 10,767,104(0.00%)#4,313 |
| 42. | Berwick Borough | 123 | 54,190(0.23%)#42 | 10,767,104(0.00%)#4,321 |
| 43. | Valley View Cdp York County | 122 | 54,190(0.23%)#43 | 10,767,104(0.00%)#4,345 |
| 44. | Mont Clare | 118 | 54,190(0.22%)#44 | 10,767,104(0.00%)#4,414 |
| 45. | Gratz Borough | 116 | 54,190(0.21%)#45 | 10,767,104(0.00%)#4,449 |
| 46. | Kylertown | 116 | 54,190(0.21%)#46 | 10,767,104(0.00%)#4,451 |
| 47. | Lebanon | 113 | 54,190(0.21%)#47 | 10,767,104(0.00%)#4,490 |
| 48. | Eagleville Cdp Montgomery County | 112 | 54,190(0.21%)#48 | 10,767,104(0.00%)#4,517 |
| 49. | Bridgeport Borough | 112 | 54,190(0.21%)#49 | 10,767,104(0.00%)#4,518 |
| 50. | Lehighton Borough | 104 | 54,190(0.19%)#50 | 10,767,104(0.00%)#4,662 |
| 51. | Springmont | 103 | 54,190(0.19%)#51 | 10,767,104(0.00%)#4,686 |
| 52. | Emigsville | 101 | 54,190(0.19%)#52 | 10,767,104(0.00%)#4,725 |
| 53. | Waynesboro Borough | 98 | 54,190(0.18%)#53 | 10,767,104(0.00%)#4,780 |
| 54. | Clinton | 97 | 54,190(0.18%)#54 | 10,767,104(0.00%)#4,820 |
| 55. | Pennville | 93 | 54,190(0.17%)#55 | 10,767,104(0.00%)#4,893 |
| 56. | Spring House | 91 | 54,190(0.17%)#56 | 10,767,104(0.00%)#4,939 |
| 57. | Plymouth Meeting | 90 | 54,190(0.17%)#57 | 10,767,104(0.00%)#4,960 |
| 58. | Bendersville Borough | 89 | 54,190(0.16%)#58 | 10,767,104(0.00%)#4,997 |
| 59. | Ephrata Borough | 86 | 54,190(0.16%)#59 | 10,767,104(0.00%)#5,049 |
| 60. | Washington | 84 | 54,190(0.16%)#60 | 10,767,104(0.00%)#5,111 |
| 61. | Brownstown | 79 | 54,190(0.15%)#61 | 10,767,104(0.00%)#5,243 |
| 62. | Fairhope | 79 | 54,190(0.15%)#62 | 10,767,104(0.00%)#5,248 |
| 63. | Wilson Borough | 78 | 54,190(0.14%)#63 | 10,767,104(0.00%)#5,261 |
| 64. | Emerald Lakes | 77 | 54,190(0.14%)#64 | 10,767,104(0.00%)#5,296 |
| 65. | Lionville | 76 | 54,190(0.14%)#65 | 10,767,104(0.00%)#5,314 |
| 66. | Harrisburg | 74 | 54,190(0.14%)#66 | 10,767,104(0.00%)#5,361 |
| 67. | Laureldale Borough | 74 | 54,190(0.14%)#67 | 10,767,104(0.00%)#5,383 |
| 68. | Bryn Mawr | 71 | 54,190(0.13%)#68 | 10,767,104(0.00%)#5,463 |
| 69. | West Hazleton Borough | 71 | 54,190(0.13%)#69 | 10,767,104(0.00%)#5,464 |
| 70. | Mcmurray | 71 | 54,190(0.13%)#70 | 10,767,104(0.00%)#5,467 |
| 71. | Oliver | 71 | 54,190(0.13%)#71 | 10,767,104(0.00%)#5,474 |
| 72. | West Homestead Borough | 71 | 54,190(0.13%)#72 | 10,767,104(0.00%)#5,479 |
| 73. | Wyomissing Borough | 70 | 54,190(0.13%)#73 | 10,767,104(0.00%)#5,498 |
| 74. | Shenandoah Borough | 68 | 54,190(0.13%)#74 | 10,767,104(0.00%)#5,570 |
| 75. | Wayne Heights | 66 | 54,190(0.12%)#75 | 10,767,104(0.00%)#5,637 |
| 76. | Bentleyville Borough | 66 | 54,190(0.12%)#76 | 10,767,104(0.00%)#5,640 |
| 77. | Ardmore | 65 | 54,190(0.12%)#77 | 10,767,104(0.00%)#5,662 |
| 78. | New Berlinville | 64 | 54,190(0.12%)#78 | 10,767,104(0.00%)#5,722 |
| 79. | Enhaut | 64 | 54,190(0.12%)#79 | 10,767,104(0.00%)#5,724 |
| 80. | Hellertown Borough | 63 | 54,190(0.12%)#80 | 10,767,104(0.00%)#5,742 |
| 81. | Manchester Borough | 63 | 54,190(0.12%)#81 | 10,767,104(0.00%)#5,751 |
| 82. | East Berwick | 59 | 54,190(0.11%)#82 | 10,767,104(0.00%)#5,898 |
| 83. | Audubon | 58 | 54,190(0.11%)#83 | 10,767,104(0.00%)#5,932 |
| 84. | Drexel Hill | 57 | 54,190(0.11%)#84 | 10,767,104(0.00%)#5,954 |
| 85. | Colonial Park | 57 | 54,190(0.11%)#85 | 10,767,104(0.00%)#5,957 |
| 86. | Bristol Borough | 56 | 54,190(0.10%)#86 | 10,767,104(0.00%)#6,001 |
| 87. | Hatboro Borough | 56 | 54,190(0.10%)#87 | 10,767,104(0.00%)#6,004 |
| 88. | Monaca Borough | 56 | 54,190(0.10%)#88 | 10,767,104(0.00%)#6,012 |
| 89. | Trooper | 55 | 54,190(0.10%)#89 | 10,767,104(0.00%)#6,048 |
| 90. | Dunmore Borough | 54 | 54,190(0.10%)#90 | 10,767,104(0.00%)#6,088 |
| 91. | Uniontown | 53 | 54,190(0.10%)#91 | 10,767,104(0.00%)#6,137 |
| 92. | Lewistown Borough | 53 | 54,190(0.10%)#92 | 10,767,104(0.00%)#6,138 |
| 93. | King Of Prussia | 52 | 54,190(0.10%)#93 | 10,767,104(0.00%)#6,188 |
| 94. | Bradford | 52 | 54,190(0.10%)#94 | 10,767,104(0.00%)#6,198 |
| 95. | Downingtown Borough | 51 | 54,190(0.09%)#95 | 10,767,104(0.00%)#6,252 |
| 96. | Hampton | 50 | 54,190(0.09%)#96 | 10,767,104(0.00%)#6,309 |
| 97. | Monroeville | 49 | 54,190(0.09%)#97 | 10,767,104(0.00%)#6,322 |
| 98. | Nanticoke | 49 | 54,190(0.09%)#98 | 10,767,104(0.00%)#6,329 |
| 99. | Plymouth Borough | 49 | 54,190(0.09%)#99 | 10,767,104(0.00%)#6,339 |
| 100. | Cornwells Heights | 49 | 54,190(0.09%)#100 | 10,767,104(0.00%)#6,356 |
Common Questions
What are the Top 10 Cities with the Most Immigrants from Mexico in Pennsylvania?
Top 10 Cities with the Most Immigrants from Mexico in Pennsylvania are:
#1
7,767
#2
4,243
#3
1,408
#4
1,029
#5
953
#6
888
#7
800
#8
773
#9
529
#10
502
What city has the Most Immigrants from Mexico in Pennsylvania?
Philadelphia has the Most Immigrants from Mexico in Pennsylvania with 7,767.
What is the Total Immigrants from Mexico in the State of Pennsylvania?
Total Immigrants from Mexico in Pennsylvania is 54,190.
What is the Total Immigrants from Mexico in the United States?
Total Immigrants from Mexico in the United States is 10,767,104.