Cities with the Most Immigrants from Mexico in Florida
RELATED REPORTS & OPTIONS
Mexico
Florida
Compare Cities
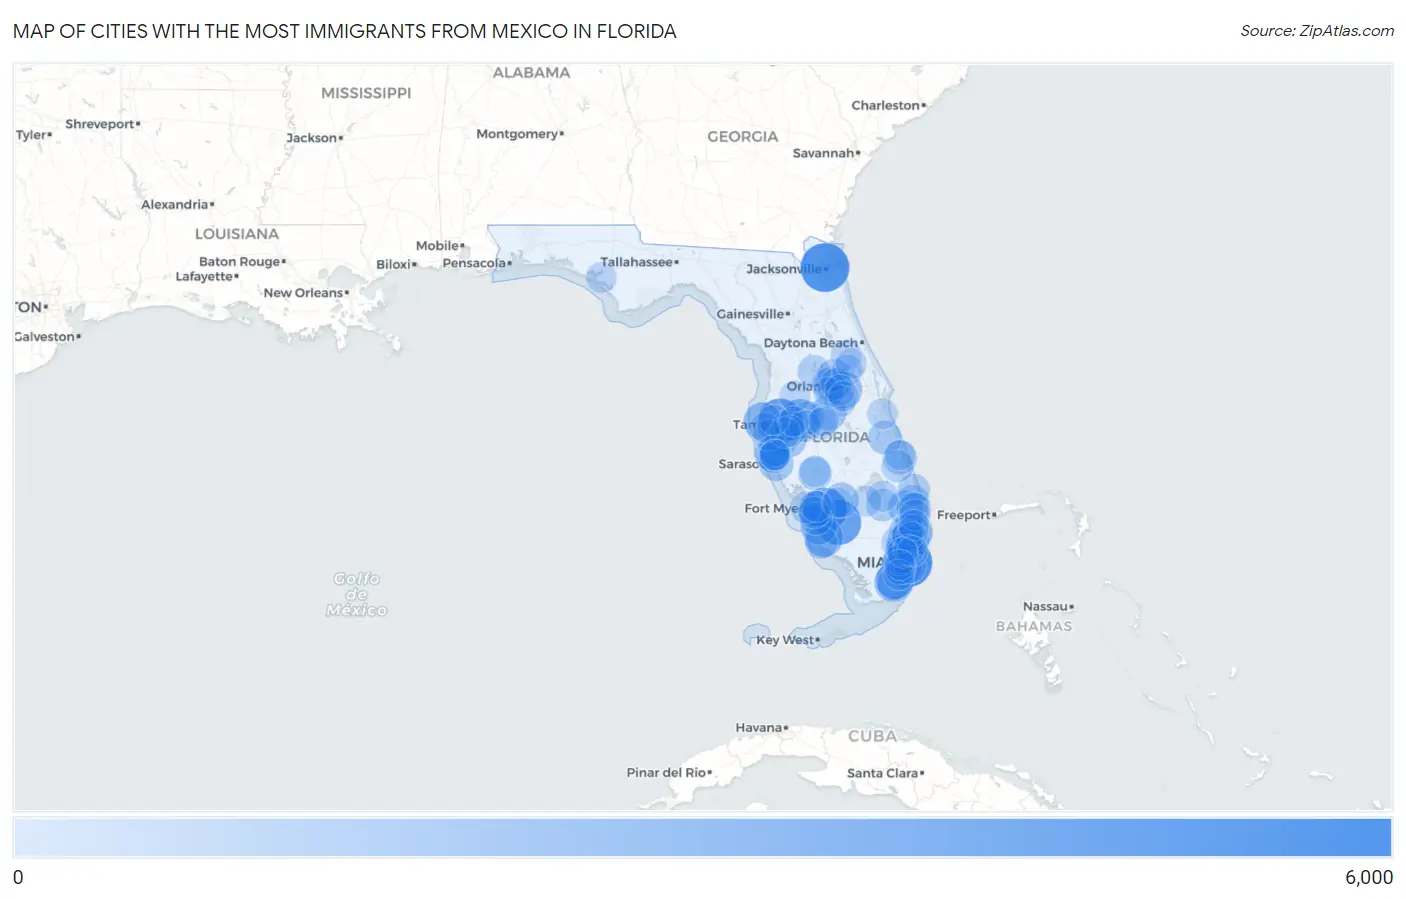
Map of Cities with the Most Immigrants from Mexico in Florida
0
6,000
Cities with the Most Immigrants from Mexico in Florida
| City | Mexico | vs State | vs National | |
| 1. | Miami | 5,494 | 257,152(2.14%)#1 | 10,767,104(0.05%)#271 |
| 2. | Jacksonville | 5,283 | 257,152(2.05%)#2 | 10,767,104(0.05%)#285 |
| 3. | Tampa | 4,397 | 257,152(1.71%)#3 | 10,767,104(0.04%)#349 |
| 4. | Immokalee | 4,323 | 257,152(1.68%)#4 | 10,767,104(0.04%)#357 |
| 5. | Lehigh Acres | 4,152 | 257,152(1.61%)#5 | 10,767,104(0.04%)#372 |
| 6. | Pompano Beach | 3,029 | 257,152(1.18%)#6 | 10,767,104(0.03%)#503 |
| 7. | University Cdp Hillsborough County | 2,925 | 257,152(1.14%)#7 | 10,767,104(0.03%)#519 |
| 8. | Plant City | 2,897 | 257,152(1.13%)#8 | 10,767,104(0.03%)#521 |
| 9. | Golden Gate | 2,669 | 257,152(1.04%)#9 | 10,767,104(0.02%)#552 |
| 10. | Homestead | 2,664 | 257,152(1.04%)#10 | 10,767,104(0.02%)#554 |
| 11. | Leisure City | 2,572 | 257,152(1.00%)#11 | 10,767,104(0.02%)#578 |
| 12. | Clearwater | 2,464 | 257,152(0.96%)#12 | 10,767,104(0.02%)#602 |
| 13. | Davie | 2,282 | 257,152(0.89%)#13 | 10,767,104(0.02%)#642 |
| 14. | Orlando | 2,225 | 257,152(0.87%)#14 | 10,767,104(0.02%)#654 |
| 15. | Bonita Springs | 2,133 | 257,152(0.83%)#15 | 10,767,104(0.02%)#677 |
| 16. | Fort Lauderdale | 2,050 | 257,152(0.80%)#16 | 10,767,104(0.02%)#699 |
| 17. | Bradenton | 2,002 | 257,152(0.78%)#17 | 10,767,104(0.02%)#708 |
| 18. | Haines City | 1,974 | 257,152(0.77%)#18 | 10,767,104(0.02%)#718 |
| 19. | Fort Myers | 1,963 | 257,152(0.76%)#19 | 10,767,104(0.02%)#722 |
| 20. | Port Labelle | 1,724 | 257,152(0.67%)#20 | 10,767,104(0.02%)#798 |
| 21. | Wimauma | 1,700 | 257,152(0.66%)#21 | 10,767,104(0.02%)#810 |
| 22. | Sarasota | 1,608 | 257,152(0.63%)#22 | 10,767,104(0.01%)#841 |
| 23. | Ocoee | 1,555 | 257,152(0.60%)#23 | 10,767,104(0.01%)#853 |
| 24. | Wellington | 1,534 | 257,152(0.60%)#24 | 10,767,104(0.01%)#861 |
| 25. | Fort Pierce | 1,479 | 257,152(0.58%)#25 | 10,767,104(0.01%)#884 |
| 26. | Fellsmere | 1,424 | 257,152(0.55%)#26 | 10,767,104(0.01%)#913 |
| 27. | Coral Springs | 1,400 | 257,152(0.54%)#27 | 10,767,104(0.01%)#923 |
| 28. | Ruskin | 1,336 | 257,152(0.52%)#28 | 10,767,104(0.01%)#954 |
| 29. | Southeast Arcadia | 1,310 | 257,152(0.51%)#29 | 10,767,104(0.01%)#961 |
| 30. | Winter Garden | 1,277 | 257,152(0.50%)#30 | 10,767,104(0.01%)#979 |
| 31. | West Palm Beach | 1,266 | 257,152(0.49%)#31 | 10,767,104(0.01%)#985 |
| 32. | Florida City | 1,220 | 257,152(0.47%)#32 | 10,767,104(0.01%)#1,012 |
| 33. | Belle Glade | 1,188 | 257,152(0.46%)#33 | 10,767,104(0.01%)#1,039 |
| 34. | Leesburg | 1,138 | 257,152(0.44%)#34 | 10,767,104(0.01%)#1,061 |
| 35. | Greenacres | 1,133 | 257,152(0.44%)#35 | 10,767,104(0.01%)#1,063 |
| 36. | Lakeland | 1,120 | 257,152(0.44%)#36 | 10,767,104(0.01%)#1,072 |
| 37. | Naples Manor | 1,120 | 257,152(0.44%)#37 | 10,767,104(0.01%)#1,073 |
| 38. | Apopka | 1,118 | 257,152(0.43%)#38 | 10,767,104(0.01%)#1,074 |
| 39. | Jupiter | 1,110 | 257,152(0.43%)#39 | 10,767,104(0.01%)#1,082 |
| 40. | San Carlos Park | 1,078 | 257,152(0.42%)#40 | 10,767,104(0.01%)#1,105 |
| 41. | Weston | 1,047 | 257,152(0.41%)#41 | 10,767,104(0.01%)#1,127 |
| 42. | Palm Springs | 1,041 | 257,152(0.40%)#42 | 10,767,104(0.01%)#1,131 |
| 43. | Port St Lucie | 1,005 | 257,152(0.39%)#43 | 10,767,104(0.01%)#1,157 |
| 44. | Hollywood | 984 | 257,152(0.38%)#44 | 10,767,104(0.01%)#1,183 |
| 45. | Cape Coral | 978 | 257,152(0.38%)#45 | 10,767,104(0.01%)#1,188 |
| 46. | South Bradenton | 943 | 257,152(0.37%)#46 | 10,767,104(0.01%)#1,221 |
| 47. | Palmetto | 943 | 257,152(0.37%)#47 | 10,767,104(0.01%)#1,222 |
| 48. | Lake Worth Beach | 925 | 257,152(0.36%)#48 | 10,767,104(0.01%)#1,237 |
| 49. | Brandon | 924 | 257,152(0.36%)#49 | 10,767,104(0.01%)#1,239 |
| 50. | Pine Manor | 923 | 257,152(0.36%)#50 | 10,767,104(0.01%)#1,241 |
| 51. | Willow Oak | 917 | 257,152(0.36%)#51 | 10,767,104(0.01%)#1,249 |
| 52. | Pine Hills | 912 | 257,152(0.35%)#52 | 10,767,104(0.01%)#1,258 |
| 53. | Memphis | 897 | 257,152(0.35%)#53 | 10,767,104(0.01%)#1,266 |
| 54. | Bayshore Gardens | 877 | 257,152(0.34%)#54 | 10,767,104(0.01%)#1,290 |
| 55. | Riverview | 876 | 257,152(0.34%)#55 | 10,767,104(0.01%)#1,291 |
| 56. | Pembroke Pines | 863 | 257,152(0.34%)#56 | 10,767,104(0.01%)#1,305 |
| 57. | Kissimmee | 861 | 257,152(0.33%)#57 | 10,767,104(0.01%)#1,307 |
| 58. | St Petersburg | 855 | 257,152(0.33%)#58 | 10,767,104(0.01%)#1,310 |
| 59. | Coral Gables | 850 | 257,152(0.33%)#59 | 10,767,104(0.01%)#1,319 |
| 60. | Wahneta | 839 | 257,152(0.33%)#60 | 10,767,104(0.01%)#1,328 |
| 61. | Key Biscayne | 831 | 257,152(0.32%)#61 | 10,767,104(0.01%)#1,340 |
| 62. | Arcadia | 824 | 257,152(0.32%)#62 | 10,767,104(0.01%)#1,347 |
| 63. | Hialeah | 784 | 257,152(0.30%)#63 | 10,767,104(0.01%)#1,402 |
| 64. | Tice | 777 | 257,152(0.30%)#64 | 10,767,104(0.01%)#1,411 |
| 65. | Tamarac | 776 | 257,152(0.30%)#65 | 10,767,104(0.01%)#1,412 |
| 66. | Dade City North | 774 | 257,152(0.30%)#66 | 10,767,104(0.01%)#1,417 |
| 67. | Pahokee | 767 | 257,152(0.30%)#67 | 10,767,104(0.01%)#1,432 |
| 68. | North Lauderdale | 762 | 257,152(0.30%)#68 | 10,767,104(0.01%)#1,437 |
| 69. | Kendall | 759 | 257,152(0.30%)#69 | 10,767,104(0.01%)#1,445 |
| 70. | Deland | 759 | 257,152(0.30%)#70 | 10,767,104(0.01%)#1,446 |
| 71. | Boynton Beach | 752 | 257,152(0.29%)#71 | 10,767,104(0.01%)#1,456 |
| 72. | Sanford | 751 | 257,152(0.29%)#72 | 10,767,104(0.01%)#1,458 |
| 73. | Deltona | 731 | 257,152(0.28%)#73 | 10,767,104(0.01%)#1,474 |
| 74. | Ocala Estates | 715 | 257,152(0.28%)#74 | 10,767,104(0.01%)#1,488 |
| 75. | Doral | 698 | 257,152(0.27%)#75 | 10,767,104(0.01%)#1,525 |
| 76. | Panama City | 695 | 257,152(0.27%)#76 | 10,767,104(0.01%)#1,532 |
| 77. | Melbourne | 686 | 257,152(0.27%)#77 | 10,767,104(0.01%)#1,547 |
| 78. | West Samoset | 685 | 257,152(0.27%)#78 | 10,767,104(0.01%)#1,551 |
| 79. | Miramar | 676 | 257,152(0.26%)#79 | 10,767,104(0.01%)#1,565 |
| 80. | Gibsonton | 652 | 257,152(0.25%)#80 | 10,767,104(0.01%)#1,604 |
| 81. | Clewiston | 647 | 257,152(0.25%)#81 | 10,767,104(0.01%)#1,616 |
| 82. | Horizon West | 641 | 257,152(0.25%)#82 | 10,767,104(0.01%)#1,626 |
| 83. | Deerfield Beach | 637 | 257,152(0.25%)#83 | 10,767,104(0.01%)#1,634 |
| 84. | Oak Ridge | 637 | 257,152(0.25%)#84 | 10,767,104(0.01%)#1,636 |
| 85. | Oakland Park | 625 | 257,152(0.24%)#85 | 10,767,104(0.01%)#1,658 |
| 86. | Labelle | 615 | 257,152(0.24%)#86 | 10,767,104(0.01%)#1,676 |
| 87. | West Park | 606 | 257,152(0.24%)#87 | 10,767,104(0.01%)#1,693 |
| 88. | Boca Raton | 595 | 257,152(0.23%)#88 | 10,767,104(0.01%)#1,709 |
| 89. | Aventura | 595 | 257,152(0.23%)#89 | 10,767,104(0.01%)#1,710 |
| 90. | South Highpoint | 594 | 257,152(0.23%)#90 | 10,767,104(0.01%)#1,717 |
| 91. | Samoset | 591 | 257,152(0.23%)#91 | 10,767,104(0.01%)#1,723 |
| 92. | Town N Country | 589 | 257,152(0.23%)#92 | 10,767,104(0.01%)#1,725 |
| 93. | Fort Pierce North | 582 | 257,152(0.23%)#93 | 10,767,104(0.01%)#1,739 |
| 94. | Vero Lake Estates | 568 | 257,152(0.22%)#94 | 10,767,104(0.01%)#1,762 |
| 95. | South Miami Heights | 560 | 257,152(0.22%)#95 | 10,767,104(0.01%)#1,778 |
| 96. | Meadow Woods | 554 | 257,152(0.22%)#96 | 10,767,104(0.01%)#1,787 |
| 97. | Winter Haven | 542 | 257,152(0.21%)#97 | 10,767,104(0.01%)#1,817 |
| 98. | Dover | 538 | 257,152(0.21%)#98 | 10,767,104(0.00%)#1,836 |
| 99. | Country Club | 536 | 257,152(0.21%)#99 | 10,767,104(0.00%)#1,847 |
| 100. | Westchester | 532 | 257,152(0.21%)#100 | 10,767,104(0.00%)#1,851 |
Common Questions
What are the Top 10 Cities with the Most Immigrants from Mexico in Florida?
Top 10 Cities with the Most Immigrants from Mexico in Florida are:
#1
5,494
#2
5,283
#3
4,397
#4
4,323
#5
4,152
#6
3,029
#7
2,897
#8
2,669
#9
2,664
#10
2,572
What city has the Most Immigrants from Mexico in Florida?
Miami has the Most Immigrants from Mexico in Florida with 5,494.
What is the Total Immigrants from Mexico in the State of Florida?
Total Immigrants from Mexico in Florida is 257,152.
What is the Total Immigrants from Mexico in the United States?
Total Immigrants from Mexico in the United States is 10,767,104.