Cities with the Highest Percentage of Immigrants from Western Europe in Texas
RELATED REPORTS & OPTIONS
Western Europe
Texas
Compare Cities
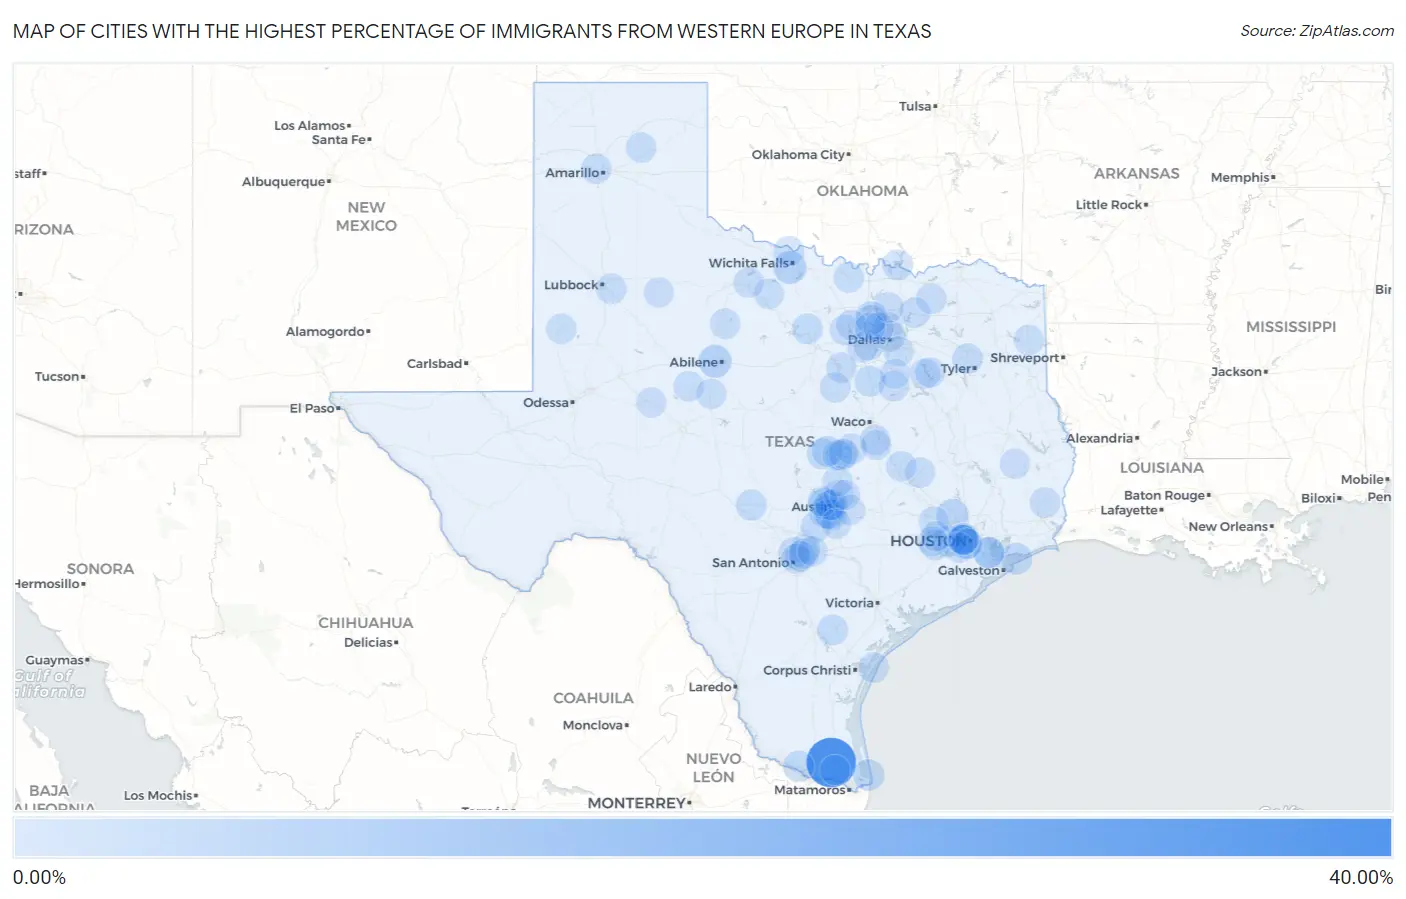
Map of Cities with the Highest Percentage of Immigrants from Western Europe in Texas
0.00%
40.00%
Cities with the Highest Percentage of Immigrants from Western Europe in Texas
| City | Western Europe | vs State | vs National | |
| 1. | Yznaga | 31.82% | 0.21%(+31.6)#1 | 0.28%(+31.5)#7 |
| 2. | Tye | 4.77% | 0.21%(+4.56)#2 | 0.28%(+4.49)#136 |
| 3. | Lakeside City | 4.58% | 0.21%(+4.37)#3 | 0.28%(+4.30)#145 |
| 4. | Stagecoach | 3.79% | 0.21%(+3.58)#4 | 0.28%(+3.51)#178 |
| 5. | Lantana | 3.19% | 0.21%(+2.98)#5 | 0.28%(+2.91)#230 |
| 6. | Hilshire Village | 3.00% | 0.21%(+2.79)#6 | 0.28%(+2.72)#258 |
| 7. | Bolivar Peninsula | 2.78% | 0.21%(+2.57)#7 | 0.28%(+2.50)#292 |
| 8. | Rockwell Place | 2.61% | 0.21%(+2.40)#8 | 0.28%(+2.33)#330 |
| 9. | South Padre Island | 2.47% | 0.21%(+2.26)#9 | 0.28%(+2.19)#357 |
| 10. | Bear Creek | 2.27% | 0.21%(+2.06)#10 | 0.28%(+1.99)#414 |
| 11. | Cinco Ranch | 2.20% | 0.21%(+1.99)#11 | 0.28%(+1.92)#441 |
| 12. | Kempner | 2.08% | 0.21%(+1.87)#12 | 0.28%(+1.80)#481 |
| 13. | Itasca | 1.98% | 0.21%(+1.77)#13 | 0.28%(+1.70)#527 |
| 14. | Perezville | 1.92% | 0.21%(+1.71)#14 | 0.28%(+1.64)#546 |
| 15. | El Lago | 1.91% | 0.21%(+1.70)#15 | 0.28%(+1.63)#556 |
| 16. | Blue Berry Hill | 1.84% | 0.21%(+1.63)#16 | 0.28%(+1.56)#581 |
| 17. | Barton Creek | 1.82% | 0.21%(+1.62)#17 | 0.28%(+1.55)#598 |
| 18. | Harker Heights | 1.70% | 0.21%(+1.50)#18 | 0.28%(+1.42)#652 |
| 19. | Wimberley | 1.57% | 0.21%(+1.37)#19 | 0.28%(+1.30)#746 |
| 20. | Harper | 1.57% | 0.21%(+1.36)#20 | 0.28%(+1.29)#750 |
| 21. | Copperas Cove | 1.55% | 0.21%(+1.34)#21 | 0.28%(+1.27)#760 |
| 22. | Preston | 1.51% | 0.21%(+1.30)#22 | 0.28%(+1.23)#788 |
| 23. | Taylor Lake Village | 1.50% | 0.21%(+1.29)#23 | 0.28%(+1.22)#799 |
| 24. | San Leanna | 1.42% | 0.21%(+1.21)#24 | 0.28%(+1.14)#856 |
| 25. | Lindale | 1.39% | 0.21%(+1.18)#25 | 0.28%(+1.11)#878 |
| 26. | Bee Cave | 1.37% | 0.21%(+1.16)#26 | 0.28%(+1.09)#906 |
| 27. | Southside Place | 1.37% | 0.21%(+1.16)#27 | 0.28%(+1.09)#907 |
| 28. | Graford | 1.36% | 0.21%(+1.15)#28 | 0.28%(+1.08)#916 |
| 29. | Morgan S Point Resort | 1.31% | 0.21%(+1.10)#29 | 0.28%(+1.03)#967 |
| 30. | Farmersville | 1.29% | 0.21%(+1.09)#30 | 0.28%(+1.02)#987 |
| 31. | Hill Country Village | 1.25% | 0.21%(+1.04)#31 | 0.28%(+0.968)#1,038 |
| 32. | Evadale | 1.25% | 0.21%(+1.04)#32 | 0.28%(+0.966)#1,039 |
| 33. | Addison | 1.24% | 0.21%(+1.03)#33 | 0.28%(+0.960)#1,045 |
| 34. | Highland Park | 1.23% | 0.21%(+1.02)#34 | 0.28%(+0.954)#1,053 |
| 35. | Ransom Canyon | 1.21% | 0.21%(+1.00)#35 | 0.28%(+0.932)#1,074 |
| 36. | Burkburnett | 1.19% | 0.21%(+0.984)#36 | 0.28%(+0.914)#1,102 |
| 37. | Sanctuary | 1.18% | 0.21%(+0.972)#37 | 0.28%(+0.902)#1,124 |
| 38. | West Lake Hills | 1.16% | 0.21%(+0.952)#38 | 0.28%(+0.881)#1,161 |
| 39. | Belterra | 1.15% | 0.21%(+0.944)#39 | 0.28%(+0.874)#1,173 |
| 40. | Shady Hollow | 1.13% | 0.21%(+0.923)#40 | 0.28%(+0.853)#1,193 |
| 41. | Stamford | 1.11% | 0.21%(+0.902)#41 | 0.28%(+0.832)#1,220 |
| 42. | Dalworthington Gardens | 1.11% | 0.21%(+0.899)#42 | 0.28%(+0.829)#1,229 |
| 43. | Rosanky | 1.08% | 0.21%(+0.867)#43 | 0.28%(+0.797)#1,278 |
| 44. | Kurten | 1.04% | 0.21%(+0.836)#44 | 0.28%(+0.766)#1,338 |
| 45. | Port Aransas | 1.04% | 0.21%(+0.833)#45 | 0.28%(+0.762)#1,347 |
| 46. | Blackwell | 1.01% | 0.21%(+0.796)#46 | 0.28%(+0.726)#1,422 |
| 47. | Skellytown | 0.99% | 0.21%(+0.783)#47 | 0.28%(+0.713)#1,442 |
| 48. | Wolfe City | 0.98% | 0.21%(+0.775)#48 | 0.28%(+0.705)#1,463 |
| 49. | Garden Ridge | 0.96% | 0.21%(+0.754)#49 | 0.28%(+0.683)#1,501 |
| 50. | Simonton | 0.93% | 0.21%(+0.725)#50 | 0.28%(+0.655)#1,565 |
| 51. | Megargel | 0.93% | 0.21%(+0.725)#51 | 0.28%(+0.655)#1,566 |
| 52. | Hearne | 0.93% | 0.21%(+0.719)#52 | 0.28%(+0.649)#1,578 |
| 53. | Windcrest | 0.93% | 0.21%(+0.718)#53 | 0.28%(+0.648)#1,581 |
| 54. | Spring Valley Village | 0.92% | 0.21%(+0.715)#54 | 0.28%(+0.644)#1,591 |
| 55. | Double Oak | 0.92% | 0.21%(+0.712)#55 | 0.28%(+0.642)#1,599 |
| 56. | Blooming Grove | 0.92% | 0.21%(+0.707)#56 | 0.28%(+0.637)#1,613 |
| 57. | Forest Hill | 0.91% | 0.21%(+0.703)#57 | 0.28%(+0.633)#1,621 |
| 58. | Pecan Plantation | 0.89% | 0.21%(+0.676)#58 | 0.28%(+0.606)#1,697 |
| 59. | St Jo | 0.88% | 0.21%(+0.676)#59 | 0.28%(+0.606)#1,698 |
| 60. | Seis Lagos | 0.88% | 0.21%(+0.675)#60 | 0.28%(+0.605)#1,706 |
| 61. | Walnut Springs | 0.88% | 0.21%(+0.674)#61 | 0.28%(+0.603)#1,709 |
| 62. | Seymour | 0.86% | 0.21%(+0.652)#62 | 0.28%(+0.582)#1,769 |
| 63. | Tool | 0.85% | 0.21%(+0.640)#63 | 0.28%(+0.570)#1,789 |
| 64. | Killeen | 0.85% | 0.21%(+0.639)#64 | 0.28%(+0.568)#1,791 |
| 65. | Bishop Hills | 0.83% | 0.21%(+0.617)#65 | 0.28%(+0.547)#1,844 |
| 66. | Chilton | 0.82% | 0.21%(+0.613)#66 | 0.28%(+0.543)#1,857 |
| 67. | Seagraves | 0.79% | 0.21%(+0.585)#67 | 0.28%(+0.514)#1,948 |
| 68. | Pecan Acres | 0.78% | 0.21%(+0.570)#68 | 0.28%(+0.499)#1,992 |
| 69. | Lost Creek | 0.78% | 0.21%(+0.567)#69 | 0.28%(+0.497)#2,002 |
| 70. | Coppell | 0.78% | 0.21%(+0.567)#70 | 0.28%(+0.497)#2,003 |
| 71. | Hedwig Village | 0.78% | 0.21%(+0.567)#71 | 0.28%(+0.497)#2,005 |
| 72. | Terrell Hills | 0.77% | 0.21%(+0.564)#72 | 0.28%(+0.494)#2,011 |
| 73. | Piney Point Village | 0.77% | 0.21%(+0.562)#73 | 0.28%(+0.491)#2,019 |
| 74. | Chester | 0.76% | 0.21%(+0.554)#74 | 0.28%(+0.484)#2,045 |
| 75. | Meadows Place | 0.72% | 0.21%(+0.511)#75 | 0.28%(+0.441)#2,201 |
| 76. | Pine Island | 0.72% | 0.21%(+0.506)#76 | 0.28%(+0.436)#2,220 |
| 77. | Brazos Country | 0.69% | 0.21%(+0.479)#77 | 0.28%(+0.409)#2,298 |
| 78. | Wells Branch | 0.68% | 0.21%(+0.472)#78 | 0.28%(+0.402)#2,329 |
| 79. | The Hills | 0.68% | 0.21%(+0.470)#79 | 0.28%(+0.399)#2,341 |
| 80. | Jefferson | 0.67% | 0.21%(+0.465)#80 | 0.28%(+0.395)#2,360 |
| 81. | Winters | 0.67% | 0.21%(+0.461)#81 | 0.28%(+0.391)#2,375 |
| 82. | Georgetown | 0.67% | 0.21%(+0.458)#82 | 0.28%(+0.388)#2,394 |
| 83. | Prosper | 0.65% | 0.21%(+0.445)#83 | 0.28%(+0.375)#2,451 |
| 84. | Payne Springs | 0.65% | 0.21%(+0.443)#84 | 0.28%(+0.373)#2,457 |
| 85. | Wilmer | 0.65% | 0.21%(+0.443)#85 | 0.28%(+0.372)#2,462 |
| 86. | Spur | 0.64% | 0.21%(+0.434)#86 | 0.28%(+0.363)#2,513 |
| 87. | Palm Valley | 0.64% | 0.21%(+0.431)#87 | 0.28%(+0.360)#2,529 |
| 88. | Lott | 0.63% | 0.21%(+0.426)#88 | 0.28%(+0.356)#2,555 |
| 89. | Sterling City | 0.62% | 0.21%(+0.408)#89 | 0.28%(+0.337)#2,651 |
| 90. | Pattison | 0.61% | 0.21%(+0.403)#90 | 0.28%(+0.332)#2,687 |
| 91. | Nolanville | 0.61% | 0.21%(+0.397)#91 | 0.28%(+0.327)#2,718 |
| 92. | Universal City | 0.61% | 0.21%(+0.397)#92 | 0.28%(+0.327)#2,723 |
| 93. | Southlake | 0.60% | 0.21%(+0.395)#93 | 0.28%(+0.325)#2,733 |
| 94. | Webberville | 0.60% | 0.21%(+0.395)#94 | 0.28%(+0.324)#2,741 |
| 95. | Bardwell | 0.60% | 0.21%(+0.390)#95 | 0.28%(+0.320)#2,758 |
| 96. | West University Place | 0.59% | 0.21%(+0.379)#96 | 0.28%(+0.309)#2,805 |
| 97. | Santa Clara | 0.56% | 0.21%(+0.352)#97 | 0.28%(+0.282)#2,947 |
| 98. | Niederwald | 0.55% | 0.21%(+0.340)#98 | 0.28%(+0.270)#3,009 |
| 99. | Pflugerville | 0.55% | 0.21%(+0.339)#99 | 0.28%(+0.269)#3,011 |
| 100. | Hunters Creek Village | 0.55% | 0.21%(+0.338)#100 | 0.28%(+0.268)#3,018 |
Common Questions
What are the Top 10 Cities with the Highest Percentage of Immigrants from Western Europe in Texas?
Top 10 Cities with the Highest Percentage of Immigrants from Western Europe in Texas are:
#1
31.82%
#2
4.77%
#3
4.58%
#4
3.79%
#5
3.19%
#6
3.00%
#7
2.78%
#8
2.47%
#9
2.27%
#10
2.20%
What city has the Highest Percentage of Immigrants from Western Europe in Texas?
Yznaga has the Highest Percentage of Immigrants from Western Europe in Texas with 31.82%.
What is the Percentage of Immigrants from Western Europe in the State of Texas?
Percentage of Immigrants from Western Europe in Texas is 0.21%.
What is the Percentage of Immigrants from Western Europe in the United States?
Percentage of Immigrants from Western Europe in the United States is 0.28%.