Cities with the Highest Percentage of Immigrants from Western Europe in Tennessee
RELATED REPORTS & OPTIONS
Western Europe
Tennessee
Compare Cities
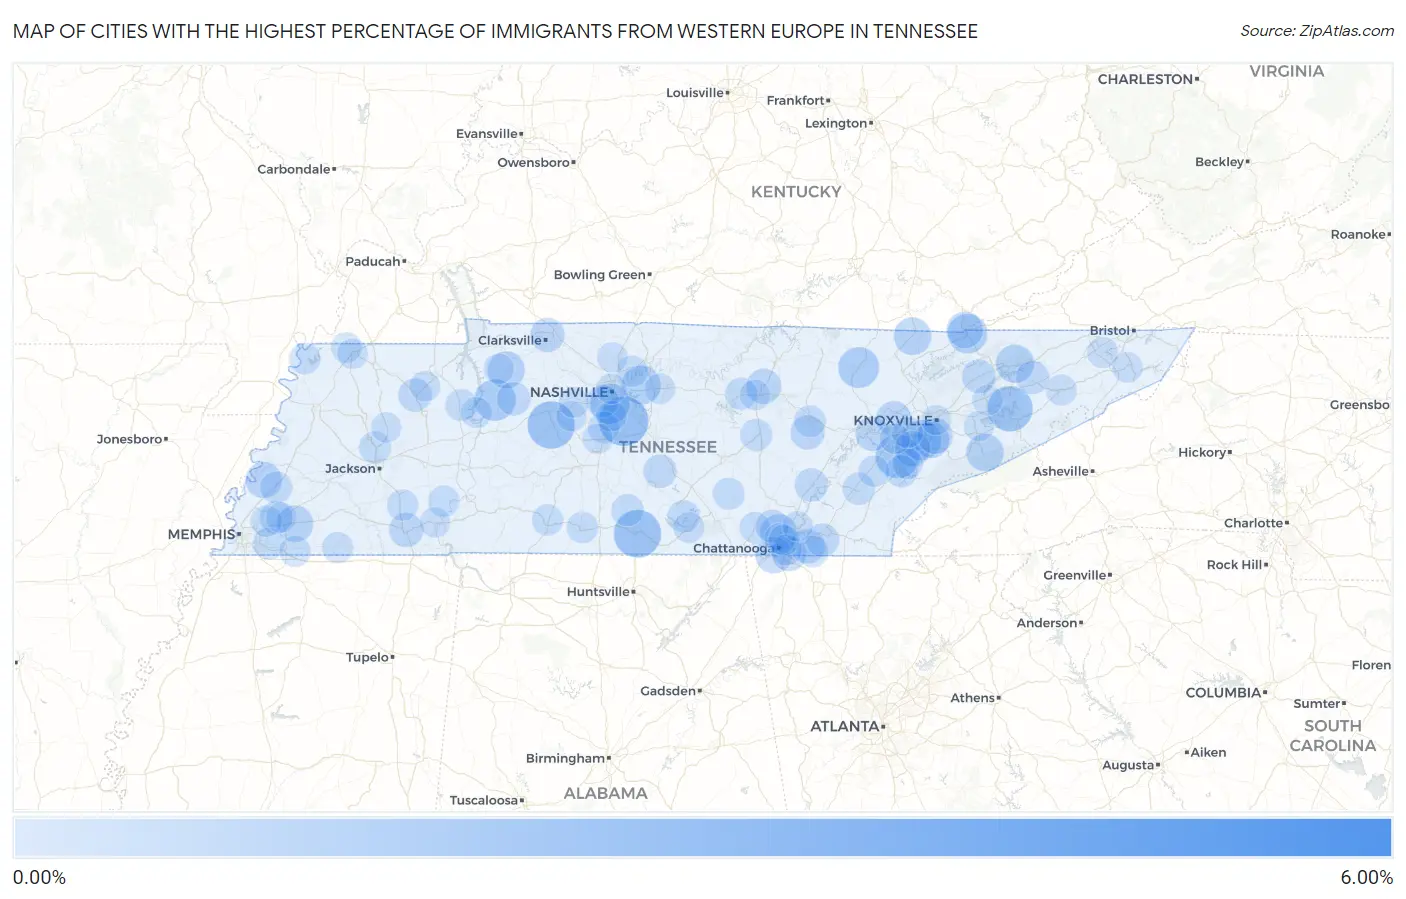
Map of Cities with the Highest Percentage of Immigrants from Western Europe in Tennessee
0.00%
6.00%
Cities with the Highest Percentage of Immigrants from Western Europe in Tennessee
| City | Western Europe | vs State | vs National | |
| 1. | Rarity Bay | 5.72% | 0.17%(+5.55)#1 | 0.28%(+5.44)#93 |
| 2. | Nolensville | 2.20% | 0.17%(+2.04)#2 | 0.28%(+1.92)#439 |
| 3. | Fayetteville | 1.98% | 0.17%(+1.81)#3 | 0.28%(+1.70)#526 |
| 4. | Bon Aqua Junction | 1.97% | 0.17%(+1.80)#4 | 0.28%(+1.69)#531 |
| 5. | Baneberry | 1.77% | 0.17%(+1.61)#5 | 0.28%(+1.49)#621 |
| 6. | Tellico Village | 1.61% | 0.17%(+1.44)#6 | 0.28%(+1.33)#719 |
| 7. | Waverly | 1.35% | 0.17%(+1.19)#7 | 0.28%(+1.07)#923 |
| 8. | Elgin | 1.27% | 0.17%(+1.11)#8 | 0.28%(+0.995)#1,011 |
| 9. | Oak Hill | 1.20% | 0.17%(+1.03)#9 | 0.28%(+0.917)#1,097 |
| 10. | Louisville | 1.19% | 0.17%(+1.03)#10 | 0.28%(+0.914)#1,103 |
| 11. | Harrogate | 1.12% | 0.17%(+0.955)#11 | 0.28%(+0.842)#1,208 |
| 12. | Mount Juliet | 1.07% | 0.17%(+0.899)#12 | 0.28%(+0.786)#1,302 |
| 13. | Mooresburg | 1.00% | 0.17%(+0.830)#13 | 0.28%(+0.717)#1,437 |
| 14. | Delano | 0.94% | 0.17%(+0.778)#14 | 0.28%(+0.665)#1,544 |
| 15. | Jellico | 0.94% | 0.17%(+0.774)#15 | 0.28%(+0.661)#1,555 |
| 16. | Gatlinburg | 0.91% | 0.17%(+0.741)#16 | 0.28%(+0.628)#1,637 |
| 17. | Erin | 0.89% | 0.17%(+0.724)#17 | 0.28%(+0.611)#1,683 |
| 18. | Walden | 0.83% | 0.17%(+0.666)#18 | 0.28%(+0.553)#1,832 |
| 19. | Oakland | 0.82% | 0.17%(+0.654)#19 | 0.28%(+0.541)#1,862 |
| 20. | Lookout Mountain | 0.80% | 0.17%(+0.632)#20 | 0.28%(+0.520)#1,930 |
| 21. | Cumberland Gap | 0.80% | 0.17%(+0.631)#21 | 0.28%(+0.519)#1,933 |
| 22. | Gilt Edge | 0.78% | 0.17%(+0.613)#22 | 0.28%(+0.500)#1,988 |
| 23. | Alcoa | 0.74% | 0.17%(+0.573)#23 | 0.28%(+0.460)#2,123 |
| 24. | Friendsville | 0.73% | 0.17%(+0.563)#24 | 0.28%(+0.450)#2,169 |
| 25. | Rockford | 0.71% | 0.17%(+0.540)#25 | 0.28%(+0.427)#2,247 |
| 26. | Oak Ridge | 0.66% | 0.17%(+0.496)#26 | 0.28%(+0.383)#2,410 |
| 27. | Algood | 0.66% | 0.17%(+0.493)#27 | 0.28%(+0.380)#2,426 |
| 28. | East Ridge | 0.62% | 0.17%(+0.451)#28 | 0.28%(+0.338)#2,648 |
| 29. | Collegedale | 0.60% | 0.17%(+0.434)#29 | 0.28%(+0.321)#2,755 |
| 30. | Selmer | 0.59% | 0.17%(+0.419)#30 | 0.28%(+0.306)#2,824 |
| 31. | Lake Tansi | 0.57% | 0.17%(+0.405)#31 | 0.28%(+0.292)#2,890 |
| 32. | Kingston | 0.57% | 0.17%(+0.401)#32 | 0.28%(+0.289)#2,908 |
| 33. | Clarksville | 0.55% | 0.17%(+0.387)#33 | 0.28%(+0.274)#2,983 |
| 34. | Rutledge | 0.52% | 0.17%(+0.350)#34 | 0.28%(+0.237)#3,210 |
| 35. | Mckenzie | 0.50% | 0.17%(+0.333)#35 | 0.28%(+0.220)#3,334 |
| 36. | Mcewen | 0.49% | 0.17%(+0.328)#36 | 0.28%(+0.215)#3,364 |
| 37. | Bell Buckle | 0.48% | 0.17%(+0.317)#37 | 0.28%(+0.204)#3,447 |
| 38. | Dayton | 0.48% | 0.17%(+0.310)#38 | 0.28%(+0.197)#3,495 |
| 39. | South Cleveland | 0.47% | 0.17%(+0.307)#39 | 0.28%(+0.194)#3,522 |
| 40. | Lynchburg | 0.46% | 0.17%(+0.291)#40 | 0.28%(+0.178)#3,632 |
| 41. | Bulls Gap | 0.46% | 0.17%(+0.291)#41 | 0.28%(+0.178)#3,633 |
| 42. | Lone Oak | 0.44% | 0.17%(+0.275)#42 | 0.28%(+0.163)#3,753 |
| 43. | Lakeland | 0.39% | 0.17%(+0.225)#43 | 0.28%(+0.112)#4,221 |
| 44. | Athens | 0.38% | 0.17%(+0.210)#44 | 0.28%(+0.097)#4,380 |
| 45. | Belle Meade | 0.38% | 0.17%(+0.209)#45 | 0.28%(+0.096)#4,388 |
| 46. | Petersburg | 0.36% | 0.17%(+0.193)#46 | 0.28%(+0.080)#4,555 |
| 47. | Brighton | 0.35% | 0.17%(+0.181)#47 | 0.28%(+0.068)#4,688 |
| 48. | Vonore | 0.35% | 0.17%(+0.180)#48 | 0.28%(+0.068)#4,698 |
| 49. | Estill Springs | 0.35% | 0.17%(+0.180)#49 | 0.28%(+0.067)#4,702 |
| 50. | Doyle | 0.35% | 0.17%(+0.179)#50 | 0.28%(+0.066)#4,715 |
| 51. | Three Way | 0.34% | 0.17%(+0.175)#51 | 0.28%(+0.063)#4,755 |
| 52. | Baxter | 0.34% | 0.17%(+0.172)#52 | 0.28%(+0.059)#4,794 |
| 53. | Powell | 0.34% | 0.17%(+0.169)#53 | 0.28%(+0.057)#4,824 |
| 54. | Altamont | 0.33% | 0.17%(+0.165)#54 | 0.28%(+0.053)#4,867 |
| 55. | Camden | 0.33% | 0.17%(+0.161)#55 | 0.28%(+0.048)#4,904 |
| 56. | Crossville | 0.32% | 0.17%(+0.156)#56 | 0.28%(+0.043)#4,961 |
| 57. | Apison | 0.31% | 0.17%(+0.143)#57 | 0.28%(+0.030)#5,110 |
| 58. | Franklin | 0.29% | 0.17%(+0.122)#58 | 0.28%(+0.009)#5,383 |
| 59. | Saltillo | 0.27% | 0.17%(+0.108)#59 | 0.28%(-0.005)#5,549 |
| 60. | Germantown | 0.27% | 0.17%(+0.106)#60 | 0.28%(-0.007)#5,577 |
| 61. | Sweetwater | 0.27% | 0.17%(+0.103)#61 | 0.28%(-0.010)#5,620 |
| 62. | Tiptonville | 0.26% | 0.17%(+0.095)#62 | 0.28%(-0.018)#5,726 |
| 63. | Finger | 0.26% | 0.17%(+0.093)#63 | 0.28%(-0.020)#5,742 |
| 64. | Bartlett | 0.25% | 0.17%(+0.088)#64 | 0.28%(-0.025)#5,827 |
| 65. | Hendersonville | 0.25% | 0.17%(+0.087)#65 | 0.28%(-0.026)#5,837 |
| 66. | Rossville | 0.25% | 0.17%(+0.087)#66 | 0.28%(-0.026)#5,842 |
| 67. | Pulaski | 0.25% | 0.17%(+0.087)#67 | 0.28%(-0.026)#5,845 |
| 68. | Lawrenceburg | 0.25% | 0.17%(+0.084)#68 | 0.28%(-0.029)#5,887 |
| 69. | Whitwell | 0.24% | 0.17%(+0.076)#69 | 0.28%(-0.037)#5,993 |
| 70. | Winchester | 0.23% | 0.17%(+0.066)#70 | 0.28%(-0.046)#6,128 |
| 71. | Grand Junction | 0.23% | 0.17%(+0.066)#71 | 0.28%(-0.047)#6,131 |
| 72. | Farragut | 0.23% | 0.17%(+0.060)#72 | 0.28%(-0.052)#6,222 |
| 73. | Red Bank | 0.23% | 0.17%(+0.060)#73 | 0.28%(-0.053)#6,226 |
| 74. | Greeneville | 0.23% | 0.17%(+0.060)#74 | 0.28%(-0.053)#6,228 |
| 75. | Spurgeon | 0.22% | 0.17%(+0.058)#75 | 0.28%(-0.055)#6,260 |
| 76. | Ridgeside | 0.22% | 0.17%(+0.051)#76 | 0.28%(-0.062)#6,369 |
| 77. | New Johnsonville | 0.22% | 0.17%(+0.050)#77 | 0.28%(-0.062)#6,384 |
| 78. | Greenback | 0.20% | 0.17%(+0.037)#78 | 0.28%(-0.075)#6,592 |
| 79. | Chattanooga | 0.20% | 0.17%(+0.037)#79 | 0.28%(-0.076)#6,608 |
| 80. | Brentwood | 0.19% | 0.17%(+0.019)#80 | 0.28%(-0.094)#6,905 |
| 81. | Nashville | 0.18% | 0.17%(+0.012)#81 | 0.28%(-0.100)#7,011 |
| 82. | Jefferson City | 0.18% | 0.17%(+0.012)#82 | 0.28%(-0.101)#7,013 |
| 83. | Woodland Mills | 0.18% | 0.17%(+0.009)#83 | 0.28%(-0.104)#7,069 |
| 84. | Henry | 0.17% | 0.17%(+0.007)#84 | 0.28%(-0.105)#7,098 |
| 85. | Lebanon | 0.17% | 0.17%(+0.005)#85 | 0.28%(-0.107)#7,128 |
| 86. | Ridgetop | 0.17% | 0.17%(+0.002)#86 | 0.28%(-0.111)#7,187 |
| 87. | Elizabethton | 0.17% | 0.17%(+0.001)#87 | 0.28%(-0.112)#7,202 |
| 88. | Cookeville | 0.17% | 0.17%(-0.001)#88 | 0.28%(-0.113)#7,216 |
| 89. | Arlington | 0.16% | 0.17%(-0.006)#89 | 0.28%(-0.119)#7,301 |
| 90. | Crump | 0.15% | 0.17%(-0.012)#90 | 0.28%(-0.125)#7,405 |
| 91. | Union City | 0.15% | 0.17%(-0.013)#91 | 0.28%(-0.126)#7,413 |
| 92. | Thompson S Station | 0.15% | 0.17%(-0.018)#92 | 0.28%(-0.131)#7,486 |
| 93. | Fairview | 0.15% | 0.17%(-0.019)#93 | 0.28%(-0.132)#7,502 |
| 94. | Milan | 0.15% | 0.17%(-0.019)#94 | 0.28%(-0.132)#7,505 |
| 95. | Lakesite | 0.15% | 0.17%(-0.021)#95 | 0.28%(-0.133)#7,527 |
| 96. | Lenoir City | 0.15% | 0.17%(-0.021)#96 | 0.28%(-0.134)#7,532 |
| 97. | Kingston Springs | 0.14% | 0.17%(-0.023)#97 | 0.28%(-0.136)#7,591 |
| 98. | Tennessee Ridge | 0.14% | 0.17%(-0.024)#98 | 0.28%(-0.136)#7,594 |
| 99. | Sevierville | 0.14% | 0.17%(-0.027)#99 | 0.28%(-0.140)#7,665 |
| 100. | Knoxville | 0.14% | 0.17%(-0.029)#100 | 0.28%(-0.142)#7,690 |
Common Questions
What are the Top 10 Cities with the Highest Percentage of Immigrants from Western Europe in Tennessee?
Top 10 Cities with the Highest Percentage of Immigrants from Western Europe in Tennessee are:
#1
2.20%
#2
1.98%
#3
1.97%
#4
1.77%
#5
1.61%
#6
1.35%
#7
1.27%
#8
1.20%
#9
1.19%
#10
1.12%
What city has the Highest Percentage of Immigrants from Western Europe in Tennessee?
Nolensville has the Highest Percentage of Immigrants from Western Europe in Tennessee with 2.20%.
What is the Percentage of Immigrants from Western Europe in the State of Tennessee?
Percentage of Immigrants from Western Europe in Tennessee is 0.17%.
What is the Percentage of Immigrants from Western Europe in the United States?
Percentage of Immigrants from Western Europe in the United States is 0.28%.