Cities with the Highest Percentage of Immigrants from Western Europe in Connecticut
RELATED REPORTS & OPTIONS
Western Europe
Connecticut
Compare Cities
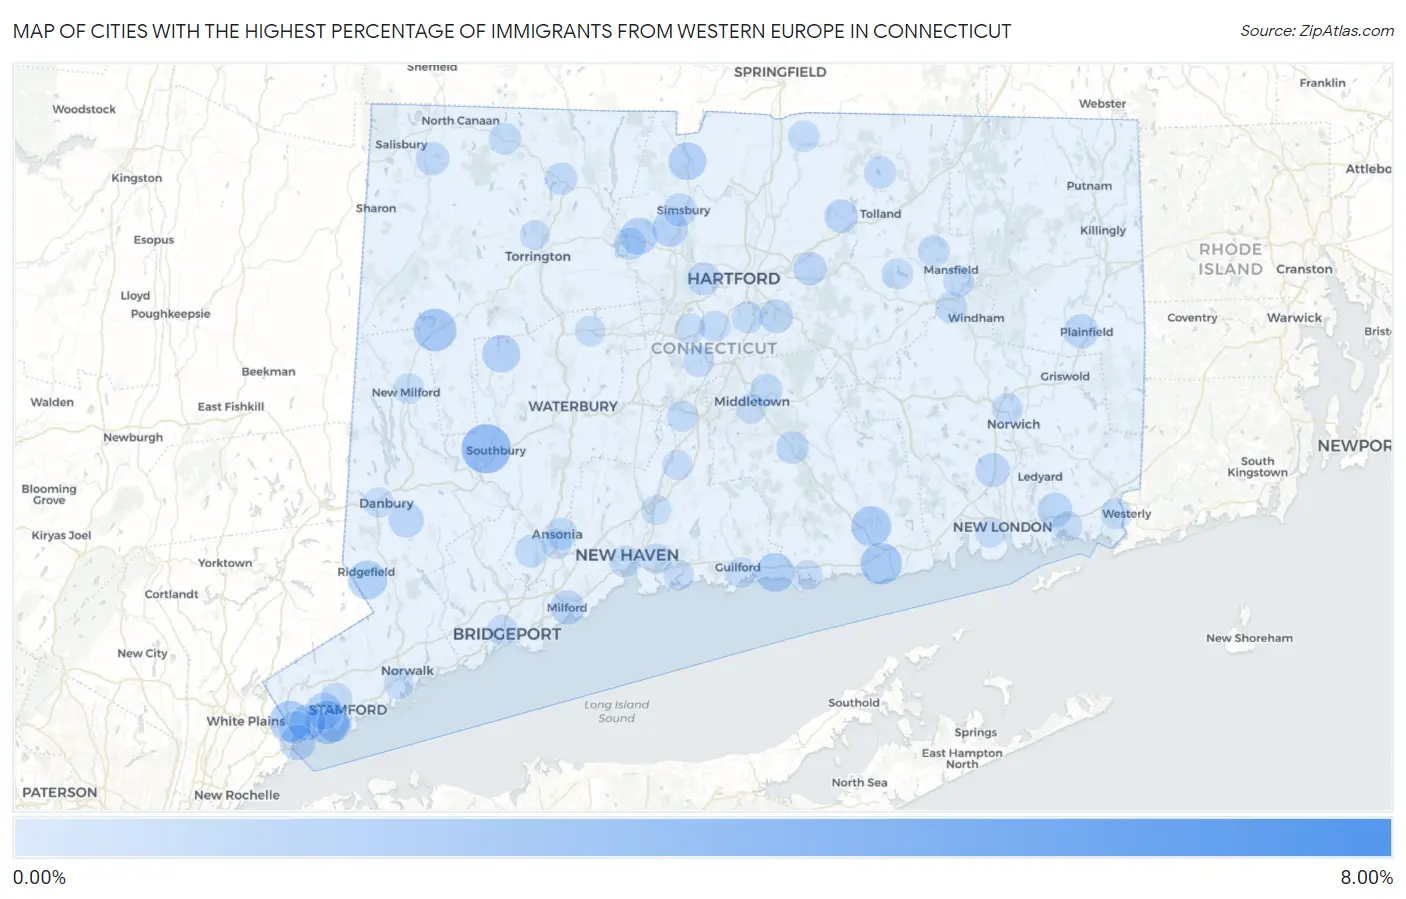
Map of Cities with the Highest Percentage of Immigrants from Western Europe in Connecticut
0.00%
8.00%
Cities with the Highest Percentage of Immigrants from Western Europe in Connecticut
| City | Western Europe | vs State | vs National | |
| 1. | Knollcrest | 6.95% | 0.36%(+6.59)#1 | 0.28%(+6.67)#70 |
| 2. | Candlewood Knolls | 6.47% | 0.36%(+6.11)#2 | 0.28%(+6.19)#78 |
| 3. | Weston | 5.65% | 0.36%(+5.28)#3 | 0.28%(+5.37)#96 |
| 4. | Brookfield Center | 5.29% | 0.36%(+4.93)#4 | 0.28%(+5.01)#113 |
| 5. | Cornwall | 4.82% | 0.36%(+4.45)#5 | 0.28%(+4.54)#135 |
| 6. | Bigelow Corners | 3.74% | 0.36%(+3.37)#6 | 0.28%(+3.46)#182 |
| 7. | Heritage Village | 2.74% | 0.36%(+2.38)#7 | 0.28%(+2.46)#303 |
| 8. | Rock Ridge | 2.39% | 0.36%(+2.03)#8 | 0.28%(+2.11)#376 |
| 9. | Ridgebury | 2.19% | 0.36%(+1.83)#9 | 0.28%(+1.92)#442 |
| 10. | Stonington Borough | 1.91% | 0.36%(+1.55)#10 | 0.28%(+1.63)#552 |
| 11. | Riverside | 1.89% | 0.36%(+1.53)#11 | 0.28%(+1.61)#565 |
| 12. | New Preston | 1.85% | 0.36%(+1.49)#12 | 0.28%(+1.57)#575 |
| 13. | Old Saybrook Center | 1.69% | 0.36%(+1.32)#13 | 0.28%(+1.41)#665 |
| 14. | Glenville | 1.64% | 0.36%(+1.27)#14 | 0.28%(+1.36)#699 |
| 15. | Essex Village | 1.50% | 0.36%(+1.14)#15 | 0.28%(+1.23)#791 |
| 16. | Ridgefield | 1.33% | 0.36%(+0.968)#16 | 0.28%(+1.05)#945 |
| 17. | Cornwall Bridge | 1.31% | 0.36%(+0.946)#17 | 0.28%(+1.03)#966 |
| 18. | Madison Center | 1.30% | 0.36%(+0.938)#18 | 0.28%(+1.02)#979 |
| 19. | Compo | 1.26% | 0.36%(+0.900)#19 | 0.28%(+0.985)#1,024 |
| 20. | Lakeside Woods | 1.24% | 0.36%(+0.879)#20 | 0.28%(+0.965)#1,041 |
| 21. | Salmon Brook | 1.19% | 0.36%(+0.826)#21 | 0.28%(+0.911)#1,106 |
| 22. | Bethlehem Village | 1.19% | 0.36%(+0.824)#22 | 0.28%(+0.910)#1,109 |
| 23. | Canton Valley | 1.08% | 0.36%(+0.714)#23 | 0.28%(+0.799)#1,274 |
| 24. | Cos Cob | 1.05% | 0.36%(+0.685)#24 | 0.28%(+0.770)#1,328 |
| 25. | Trumbull Center | 1.04% | 0.36%(+0.681)#25 | 0.28%(+0.766)#1,336 |
| 26. | Weatogue | 0.97% | 0.36%(+0.609)#26 | 0.28%(+0.694)#1,486 |
| 27. | Litchfield Borough | 0.96% | 0.36%(+0.595)#27 | 0.28%(+0.680)#1,509 |
| 28. | Old Hill | 0.95% | 0.36%(+0.581)#28 | 0.28%(+0.666)#1,542 |
| 29. | Greenwich | 0.94% | 0.36%(+0.575)#29 | 0.28%(+0.660)#1,559 |
| 30. | Noroton | 0.93% | 0.36%(+0.563)#30 | 0.28%(+0.648)#1,579 |
| 31. | Byram | 0.91% | 0.36%(+0.544)#31 | 0.28%(+0.629)#1,636 |
| 32. | Bethel | 0.82% | 0.36%(+0.458)#32 | 0.28%(+0.543)#1,856 |
| 33. | Sandy Hook | 0.81% | 0.36%(+0.448)#33 | 0.28%(+0.533)#1,888 |
| 34. | Old Mystic | 0.80% | 0.36%(+0.433)#34 | 0.28%(+0.518)#1,934 |
| 35. | South Wilton | 0.77% | 0.36%(+0.406)#35 | 0.28%(+0.491)#2,022 |
| 36. | Plainfield Village | 0.75% | 0.36%(+0.382)#36 | 0.28%(+0.467)#2,092 |
| 37. | Oxoboxo River | 0.74% | 0.36%(+0.377)#37 | 0.28%(+0.462)#2,114 |
| 38. | Stepney | 0.73% | 0.36%(+0.370)#38 | 0.28%(+0.456)#2,140 |
| 39. | Milford City Balance | 0.72% | 0.36%(+0.354)#39 | 0.28%(+0.439)#2,207 |
| 40. | Old Greenwich | 0.69% | 0.36%(+0.330)#40 | 0.28%(+0.415)#2,283 |
| 41. | Staples | 0.67% | 0.36%(+0.302)#41 | 0.28%(+0.387)#2,395 |
| 42. | Glastonbury Center | 0.67% | 0.36%(+0.301)#42 | 0.28%(+0.387)#2,400 |
| 43. | Noroton Heights | 0.67% | 0.36%(+0.301)#43 | 0.28%(+0.386)#2,403 |
| 44. | Manchester | 0.65% | 0.36%(+0.287)#44 | 0.28%(+0.372)#2,464 |
| 45. | Rockville | 0.65% | 0.36%(+0.283)#45 | 0.28%(+0.368)#2,487 |
| 46. | Falls Village | 0.63% | 0.36%(+0.270)#46 | 0.28%(+0.355)#2,558 |
| 47. | Lakes East | 0.62% | 0.36%(+0.253)#47 | 0.28%(+0.338)#2,641 |
| 48. | Simsbury Center | 0.59% | 0.36%(+0.225)#48 | 0.28%(+0.310)#2,796 |
| 49. | West Hartford | 0.57% | 0.36%(+0.210)#49 | 0.28%(+0.295)#2,870 |
| 50. | Bantam Borough | 0.57% | 0.36%(+0.209)#50 | 0.28%(+0.295)#2,871 |
| 51. | Pemberwick | 0.56% | 0.36%(+0.196)#51 | 0.28%(+0.281)#2,951 |
| 52. | Woodmont Borough | 0.56% | 0.36%(+0.191)#52 | 0.28%(+0.277)#2,973 |
| 53. | Sacred Heart University | 0.55% | 0.36%(+0.187)#53 | 0.28%(+0.272)#2,996 |
| 54. | Daniels Farm | 0.54% | 0.36%(+0.179)#54 | 0.28%(+0.265)#3,037 |
| 55. | Higganum | 0.53% | 0.36%(+0.167)#55 | 0.28%(+0.252)#3,118 |
| 56. | Shelton | 0.52% | 0.36%(+0.155)#56 | 0.28%(+0.240)#3,191 |
| 57. | Portland | 0.50% | 0.36%(+0.134)#57 | 0.28%(+0.219)#3,339 |
| 58. | Crystal Lake | 0.48% | 0.36%(+0.116)#58 | 0.28%(+0.201)#3,465 |
| 59. | Collinsville | 0.48% | 0.36%(+0.116)#59 | 0.28%(+0.201)#3,473 |
| 60. | Winsted | 0.48% | 0.36%(+0.115)#60 | 0.28%(+0.200)#3,476 |
| 61. | Norfolk | 0.46% | 0.36%(+0.096)#61 | 0.28%(+0.181)#3,614 |
| 62. | Ansonia | 0.44% | 0.36%(+0.079)#62 | 0.28%(+0.164)#3,740 |
| 63. | Wethersfield | 0.42% | 0.36%(+0.055)#63 | 0.28%(+0.140)#3,934 |
| 64. | Stamford | 0.42% | 0.36%(+0.051)#64 | 0.28%(+0.136)#3,971 |
| 65. | Storrs | 0.41% | 0.36%(+0.050)#65 | 0.28%(+0.135)#3,975 |
| 66. | Westport | 0.41% | 0.36%(+0.048)#66 | 0.28%(+0.133)#3,995 |
| 67. | Ball Pond | 0.40% | 0.36%(+0.031)#67 | 0.28%(+0.116)#4,169 |
| 68. | Groton Long Point Borough | 0.39% | 0.36%(+0.022)#68 | 0.28%(+0.108)#4,264 |
| 69. | New Haven | 0.38% | 0.36%(+0.014)#69 | 0.28%(+0.099)#4,349 |
| 70. | Willimantic | 0.38% | 0.36%(+0.013)#70 | 0.28%(+0.098)#4,363 |
| 71. | Hazardville | 0.36% | 0.36%(-0.005)#71 | 0.28%(+0.080)#4,557 |
| 72. | Pawcatuck | 0.36% | 0.36%(-0.005)#72 | 0.28%(+0.080)#4,561 |
| 73. | Tokeneke | 0.35% | 0.36%(-0.015)#73 | 0.28%(+0.070)#4,669 |
| 74. | Kensington | 0.34% | 0.36%(-0.020)#74 | 0.28%(+0.065)#4,723 |
| 75. | Meriden | 0.34% | 0.36%(-0.023)#75 | 0.28%(+0.063)#4,759 |
| 76. | Coventry Lake | 0.31% | 0.36%(-0.051)#76 | 0.28%(+0.035)#5,057 |
| 77. | Mansfield Center | 0.31% | 0.36%(-0.052)#77 | 0.28%(+0.033)#5,077 |
| 78. | Norwich | 0.31% | 0.36%(-0.055)#78 | 0.28%(+0.030)#5,113 |
| 79. | Newtown Borough | 0.31% | 0.36%(-0.058)#79 | 0.28%(+0.027)#5,147 |
| 80. | Newington | 0.30% | 0.36%(-0.066)#80 | 0.28%(+0.020)#5,241 |
| 81. | Bridgeport | 0.29% | 0.36%(-0.077)#81 | 0.28%(+0.008)#5,390 |
| 82. | New Milford | 0.28% | 0.36%(-0.083)#82 | 0.28%(+0.003)#5,450 |
| 83. | Inglenook | 0.28% | 0.36%(-0.087)#83 | 0.28%(-0.002)#5,517 |
| 84. | East Haven | 0.27% | 0.36%(-0.092)#84 | 0.28%(-0.007)#5,574 |
| 85. | Oronoque | 0.27% | 0.36%(-0.094)#85 | 0.28%(-0.009)#5,604 |
| 86. | Derby | 0.27% | 0.36%(-0.098)#86 | 0.28%(-0.013)#5,655 |
| 87. | New Britain | 0.26% | 0.36%(-0.106)#87 | 0.28%(-0.021)#5,763 |
| 88. | Branford Center | 0.26% | 0.36%(-0.106)#88 | 0.28%(-0.021)#5,770 |
| 89. | Norwalk | 0.25% | 0.36%(-0.117)#89 | 0.28%(-0.032)#5,922 |
| 90. | Guilford Center | 0.24% | 0.36%(-0.128)#90 | 0.28%(-0.043)#6,078 |
| 91. | Wallingford Center | 0.23% | 0.36%(-0.135)#91 | 0.28%(-0.050)#6,180 |
| 92. | Terryville | 0.22% | 0.36%(-0.144)#92 | 0.28%(-0.059)#6,327 |
| 93. | Danbury | 0.22% | 0.36%(-0.149)#93 | 0.28%(-0.064)#6,409 |
| 94. | North Haven | 0.22% | 0.36%(-0.149)#94 | 0.28%(-0.064)#6,410 |
| 95. | Mystic | 0.20% | 0.36%(-0.161)#95 | 0.28%(-0.076)#6,594 |
| 96. | Northford | 0.19% | 0.36%(-0.171)#96 | 0.28%(-0.085)#6,753 |
| 97. | Middletown | 0.19% | 0.36%(-0.171)#97 | 0.28%(-0.086)#6,768 |
| 98. | Clinton | 0.19% | 0.36%(-0.172)#98 | 0.28%(-0.087)#6,782 |
| 99. | Torrington | 0.19% | 0.36%(-0.173)#99 | 0.28%(-0.088)#6,805 |
| 100. | Waterford | 0.18% | 0.36%(-0.181)#100 | 0.28%(-0.096)#6,934 |
1
2Common Questions
What are the Top 10 Cities with the Highest Percentage of Immigrants from Western Europe in Connecticut?
Top 10 Cities with the Highest Percentage of Immigrants from Western Europe in Connecticut are:
#1
2.74%
#2
1.89%
#3
1.85%
#4
1.69%
#5
1.64%
#6
1.50%
#7
1.33%
#8
1.30%
#9
1.19%
#10
1.19%
What city has the Highest Percentage of Immigrants from Western Europe in Connecticut?
Heritage Village has the Highest Percentage of Immigrants from Western Europe in Connecticut with 2.74%.
What is the Percentage of Immigrants from Western Europe in the State of Connecticut?
Percentage of Immigrants from Western Europe in Connecticut is 0.36%.
What is the Percentage of Immigrants from Western Europe in the United States?
Percentage of Immigrants from Western Europe in the United States is 0.28%.