Cities with the Highest Percentage of Immigrants from Western Europe in Indiana
RELATED REPORTS & OPTIONS
Western Europe
Indiana
Compare Cities
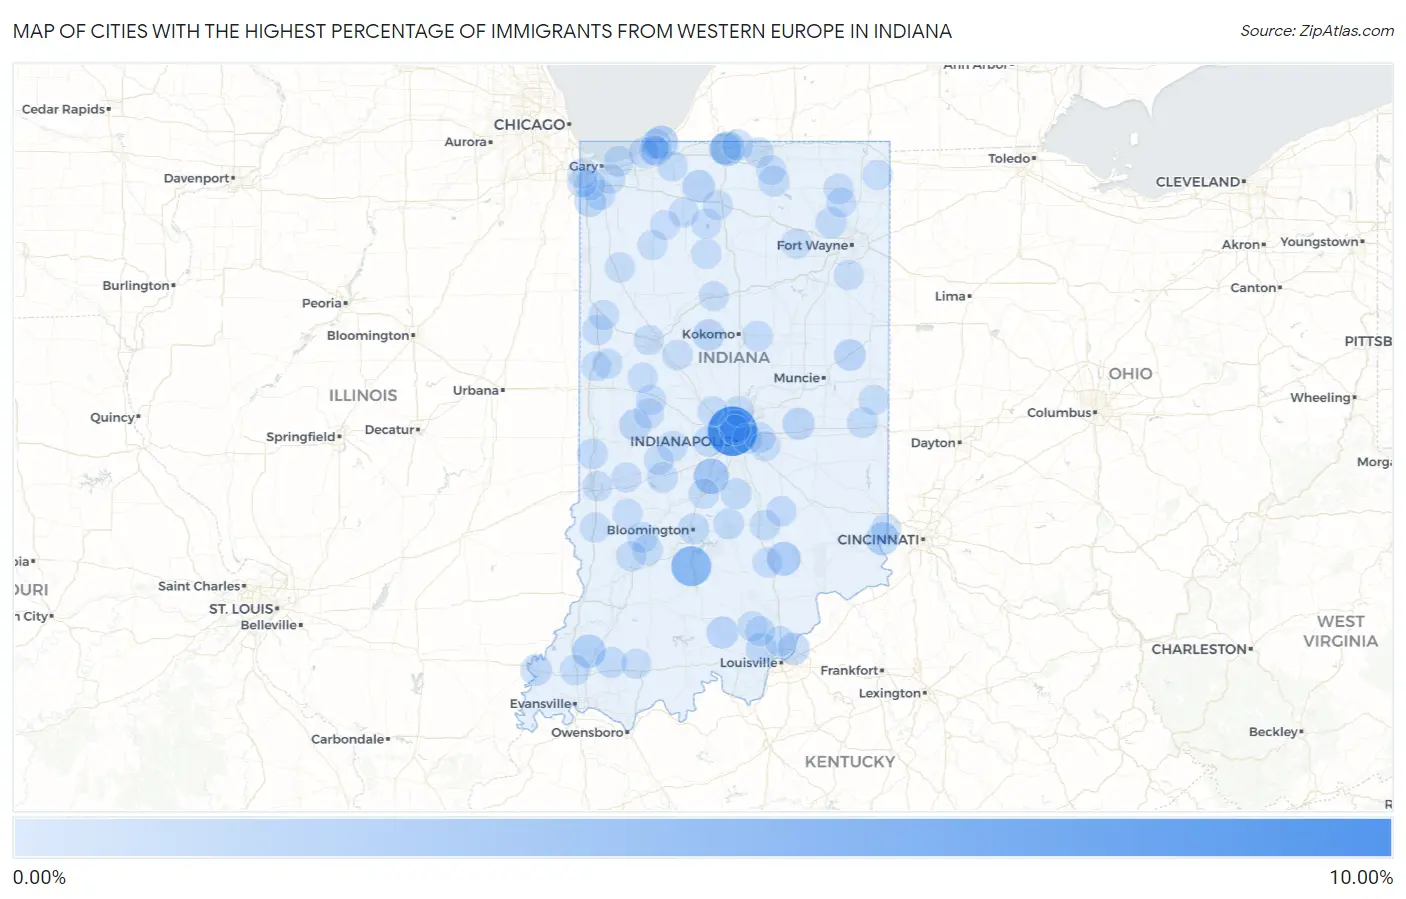
Map of Cities with the Highest Percentage of Immigrants from Western Europe in Indiana
0.00%
10.00%
Cities with the Highest Percentage of Immigrants from Western Europe in Indiana
| City | Western Europe | vs State | vs National | |
| 1. | Spring Hill | 9.72% | 0.13%(+9.59)#1 | 0.28%(+9.44)#32 |
| 2. | Philadelphia | 8.52% | 0.13%(+8.39)#2 | 0.28%(+8.25)#46 |
| 3. | Hoffman Lake | 7.62% | 0.13%(+7.49)#3 | 0.28%(+7.34)#62 |
| 4. | Avoca | 4.93% | 0.13%(+4.79)#4 | 0.28%(+4.65)#127 |
| 5. | Bethany | 2.70% | 0.13%(+2.57)#5 | 0.28%(+2.42)#313 |
| 6. | Indian Village | 2.26% | 0.13%(+2.12)#6 | 0.28%(+1.98)#422 |
| 7. | Hayden | 1.94% | 0.13%(+1.81)#7 | 0.28%(+1.66)#540 |
| 8. | Michiana Shores | 1.90% | 0.13%(+1.77)#8 | 0.28%(+1.63)#559 |
| 9. | Francisco | 1.83% | 0.13%(+1.70)#9 | 0.28%(+1.55)#589 |
| 10. | Lawrenceburg | 1.63% | 0.13%(+1.50)#10 | 0.28%(+1.35)#702 |
| 11. | North Crows Nest | 1.41% | 0.13%(+1.28)#11 | 0.28%(+1.13)#867 |
| 12. | Lake Of The Woods | 1.36% | 0.13%(+1.22)#12 | 0.28%(+1.08)#920 |
| 13. | Walkerton | 1.34% | 0.13%(+1.20)#13 | 0.28%(+1.06)#940 |
| 14. | Wilkinson | 1.15% | 0.13%(+1.01)#14 | 0.28%(+0.868)#1,180 |
| 15. | Hardinsburg | 1.12% | 0.13%(+0.985)#15 | 0.28%(+0.838)#1,215 |
| 16. | Utica | 1.07% | 0.13%(+0.941)#16 | 0.28%(+0.794)#1,287 |
| 17. | Waveland | 1.03% | 0.13%(+0.896)#17 | 0.28%(+0.749)#1,378 |
| 18. | Everton | 1.02% | 0.13%(+0.883)#18 | 0.28%(+0.736)#1,401 |
| 19. | Roseland | 1.01% | 0.13%(+0.875)#19 | 0.28%(+0.728)#1,415 |
| 20. | Burlington | 0.95% | 0.13%(+0.815)#20 | 0.28%(+0.669)#1,535 |
| 21. | Redkey | 0.90% | 0.13%(+0.773)#21 | 0.28%(+0.626)#1,641 |
| 22. | Griffin | 0.88% | 0.13%(+0.753)#22 | 0.28%(+0.606)#1,700 |
| 23. | Cedar Lake | 0.88% | 0.13%(+0.747)#23 | 0.28%(+0.600)#1,716 |
| 24. | Galena | 0.79% | 0.13%(+0.654)#24 | 0.28%(+0.507)#1,970 |
| 25. | Palestine | 0.74% | 0.13%(+0.608)#25 | 0.28%(+0.461)#2,121 |
| 26. | Bloomington | 0.72% | 0.13%(+0.587)#26 | 0.28%(+0.440)#2,205 |
| 27. | Churubusco | 0.71% | 0.13%(+0.578)#27 | 0.28%(+0.431)#2,232 |
| 28. | Avon | 0.69% | 0.13%(+0.556)#28 | 0.28%(+0.409)#2,296 |
| 29. | Nashville | 0.65% | 0.13%(+0.522)#29 | 0.28%(+0.375)#2,449 |
| 30. | Trafalgar | 0.64% | 0.13%(+0.505)#30 | 0.28%(+0.358)#2,543 |
| 31. | Granger | 0.63% | 0.13%(+0.501)#31 | 0.28%(+0.354)#2,564 |
| 32. | New Paris | 0.63% | 0.13%(+0.493)#32 | 0.28%(+0.346)#2,607 |
| 33. | Spurgeon | 0.62% | 0.13%(+0.489)#33 | 0.28%(+0.342)#2,627 |
| 34. | Greens Fork | 0.56% | 0.13%(+0.429)#34 | 0.28%(+0.283)#2,944 |
| 35. | Bloomfield | 0.56% | 0.13%(+0.424)#35 | 0.28%(+0.277)#2,971 |
| 36. | Cloverdale | 0.55% | 0.13%(+0.413)#36 | 0.28%(+0.266)#3,028 |
| 37. | Barbee | 0.54% | 0.13%(+0.411)#37 | 0.28%(+0.264)#3,040 |
| 38. | Heritage Lake | 0.54% | 0.13%(+0.409)#38 | 0.28%(+0.262)#3,051 |
| 39. | Greentown | 0.54% | 0.13%(+0.408)#39 | 0.28%(+0.261)#3,056 |
| 40. | Haubstadt | 0.53% | 0.13%(+0.396)#40 | 0.28%(+0.250)#3,136 |
| 41. | Fairview Park | 0.50% | 0.13%(+0.370)#41 | 0.28%(+0.223)#3,309 |
| 42. | Columbus | 0.49% | 0.13%(+0.361)#42 | 0.28%(+0.214)#3,373 |
| 43. | Ogden Dunes | 0.49% | 0.13%(+0.360)#43 | 0.28%(+0.213)#3,381 |
| 44. | Worthington | 0.47% | 0.13%(+0.335)#44 | 0.28%(+0.189)#3,556 |
| 45. | Carmel | 0.46% | 0.13%(+0.331)#45 | 0.28%(+0.184)#3,590 |
| 46. | Boswell | 0.43% | 0.13%(+0.299)#46 | 0.28%(+0.152)#3,836 |
| 47. | Sellersburg | 0.42% | 0.13%(+0.290)#47 | 0.28%(+0.143)#3,906 |
| 48. | Hope | 0.42% | 0.13%(+0.288)#48 | 0.28%(+0.141)#3,919 |
| 49. | Crown Point | 0.41% | 0.13%(+0.280)#49 | 0.28%(+0.133)#3,998 |
| 50. | La Porte | 0.41% | 0.13%(+0.278)#50 | 0.28%(+0.131)#4,013 |
| 51. | Schererville | 0.40% | 0.13%(+0.267)#51 | 0.28%(+0.120)#4,125 |
| 52. | South Whitley | 0.39% | 0.13%(+0.260)#52 | 0.28%(+0.114)#4,197 |
| 53. | Shelburn | 0.39% | 0.13%(+0.259)#53 | 0.28%(+0.112)#4,218 |
| 54. | Mulberry | 0.39% | 0.13%(+0.258)#54 | 0.28%(+0.111)#4,231 |
| 55. | Lyons | 0.37% | 0.13%(+0.242)#55 | 0.28%(+0.095)#4,400 |
| 56. | Hobart | 0.37% | 0.13%(+0.236)#56 | 0.28%(+0.089)#4,459 |
| 57. | Fowler | 0.36% | 0.13%(+0.230)#57 | 0.28%(+0.083)#4,523 |
| 58. | Lynn | 0.36% | 0.13%(+0.225)#58 | 0.28%(+0.078)#4,583 |
| 59. | Rensselaer | 0.36% | 0.13%(+0.224)#59 | 0.28%(+0.077)#4,592 |
| 60. | Hamilton | 0.35% | 0.13%(+0.222)#60 | 0.28%(+0.075)#4,627 |
| 61. | New Market | 0.35% | 0.13%(+0.220)#61 | 0.28%(+0.073)#4,650 |
| 62. | Cumberland | 0.35% | 0.13%(+0.218)#62 | 0.28%(+0.071)#4,664 |
| 63. | Crawfordsville | 0.35% | 0.13%(+0.217)#63 | 0.28%(+0.070)#4,677 |
| 64. | Beverly Shores | 0.35% | 0.13%(+0.214)#64 | 0.28%(+0.067)#4,706 |
| 65. | Kewanna | 0.34% | 0.13%(+0.208)#65 | 0.28%(+0.061)#4,769 |
| 66. | Warren Park | 0.34% | 0.13%(+0.207)#66 | 0.28%(+0.060)#4,793 |
| 67. | Long Beach | 0.34% | 0.13%(+0.205)#67 | 0.28%(+0.059)#4,804 |
| 68. | New Pekin | 0.33% | 0.13%(+0.194)#68 | 0.28%(+0.048)#4,909 |
| 69. | Holland | 0.33% | 0.13%(+0.194)#69 | 0.28%(+0.048)#4,910 |
| 70. | Rocky Ripple | 0.33% | 0.13%(+0.193)#70 | 0.28%(+0.046)#4,921 |
| 71. | Culver | 0.33% | 0.13%(+0.193)#71 | 0.28%(+0.046)#4,928 |
| 72. | Williamsport | 0.32% | 0.13%(+0.192)#72 | 0.28%(+0.046)#4,930 |
| 73. | Whitestown | 0.32% | 0.13%(+0.189)#73 | 0.28%(+0.043)#4,964 |
| 74. | Borden | 0.31% | 0.13%(+0.181)#74 | 0.28%(+0.034)#5,061 |
| 75. | Knox | 0.31% | 0.13%(+0.180)#75 | 0.28%(+0.033)#5,083 |
| 76. | Munster | 0.31% | 0.13%(+0.179)#76 | 0.28%(+0.033)#5,085 |
| 77. | Martinsville | 0.31% | 0.13%(+0.178)#77 | 0.28%(+0.031)#5,105 |
| 78. | Floyds Knobs | 0.31% | 0.13%(+0.174)#78 | 0.28%(+0.027)#5,153 |
| 79. | Ossian | 0.30% | 0.13%(+0.167)#79 | 0.28%(+0.020)#5,229 |
| 80. | Trail Creek | 0.30% | 0.13%(+0.165)#80 | 0.28%(+0.018)#5,259 |
| 81. | Hidden Valley | 0.29% | 0.13%(+0.155)#81 | 0.28%(+0.008)#5,387 |
| 82. | New Palestine | 0.28% | 0.13%(+0.150)#82 | 0.28%(+0.003)#5,441 |
| 83. | West Lafayette | 0.28% | 0.13%(+0.148)#83 | 0.28%(+0.002)#5,466 |
| 84. | Dyer | 0.28% | 0.13%(+0.148)#84 | 0.28%(+0.001)#5,474 |
| 85. | Kendallville | 0.28% | 0.13%(+0.143)#85 | 0.28%(-0.004)#5,536 |
| 86. | Greencastle | 0.27% | 0.13%(+0.141)#86 | 0.28%(-0.006)#5,555 |
| 87. | Brazil | 0.27% | 0.13%(+0.139)#87 | 0.28%(-0.008)#5,598 |
| 88. | Plymouth | 0.27% | 0.13%(+0.138)#88 | 0.28%(-0.009)#5,609 |
| 89. | Clay City | 0.26% | 0.13%(+0.132)#89 | 0.28%(-0.015)#5,681 |
| 90. | Seymour | 0.26% | 0.13%(+0.130)#90 | 0.28%(-0.017)#5,717 |
| 91. | Avilla | 0.26% | 0.13%(+0.127)#91 | 0.28%(-0.020)#5,755 |
| 92. | West Lebanon | 0.26% | 0.13%(+0.126)#92 | 0.28%(-0.021)#5,760 |
| 93. | Logansport | 0.26% | 0.13%(+0.126)#93 | 0.28%(-0.021)#5,762 |
| 94. | Medaryville | 0.26% | 0.13%(+0.124)#94 | 0.28%(-0.023)#5,797 |
| 95. | Terre Haute | 0.25% | 0.13%(+0.120)#95 | 0.28%(-0.027)#5,855 |
| 96. | Michigan City | 0.25% | 0.13%(+0.118)#96 | 0.28%(-0.029)#5,888 |
| 97. | Elkhart | 0.25% | 0.13%(+0.117)#97 | 0.28%(-0.030)#5,897 |
| 98. | New Richmond | 0.25% | 0.13%(+0.113)#98 | 0.28%(-0.034)#5,950 |
| 99. | North Judson | 0.24% | 0.13%(+0.106)#99 | 0.28%(-0.041)#6,051 |
| 100. | Goshen | 0.23% | 0.13%(+0.101)#100 | 0.28%(-0.046)#6,117 |
Common Questions
What are the Top 10 Cities with the Highest Percentage of Immigrants from Western Europe in Indiana?
Top 10 Cities with the Highest Percentage of Immigrants from Western Europe in Indiana are:
#1
9.72%
#2
4.93%
#3
2.70%
#4
2.26%
#5
1.94%
#6
1.90%
#7
1.83%
#8
1.63%
#9
1.41%
#10
1.34%
What city has the Highest Percentage of Immigrants from Western Europe in Indiana?
Spring Hill has the Highest Percentage of Immigrants from Western Europe in Indiana with 9.72%.
What is the Percentage of Immigrants from Western Europe in the State of Indiana?
Percentage of Immigrants from Western Europe in Indiana is 0.13%.
What is the Percentage of Immigrants from Western Europe in the United States?
Percentage of Immigrants from Western Europe in the United States is 0.28%.