Cities with the Highest Percentage of Immigrants from Western Europe in Delaware

RELATED REPORTS & OPTIONS

Western Europe
Population
Families and Households
Female Fertility
Female Fertility (Unmarried)
Race (Community Size)
Race (Percentage)
Ancestry (Community Size)
AfghanAfricanAlaska NativeAlaskan AthabascanAlbanianAleutAlsatianAmericanApacheArabArapahoArgentineanArmenianAssyrian / Chaldean / SyriacAustralianAustrianBahamianBangladeshiBarbadianBasqueBelgianBelizeanBermudanBhutaneseBlackfeetBolivianBrazilianBritishBritish West IndianBulgarianBurmeseCajunCambodianCanadianCape VerdeanCarpatho RusynCelticCentral AmericanCentral American IndianCherokeeCheyenneChickasawChileanChineseChippewaChoctawColombianColvilleComancheCosta RicanCreeCreekCroatianCrowCubanCypriotCzechCzechoslovakianDanishDelawareDominicanDutchDutch West IndianEastern EuropeanEcuadorianEgyptianEnglishEstonianEthiopianEuropeanFijianFilipinoFinnishFrenchFrench American IndianFrench CanadianGermanGerman RussianGhanaianGreekGuamanian / ChamorroGuatemalanGuyaneseHaitianHmongHonduranHopiHoumaHungarianIcelanderIndian (Asian)IndonesianInupiatIranianIraqiIrishIroquoisIsraeliItalianJamaicanJapaneseJordanianKenyanKiowaKoreanLaotianLatvianLebaneseLiberianLithuanianLumbeeLuxembourgerMacedonianMalaysianMalteseMarshalleseMenomineeMexicanMexican American IndianMongolianMoroccanNative HawaiianNavajoNepaleseNew ZealanderNicaraguanNigerianNorthern EuropeanNorwegianOkinawanOsageOttawaPaiutePakistaniPalestinianPanamanianParaguayanPennsylvania GermanPeruvianPimaPolishPortuguesePotawatomiPuebloPuerto RicanPuget Sound SalishRomanianRussianSalvadoranSamoanScandinavianScotch-IrishScottishSeminoleSenegaleseSerbianShoshoneSierra LeoneanSiouxSlavicSlovakSloveneSomaliSouth AfricanSouth AmericanSouth American IndianSoviet UnionSpaniardSpanishSpanish AmericanSpanish American IndianSri LankanSubsaharan AfricanSudaneseSwedishSwissSyrianTaiwaneseThaiTlingit-HaidaTohono O'OdhamTonganTrinidadian and TobagonianTsimshianTurkishU.S. Virgin IslanderUgandanUkrainianUruguayanUteVenezuelanVietnameseWelshWest IndianYakamaYaquiYugoslavianYumanYup'ikZimbabwean
Ancestry (Percentage)
AfghanAfricanAlaska NativeAlaskan AthabascanAlbanianAleutAlsatianAmericanApacheArabArapahoArgentineanArmenianAssyrian / Chaldean / SyriacAustralianAustrianBahamianBangladeshiBarbadianBasqueBelgianBelizeanBermudanBhutaneseBlackfeetBolivianBrazilianBritishBritish West IndianBulgarianBurmeseCajunCambodianCanadianCape VerdeanCarpatho RusynCelticCentral AmericanCentral American IndianCherokeeCheyenneChickasawChileanChineseChippewaChoctawColombianColvilleComancheCosta RicanCreeCreekCroatianCrowCubanCypriotCzechCzechoslovakianDanishDelawareDominicanDutchDutch West IndianEastern EuropeanEcuadorianEgyptianEnglishEstonianEthiopianEuropeanFijianFilipinoFinnishFrenchFrench American IndianFrench CanadianGermanGerman RussianGhanaianGreekGuamanian / ChamorroGuatemalanGuyaneseHaitianHmongHonduranHopiHoumaHungarianIcelanderIndian (Asian)IndonesianInupiatIranianIraqiIrishIroquoisIsraeliItalianJamaicanJapaneseJordanianKenyanKiowaKoreanLaotianLatvianLebaneseLiberianLithuanianLumbeeLuxembourgerMacedonianMalaysianMalteseMarshalleseMenomineeMexicanMexican American IndianMongolianMoroccanNative HawaiianNavajoNepaleseNew ZealanderNicaraguanNigerianNorthern EuropeanNorwegianOkinawanOsageOttawaPaiutePakistaniPalestinianPanamanianParaguayanPennsylvania GermanPeruvianPimaPolishPortuguesePotawatomiPuebloPuerto RicanPuget Sound SalishRomanianRussianSalvadoranSamoanScandinavianScotch-IrishScottishSeminoleSenegaleseSerbianShoshoneSierra LeoneanSiouxSlavicSlovakSloveneSomaliSouth AfricanSouth AmericanSouth American IndianSoviet UnionSpaniardSpanishSpanish AmericanSpanish American IndianSri LankanSubsaharan AfricanSudaneseSwedishSwissSyrianTaiwaneseThaiTlingit-HaidaTohono O'OdhamTonganTrinidadian and TobagonianTsimshianTurkishU.S. Virgin IslanderUgandanUkrainianUruguayanUteVenezuelanVietnameseWelshWest IndianYakamaYaquiYugoslavianYumanYup'ikZimbabwean
Immigrant Origin (Total)
AfghanistanAfricaAlbaniaArgentinaArmeniaAsiaAustraliaAustriaAzoresBahamasBangladeshBarbadosBelarusBelgiumBelizeBoliviaBosnia and HerzegovinaBrazilBulgariaBurma / MyanmarCabo VerdeCambodiaCameroonCanadaCaribbeanCentral AmericaChileChinaColombiaCongoCosta RicaCroatiaCubaCzechoslovakiaDenmarkDominicaDominican RepublicEastern AfricaEastern AsiaEastern EuropeEcuadorEgyptEl SalvadorEnglandEritreaEthiopiaEuropeFijiFranceGermanyGhanaGreeceGrenadaGuatemalaGuyanaHaitiHondurasHong KongHungaryIndiaIndonesiaIranIraqIrelandIsraelItalyJamaicaJapanJordanKazakhstanKenyaKoreaKuwaitLaosLatin AmericaLatviaLebanonLiberiaLithuaniaMalaysiaMexicoMicronesiaMiddle AfricaMoldovaMoroccoNepalNetherlandsNicaraguaNigeriaNorth MacedoniaNorthern AfricaNorthern EuropeNorwayOceaniaPakistanPanamaPeruPhilippinesPolandPortugalRomaniaRussiaSaudi ArabiaScotlandSenegalSerbiaSierra LeoneSingaporeSomaliaSouth AfricaSouth AmericaSouth Central AsiaSouth Eastern AsiaSouthern EuropeSpainSri LankaSt. Vincent and the GrenadinesSudanSwedenSwitzerlandSyriaTaiwanThailandTrinidad and TobagoTurkeyUgandaUkraineUruguayUzbekistanVenezuelaVietnamWest IndiesWestern AfricaWestern AsiaWestern EuropeYemenZaireZimbabwe
Immigrant Origin (Percentage)
AfghanistanAfricaAlbaniaArgentinaArmeniaAsiaAustraliaAustriaAzoresBahamasBangladeshBarbadosBelarusBelgiumBelizeBoliviaBosnia and HerzegovinaBrazilBulgariaBurma / MyanmarCabo VerdeCambodiaCameroonCanadaCaribbeanCentral AmericaChileChinaColombiaCongoCosta RicaCroatiaCubaCzechoslovakiaDenmarkDominicaDominican RepublicEastern AfricaEastern AsiaEastern EuropeEcuadorEgyptEl SalvadorEnglandEritreaEthiopiaEuropeFijiFranceGermanyGhanaGreeceGrenadaGuatemalaGuyanaHaitiHondurasHong KongHungaryIndiaIndonesiaIranIraqIrelandIsraelItalyJamaicaJapanJordanKazakhstanKenyaKoreaKuwaitLaosLatin AmericaLatviaLebanonLiberiaLithuaniaMalaysiaMexicoMicronesiaMiddle AfricaMoldovaMoroccoNepalNetherlandsNicaraguaNigeriaNorth MacedoniaNorthern AfricaNorthern EuropeNorwayOceaniaPakistanPanamaPeruPhilippinesPolandPortugalRomaniaRussiaSaudi ArabiaScotlandSenegalSerbiaSierra LeoneSingaporeSomaliaSouth AfricaSouth AmericaSouth Central AsiaSouth Eastern AsiaSouthern EuropeSpainSri LankaSt. Vincent and the GrenadinesSudanSwedenSwitzerlandSyriaTaiwanThailandTrinidad and TobagoTurkeyUgandaUkraineUruguayUzbekistanVenezuelaVietnamWest IndiesWestern AfricaWestern AsiaWestern EuropeYemenZaireZimbabwe
Income
Income (Families)
Income (Households)
Poverty
Poverty (Families)
Unemployment
Employment Occupations
Employment Industries
Employer Class
Commute Time
Commute Means
School Enrollment
Education by Degree Field
Occupancy
Finances
Physical Characteristics
Delaware
Compare Cities
Comparison Subject

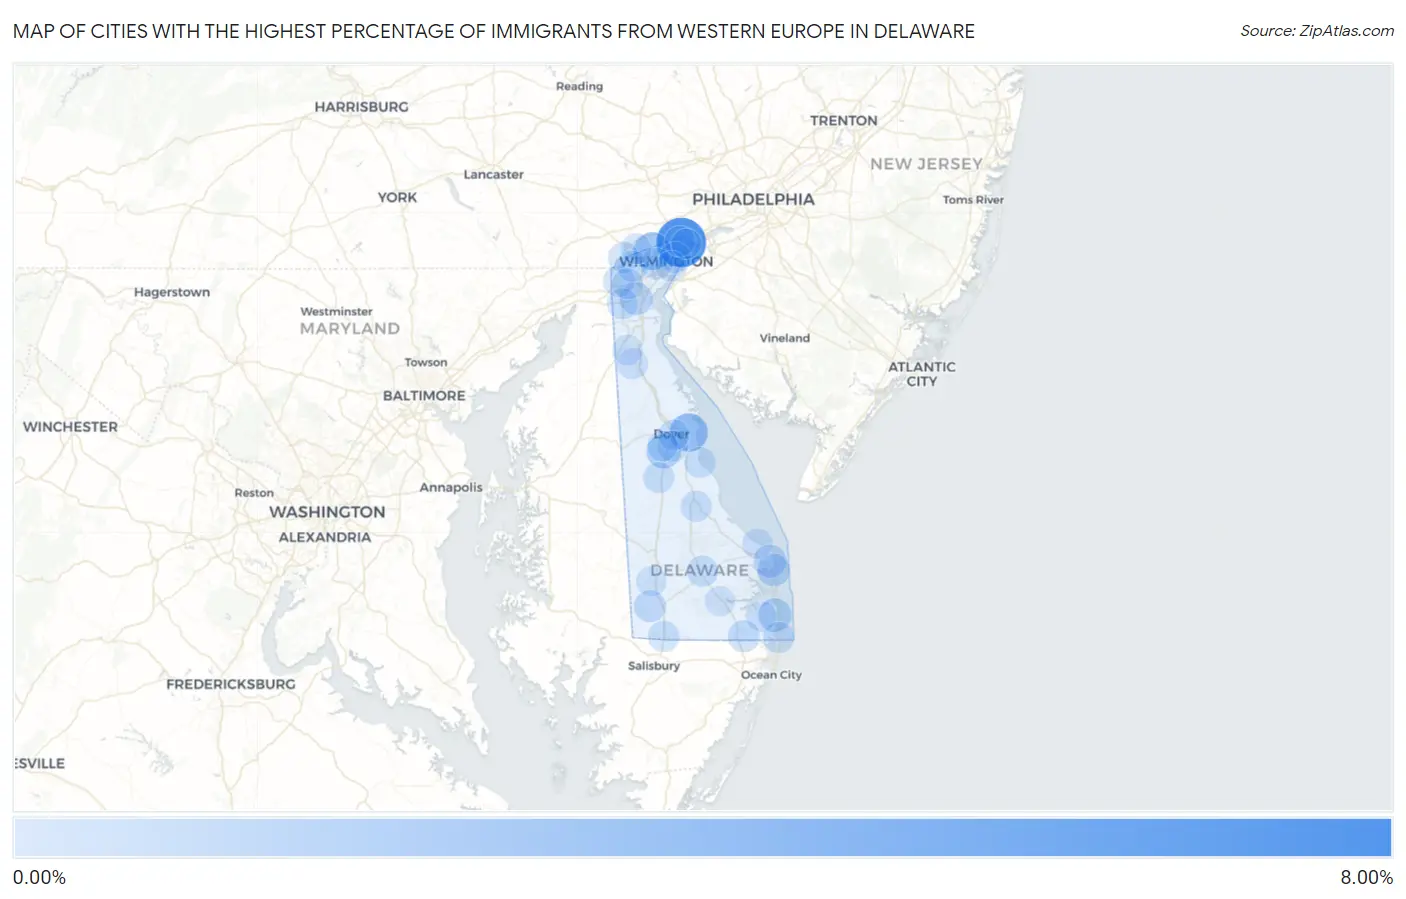
Map of Cities with the Highest Percentage of Immigrants from Western Europe in Delaware

0.00%
8.00%
Cities with the Highest Percentage of Immigrants from Western Europe in Delaware Map

Cities with the Highest Percentage of Immigrants from Western Europe in Delaware

City Western Europe vs State vs National
1.Ardentown6.28%0.23%(+6.04)#10.28%(+6.00)#83
2.Little Creek2.57%0.23%(+2.34)#20.28%(+2.29)#339
3.Greenville2.44%0.23%(+2.21)#30.28%(+2.16)#365
4.Camden1.38%0.23%(+1.15)#40.28%(+1.10)#895
5.Bethany Beach1.03%0.23%(+0.800)#50.28%(+0.755)#1,366
6.Rehoboth Beach0.88%0.23%(+0.650)#60.28%(+0.605)#1,705
7.Bear0.88%0.23%(+0.646)#70.28%(+0.601)#1,714
8.Dewey Beach0.84%0.23%(+0.602)#80.28%(+0.556)#1,825
9.Bethel0.53%0.23%(+0.298)#90.28%(+0.253)#3,115
10.Selbyville0.52%0.23%(+0.282)#100.28%(+0.237)#3,211
11.Elsmere0.42%0.23%(+0.186)#110.28%(+0.140)#3,927
12.Georgetown0.32%0.23%(+0.083)#120.28%(+0.038)#5,018
13.Newark0.32%0.23%(+0.082)#130.28%(+0.037)#5,024
14.North Star0.31%0.23%(+0.077)#140.28%(+0.031)#5,100
15.Highland Acres0.31%0.23%(+0.074)#150.28%(+0.029)#5,132
16.Bowers0.30%0.23%(+0.064)#160.28%(+0.018)#5,254
17.Edgemoor0.29%0.23%(+0.059)#170.28%(+0.014)#5,318
18.Delmar0.29%0.23%(+0.058)#180.28%(+0.013)#5,336
19.Milford0.29%0.23%(+0.056)#190.28%(+0.011)#5,356
20.Fenwick Island0.29%0.23%(+0.052)#200.28%(+0.006)#5,411
21.Glasgow0.28%0.23%(+0.045)#210.28%(-0.000)#5,493
22.Felton0.26%0.23%(+0.030)#220.28%(-0.015)#5,685
23.Pike Creek Valley0.26%0.23%(+0.028)#230.28%(-0.017)#5,718
24.Millville0.24%0.23%(+0.010)#240.28%(-0.036)#5,972
25.Dover0.23%0.23%(+0.000)#250.28%(-0.045)#6,108
26.Brookside0.23%0.23%(-0.004)#260.28%(-0.049)#6,169
27.Townsend0.22%0.23%(-0.014)#270.28%(-0.059)#6,328
28.Wilmington0.21%0.23%(-0.023)#280.28%(-0.068)#6,462
29.Hockessin0.21%0.23%(-0.025)#290.28%(-0.070)#6,511
30.Wyoming0.16%0.23%(-0.075)#300.28%(-0.120)#7,329
31.Arden0.15%0.23%(-0.081)#310.28%(-0.126)#7,418
32.Middletown0.13%0.23%(-0.107)#320.28%(-0.152)#7,881
33.Lewes0.12%0.23%(-0.114)#330.28%(-0.159)#8,002
34.Seaford0.074%0.23%(-0.160)#340.28%(-0.205)#8,725
35.Millsboro0.029%0.23%(-0.205)#350.28%(-0.250)#9,227
36.Claymont0.0098%0.23%(-0.224)#360.28%(-0.269)#9,344

Common Questions

What are the Top 10 Cities with the Highest Percentage of Immigrants from Western Europe in Delaware?
Top 10 Cities with the Highest Percentage of Immigrants from Western Europe in Delaware are:
#1
6.28%
#2
2.57%
#3
2.44%
#4
1.38%
#5
1.03%
#6
0.88%
#7
0.88%
#8
0.84%
#9
0.53%
#10
0.52%
What city has the Highest Percentage of Immigrants from Western Europe in Delaware?
Ardentown has the Highest Percentage of Immigrants from Western Europe in Delaware with 6.28%.
What is the Percentage of Immigrants from Western Europe in the State of Delaware?
Percentage of Immigrants from Western Europe in Delaware is 0.23%.
What is the Percentage of Immigrants from Western Europe in the United States?
Percentage of Immigrants from Western Europe in the United States is 0.28%.