Cities with the Highest Percentage of Immigrants from Western Europe in Illinois
RELATED REPORTS & OPTIONS
Western Europe
Illinois
Compare Cities
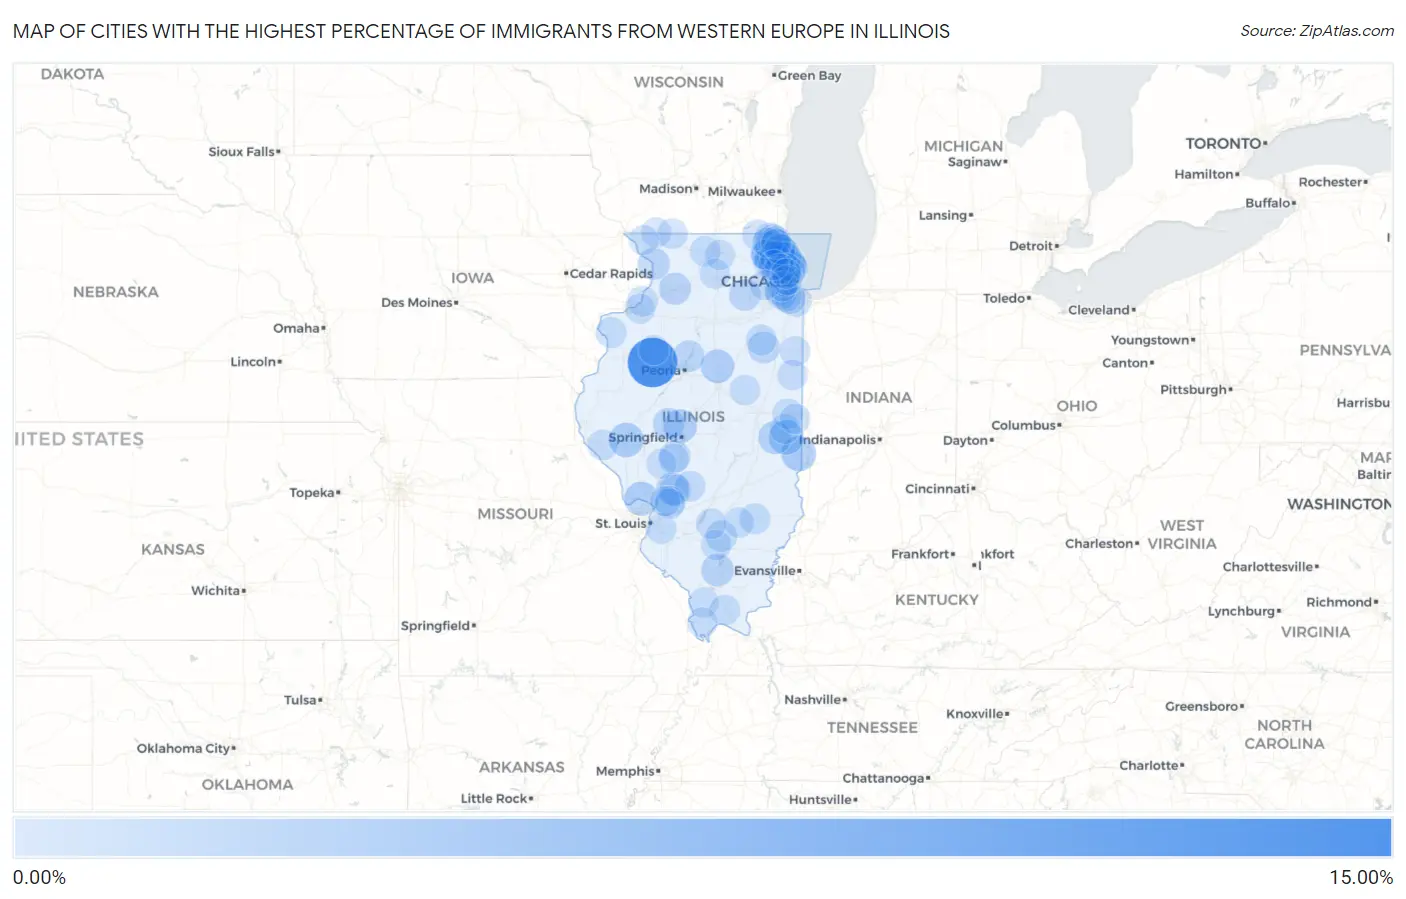
Map of Cities with the Highest Percentage of Immigrants from Western Europe in Illinois
0.00%
15.00%
Cities with the Highest Percentage of Immigrants from Western Europe in Illinois
| City | Western Europe | vs State | vs National | |
| 1. | Maquon | 14.36% | 0.24%(+14.1)#1 | 0.28%(+14.1)#19 |
| 2. | Hartland | 7.69% | 0.24%(+7.45)#2 | 0.28%(+7.41)#61 |
| 3. | Vermilion | 3.55% | 0.24%(+3.31)#3 | 0.28%(+3.27)#194 |
| 4. | Metcalf | 3.47% | 0.24%(+3.22)#4 | 0.28%(+3.19)#204 |
| 5. | Naples | 3.45% | 0.24%(+3.21)#5 | 0.28%(+3.17)#207 |
| 6. | Elsah | 3.18% | 0.24%(+2.94)#6 | 0.28%(+2.90)#232 |
| 7. | Mettawa | 3.16% | 0.24%(+2.92)#7 | 0.28%(+2.88)#237 |
| 8. | Cantrall | 2.88% | 0.24%(+2.64)#8 | 0.28%(+2.60)#271 |
| 9. | El Paso | 2.80% | 0.24%(+2.56)#9 | 0.28%(+2.52)#286 |
| 10. | Newman | 2.56% | 0.24%(+2.32)#10 | 0.28%(+2.28)#341 |
| 11. | Gulfport | 2.47% | 0.24%(+2.23)#11 | 0.28%(+2.19)#358 |
| 12. | Argyle | 2.43% | 0.24%(+2.19)#12 | 0.28%(+2.15)#367 |
| 13. | Buckner | 2.14% | 0.24%(+1.90)#13 | 0.28%(+1.86)#458 |
| 14. | Benld | 2.09% | 0.24%(+1.85)#14 | 0.28%(+1.81)#476 |
| 15. | Willow Springs | 2.01% | 0.24%(+1.77)#15 | 0.28%(+1.73)#513 |
| 16. | Savanna | 1.83% | 0.24%(+1.59)#16 | 0.28%(+1.55)#590 |
| 17. | Como | 1.83% | 0.24%(+1.59)#17 | 0.28%(+1.55)#592 |
| 18. | Round Lake Park | 1.68% | 0.24%(+1.44)#18 | 0.28%(+1.40)#666 |
| 19. | Cabery | 1.65% | 0.24%(+1.41)#19 | 0.28%(+1.37)#686 |
| 20. | Lake Villa | 1.61% | 0.24%(+1.37)#20 | 0.28%(+1.33)#718 |
| 21. | Plano | 1.59% | 0.24%(+1.35)#21 | 0.28%(+1.31)#731 |
| 22. | Lake Petersburg | 1.57% | 0.24%(+1.33)#22 | 0.28%(+1.29)#748 |
| 23. | Rome | 1.56% | 0.24%(+1.32)#23 | 0.28%(+1.28)#756 |
| 24. | Tower Lakes | 1.48% | 0.24%(+1.24)#24 | 0.28%(+1.20)#806 |
| 25. | White City | 1.33% | 0.24%(+1.09)#25 | 0.28%(+1.05)#952 |
| 26. | Bannockburn | 1.31% | 0.24%(+1.07)#26 | 0.28%(+1.04)#964 |
| 27. | Westlake | 1.31% | 0.24%(+1.07)#27 | 0.28%(+1.03)#965 |
| 28. | Dix | 1.29% | 0.24%(+1.05)#28 | 0.28%(+1.01)#994 |
| 29. | Thayer | 1.27% | 0.24%(+1.02)#29 | 0.28%(+0.987)#1,022 |
| 30. | Venetian Village | 1.25% | 0.24%(+1.01)#30 | 0.28%(+0.969)#1,037 |
| 31. | Glencoe | 1.16% | 0.24%(+0.920)#31 | 0.28%(+0.882)#1,160 |
| 32. | Deer Park | 1.14% | 0.24%(+0.896)#32 | 0.28%(+0.858)#1,189 |
| 33. | Northfield | 1.10% | 0.24%(+0.863)#33 | 0.28%(+0.825)#1,238 |
| 34. | Joy | 1.07% | 0.24%(+0.828)#34 | 0.28%(+0.790)#1,292 |
| 35. | North Barrington | 1.06% | 0.24%(+0.817)#35 | 0.28%(+0.779)#1,311 |
| 36. | Burr Ridge | 1.04% | 0.24%(+0.801)#36 | 0.28%(+0.763)#1,346 |
| 37. | Clay City | 1.02% | 0.24%(+0.778)#37 | 0.28%(+0.740)#1,393 |
| 38. | Phoenix | 1.02% | 0.24%(+0.776)#38 | 0.28%(+0.738)#1,397 |
| 39. | Palos Heights | 1.01% | 0.24%(+0.770)#39 | 0.28%(+0.732)#1,409 |
| 40. | Reddick | 1.00% | 0.24%(+0.759)#40 | 0.28%(+0.721)#1,434 |
| 41. | Wilmette | 1.00% | 0.24%(+0.759)#41 | 0.28%(+0.721)#1,435 |
| 42. | Lake Zurich | 0.99% | 0.24%(+0.746)#42 | 0.28%(+0.708)#1,452 |
| 43. | Kenilworth | 0.99% | 0.24%(+0.744)#43 | 0.28%(+0.706)#1,459 |
| 44. | Crestwood | 0.95% | 0.24%(+0.709)#44 | 0.28%(+0.671)#1,529 |
| 45. | Evanston | 0.95% | 0.24%(+0.705)#45 | 0.28%(+0.667)#1,541 |
| 46. | Kildeer | 0.92% | 0.24%(+0.678)#46 | 0.28%(+0.640)#1,603 |
| 47. | Lincolnwood | 0.91% | 0.24%(+0.671)#47 | 0.28%(+0.633)#1,624 |
| 48. | Taylor Springs | 0.90% | 0.24%(+0.664)#48 | 0.28%(+0.626)#1,642 |
| 49. | Richmond | 0.79% | 0.24%(+0.553)#49 | 0.28%(+0.515)#1,945 |
| 50. | Knollwood | 0.79% | 0.24%(+0.553)#50 | 0.28%(+0.515)#1,946 |
| 51. | Port Byron | 0.79% | 0.24%(+0.547)#51 | 0.28%(+0.509)#1,963 |
| 52. | Lincolnshire | 0.78% | 0.24%(+0.543)#52 | 0.28%(+0.505)#1,973 |
| 53. | Barry | 0.78% | 0.24%(+0.543)#53 | 0.28%(+0.505)#1,976 |
| 54. | Lake Barrington | 0.78% | 0.24%(+0.540)#54 | 0.28%(+0.502)#1,984 |
| 55. | Inverness | 0.78% | 0.24%(+0.536)#55 | 0.28%(+0.498)#1,999 |
| 56. | Vienna | 0.78% | 0.24%(+0.535)#56 | 0.28%(+0.497)#2,004 |
| 57. | Riverwoods | 0.77% | 0.24%(+0.533)#57 | 0.28%(+0.494)#2,008 |
| 58. | Wood Dale | 0.77% | 0.24%(+0.529)#58 | 0.28%(+0.490)#2,023 |
| 59. | Lake Forest | 0.77% | 0.24%(+0.526)#59 | 0.28%(+0.487)#2,033 |
| 60. | Winnebago | 0.77% | 0.24%(+0.525)#60 | 0.28%(+0.487)#2,037 |
| 61. | Third Lake | 0.74% | 0.24%(+0.500)#61 | 0.28%(+0.462)#2,113 |
| 62. | Oakwood | 0.74% | 0.24%(+0.500)#62 | 0.28%(+0.461)#2,116 |
| 63. | Swansea | 0.73% | 0.24%(+0.484)#63 | 0.28%(+0.446)#2,183 |
| 64. | Arbury Hills | 0.70% | 0.24%(+0.456)#64 | 0.28%(+0.418)#2,269 |
| 65. | Worden | 0.69% | 0.24%(+0.445)#65 | 0.28%(+0.406)#2,311 |
| 66. | Highland Park | 0.68% | 0.24%(+0.441)#66 | 0.28%(+0.403)#2,327 |
| 67. | Saybrook | 0.68% | 0.24%(+0.440)#67 | 0.28%(+0.402)#2,331 |
| 68. | Long Grove | 0.68% | 0.24%(+0.435)#68 | 0.28%(+0.397)#2,349 |
| 69. | Grandwood Park | 0.67% | 0.24%(+0.427)#69 | 0.28%(+0.389)#2,391 |
| 70. | Niles | 0.66% | 0.24%(+0.418)#70 | 0.28%(+0.380)#2,425 |
| 71. | Hillcrest | 0.65% | 0.24%(+0.408)#71 | 0.28%(+0.370)#2,471 |
| 72. | Milford | 0.64% | 0.24%(+0.401)#72 | 0.28%(+0.363)#2,514 |
| 73. | Hamel | 0.63% | 0.24%(+0.392)#73 | 0.28%(+0.354)#2,565 |
| 74. | Woodlawn | 0.63% | 0.24%(+0.389)#74 | 0.28%(+0.351)#2,580 |
| 75. | Winslow | 0.62% | 0.24%(+0.380)#75 | 0.28%(+0.342)#2,624 |
| 76. | Xenia | 0.62% | 0.24%(+0.378)#76 | 0.28%(+0.340)#2,633 |
| 77. | Long Lake | 0.61% | 0.24%(+0.371)#77 | 0.28%(+0.333)#2,678 |
| 78. | Sidell | 0.61% | 0.24%(+0.371)#78 | 0.28%(+0.333)#2,683 |
| 79. | Sandoval | 0.61% | 0.24%(+0.370)#79 | 0.28%(+0.332)#2,689 |
| 80. | Green Oaks | 0.61% | 0.24%(+0.369)#80 | 0.28%(+0.331)#2,693 |
| 81. | Westville | 0.61% | 0.24%(+0.364)#81 | 0.28%(+0.326)#2,730 |
| 82. | Gages Lake | 0.60% | 0.24%(+0.355)#82 | 0.28%(+0.317)#2,770 |
| 83. | Oak Run | 0.59% | 0.24%(+0.353)#83 | 0.28%(+0.315)#2,773 |
| 84. | Cobden | 0.59% | 0.24%(+0.345)#84 | 0.28%(+0.307)#2,813 |
| 85. | Forest Park | 0.59% | 0.24%(+0.345)#85 | 0.28%(+0.307)#2,816 |
| 86. | La Grange | 0.58% | 0.24%(+0.342)#86 | 0.28%(+0.304)#2,834 |
| 87. | Beaverville | 0.58% | 0.24%(+0.337)#87 | 0.28%(+0.299)#2,854 |
| 88. | Cherry Valley | 0.58% | 0.24%(+0.335)#88 | 0.28%(+0.297)#2,861 |
| 89. | Apple River | 0.57% | 0.24%(+0.330)#89 | 0.28%(+0.292)#2,889 |
| 90. | Des Plaines | 0.57% | 0.24%(+0.330)#90 | 0.28%(+0.292)#2,891 |
| 91. | East Moline | 0.57% | 0.24%(+0.327)#91 | 0.28%(+0.289)#2,901 |
| 92. | Virden | 0.56% | 0.24%(+0.320)#92 | 0.28%(+0.282)#2,946 |
| 93. | Tamms | 0.56% | 0.24%(+0.320)#93 | 0.28%(+0.281)#2,949 |
| 94. | The Galena Territory | 0.56% | 0.24%(+0.319)#94 | 0.28%(+0.281)#2,953 |
| 95. | Palmyra | 0.56% | 0.24%(+0.319)#95 | 0.28%(+0.280)#2,955 |
| 96. | Oak Park | 0.55% | 0.24%(+0.313)#96 | 0.28%(+0.274)#2,982 |
| 97. | Holiday Shores | 0.55% | 0.24%(+0.307)#97 | 0.28%(+0.269)#3,014 |
| 98. | Rolling Meadows | 0.54% | 0.24%(+0.304)#98 | 0.28%(+0.265)#3,034 |
| 99. | Warrenville | 0.54% | 0.24%(+0.297)#99 | 0.28%(+0.259)#3,078 |
| 100. | Harwood Heights | 0.54% | 0.24%(+0.296)#100 | 0.28%(+0.258)#3,087 |
Common Questions
What are the Top 10 Cities with the Highest Percentage of Immigrants from Western Europe in Illinois?
Top 10 Cities with the Highest Percentage of Immigrants from Western Europe in Illinois are:
What city has the Highest Percentage of Immigrants from Western Europe in Illinois?
Maquon has the Highest Percentage of Immigrants from Western Europe in Illinois with 14.36%.
What is the Percentage of Immigrants from Western Europe in the State of Illinois?
Percentage of Immigrants from Western Europe in Illinois is 0.24%.
What is the Percentage of Immigrants from Western Europe in the United States?
Percentage of Immigrants from Western Europe in the United States is 0.28%.