Cities with the Highest Percentage of Immigrants from Western Europe in Oregon
RELATED REPORTS & OPTIONS
Western Europe
Oregon
Compare Cities
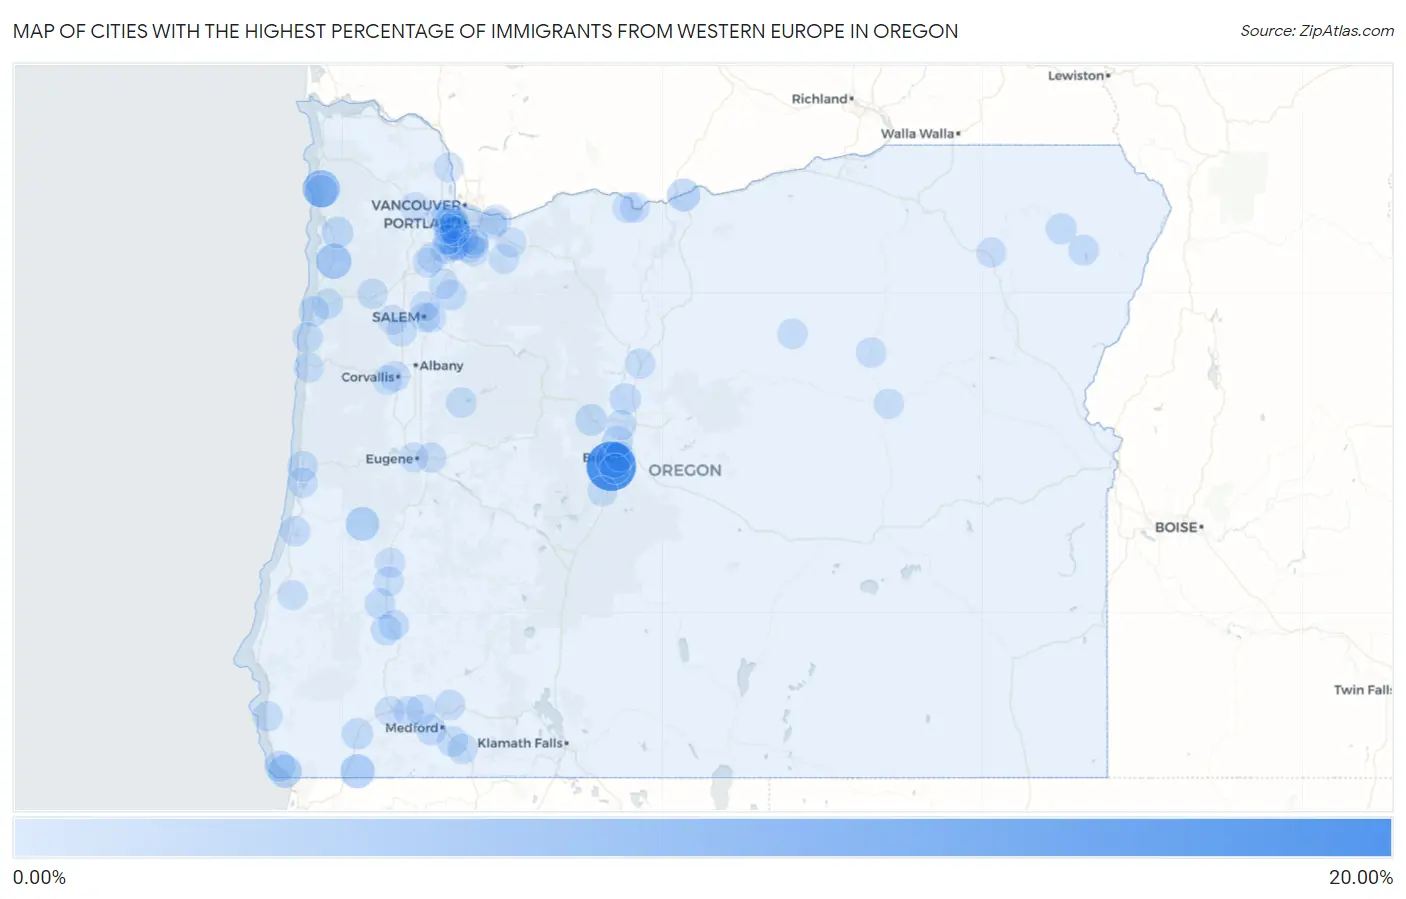
Map of Cities with the Highest Percentage of Immigrants from Western Europe in Oregon
0.00%
20.00%
Cities with the Highest Percentage of Immigrants from Western Europe in Oregon
| City | Western Europe | vs State | vs National | |
| 1. | Seventh Mountain | 18.00% | 0.35%(+17.7)#1 | 0.28%(+17.7)#14 |
| 2. | Neahkahnie | 6.62% | 0.35%(+6.27)#2 | 0.28%(+6.34)#75 |
| 3. | Tetherow | 5.31% | 0.35%(+4.96)#3 | 0.28%(+5.03)#111 |
| 4. | Beaver | 4.85% | 0.35%(+4.50)#4 | 0.28%(+4.58)#131 |
| 5. | Saunders Lake | 4.13% | 0.35%(+3.78)#5 | 0.28%(+3.85)#165 |
| 6. | Takilma | 3.79% | 0.35%(+3.44)#6 | 0.28%(+3.51)#177 |
| 7. | Elkton | 3.42% | 0.35%(+3.07)#7 | 0.28%(+3.15)#209 |
| 8. | Harbor | 2.95% | 0.35%(+2.60)#8 | 0.28%(+2.67)#267 |
| 9. | Rufus | 2.73% | 0.35%(+2.38)#9 | 0.28%(+2.45)#304 |
| 10. | Manzanita | 2.42% | 0.35%(+2.07)#10 | 0.28%(+2.14)#370 |
| 11. | Cedar Hills | 1.83% | 0.35%(+1.48)#11 | 0.28%(+1.55)#594 |
| 12. | Dexter | 1.78% | 0.35%(+1.43)#12 | 0.28%(+1.50)#617 |
| 13. | Sisters | 1.64% | 0.35%(+1.29)#13 | 0.28%(+1.36)#700 |
| 14. | Fairview | 1.41% | 0.35%(+1.06)#14 | 0.28%(+1.13)#859 |
| 15. | Selma | 1.35% | 0.35%(+0.995)#15 | 0.28%(+1.07)#929 |
| 16. | Brookings | 1.21% | 0.35%(+0.856)#16 | 0.28%(+0.926)#1,086 |
| 17. | Crooked River Ranch | 1.19% | 0.35%(+0.837)#17 | 0.28%(+0.908)#1,110 |
| 18. | Bethany | 1.11% | 0.35%(+0.757)#18 | 0.28%(+0.828)#1,231 |
| 19. | Lostine | 1.05% | 0.35%(+0.700)#19 | 0.28%(+0.771)#1,327 |
| 20. | Tumalo | 1.02% | 0.35%(+0.669)#20 | 0.28%(+0.740)#1,394 |
| 21. | Cedar Mill | 0.97% | 0.35%(+0.616)#21 | 0.28%(+0.687)#1,498 |
| 22. | Dunthorpe | 0.96% | 0.35%(+0.612)#22 | 0.28%(+0.683)#1,502 |
| 23. | Winston | 0.96% | 0.35%(+0.611)#23 | 0.28%(+0.682)#1,505 |
| 24. | Prineville Lake Acres | 0.95% | 0.35%(+0.598)#24 | 0.28%(+0.669)#1,534 |
| 25. | Raleigh Hills | 0.92% | 0.35%(+0.570)#25 | 0.28%(+0.641)#1,600 |
| 26. | West Slope | 0.92% | 0.35%(+0.566)#26 | 0.28%(+0.636)#1,614 |
| 27. | Riddle | 0.86% | 0.35%(+0.514)#27 | 0.28%(+0.585)#1,757 |
| 28. | Talent | 0.85% | 0.35%(+0.497)#28 | 0.28%(+0.568)#1,794 |
| 29. | Jacksonville | 0.83% | 0.35%(+0.481)#29 | 0.28%(+0.552)#1,834 |
| 30. | Rose Lodge | 0.80% | 0.35%(+0.455)#30 | 0.28%(+0.526)#1,912 |
| 31. | Mount Angel | 0.79% | 0.35%(+0.441)#31 | 0.28%(+0.512)#1,957 |
| 32. | Joseph | 0.76% | 0.35%(+0.413)#32 | 0.28%(+0.484)#2,043 |
| 33. | Ashland | 0.75% | 0.35%(+0.398)#33 | 0.28%(+0.468)#2,086 |
| 34. | Lake Oswego | 0.72% | 0.35%(+0.374)#34 | 0.28%(+0.445)#2,191 |
| 35. | Gold Hill | 0.71% | 0.35%(+0.364)#35 | 0.28%(+0.434)#2,225 |
| 36. | Sweet Home | 0.71% | 0.35%(+0.361)#36 | 0.28%(+0.431)#2,234 |
| 37. | Troutdale | 0.71% | 0.35%(+0.356)#37 | 0.28%(+0.427)#2,248 |
| 38. | Durham | 0.70% | 0.35%(+0.349)#38 | 0.28%(+0.420)#2,265 |
| 39. | Lincoln City | 0.69% | 0.35%(+0.345)#39 | 0.28%(+0.415)#2,278 |
| 40. | Corvallis | 0.68% | 0.35%(+0.333)#40 | 0.28%(+0.403)#2,324 |
| 41. | Florence | 0.67% | 0.35%(+0.321)#41 | 0.28%(+0.392)#2,369 |
| 42. | Mapleton | 0.67% | 0.35%(+0.318)#42 | 0.28%(+0.389)#2,389 |
| 43. | Tigard | 0.65% | 0.35%(+0.305)#43 | 0.28%(+0.375)#2,450 |
| 44. | Rogue River | 0.65% | 0.35%(+0.301)#44 | 0.28%(+0.372)#2,465 |
| 45. | Chenoweth | 0.64% | 0.35%(+0.291)#45 | 0.28%(+0.361)#2,524 |
| 46. | Eagle Point | 0.64% | 0.35%(+0.287)#46 | 0.28%(+0.358)#2,547 |
| 47. | Juniper Canyon | 0.63% | 0.35%(+0.282)#47 | 0.28%(+0.353)#2,569 |
| 48. | Depoe Bay | 0.63% | 0.35%(+0.279)#48 | 0.28%(+0.350)#2,584 |
| 49. | West Linn | 0.63% | 0.35%(+0.276)#49 | 0.28%(+0.346)#2,603 |
| 50. | River Road | 0.61% | 0.35%(+0.261)#50 | 0.28%(+0.332)#2,690 |
| 51. | Tri City | 0.60% | 0.35%(+0.254)#51 | 0.28%(+0.324)#2,740 |
| 52. | Sherwood | 0.58% | 0.35%(+0.232)#52 | 0.28%(+0.302)#2,840 |
| 53. | Willamina | 0.57% | 0.35%(+0.218)#53 | 0.28%(+0.289)#2,900 |
| 54. | Rivergrove | 0.54% | 0.35%(+0.188)#54 | 0.28%(+0.258)#3,082 |
| 55. | Long Creek | 0.53% | 0.35%(+0.176)#55 | 0.28%(+0.247)#3,146 |
| 56. | Oregon City | 0.52% | 0.35%(+0.169)#56 | 0.28%(+0.239)#3,198 |
| 57. | Monmouth | 0.52% | 0.35%(+0.166)#57 | 0.28%(+0.236)#3,215 |
| 58. | Gold Beach | 0.51% | 0.35%(+0.163)#58 | 0.28%(+0.234)#3,230 |
| 59. | Spray | 0.50% | 0.35%(+0.153)#59 | 0.28%(+0.223)#3,311 |
| 60. | Dunes City | 0.49% | 0.35%(+0.141)#60 | 0.28%(+0.211)#3,395 |
| 61. | Lakeside | 0.49% | 0.35%(+0.140)#61 | 0.28%(+0.210)#3,402 |
| 62. | Portland | 0.48% | 0.35%(+0.131)#62 | 0.28%(+0.202)#3,461 |
| 63. | Madras | 0.48% | 0.35%(+0.130)#63 | 0.28%(+0.201)#3,469 |
| 64. | Philomath | 0.44% | 0.35%(+0.092)#64 | 0.28%(+0.163)#3,749 |
| 65. | Tualatin | 0.42% | 0.35%(+0.071)#65 | 0.28%(+0.142)#3,918 |
| 66. | Woodburn | 0.41% | 0.35%(+0.062)#66 | 0.28%(+0.133)#3,999 |
| 67. | Bend | 0.40% | 0.35%(+0.049)#67 | 0.28%(+0.120)#4,122 |
| 68. | Three Rivers | 0.40% | 0.35%(+0.049)#68 | 0.28%(+0.119)#4,128 |
| 69. | Springfield | 0.40% | 0.35%(+0.049)#69 | 0.28%(+0.119)#4,132 |
| 70. | Eagle Crest | 0.39% | 0.35%(+0.040)#70 | 0.28%(+0.111)#4,226 |
| 71. | Estacada | 0.39% | 0.35%(+0.040)#71 | 0.28%(+0.110)#4,235 |
| 72. | The Dalles | 0.38% | 0.35%(+0.032)#72 | 0.28%(+0.102)#4,311 |
| 73. | Island City | 0.38% | 0.35%(+0.030)#73 | 0.28%(+0.100)#4,338 |
| 74. | Coquille | 0.37% | 0.35%(+0.024)#74 | 0.28%(+0.095)#4,397 |
| 75. | Dallas | 0.37% | 0.35%(+0.022)#75 | 0.28%(+0.093)#4,425 |
| 76. | Sandy | 0.37% | 0.35%(+0.015)#76 | 0.28%(+0.086)#4,487 |
| 77. | Rockcreek | 0.36% | 0.35%(+0.013)#77 | 0.28%(+0.084)#4,517 |
| 78. | Canyon City | 0.36% | 0.35%(+0.010)#78 | 0.28%(+0.080)#4,554 |
| 79. | Eugene | 0.36% | 0.35%(+0.009)#79 | 0.28%(+0.080)#4,559 |
| 80. | Newberg | 0.35% | 0.35%(+0.005)#80 | 0.28%(+0.075)#4,622 |
| 81. | Oatfield | 0.35% | 0.35%(+0.002)#81 | 0.28%(+0.073)#4,654 |
| 82. | West Haven Sylvan | 0.35% | 0.35%(-0.004)#82 | 0.28%(+0.067)#4,701 |
| 83. | Dundee | 0.34% | 0.35%(-0.009)#83 | 0.28%(+0.062)#4,766 |
| 84. | Four Corners | 0.34% | 0.35%(-0.010)#84 | 0.28%(+0.061)#4,772 |
| 85. | Deschutes River Woods | 0.34% | 0.35%(-0.010)#85 | 0.28%(+0.060)#4,779 |
| 86. | Newport | 0.34% | 0.35%(-0.011)#86 | 0.28%(+0.060)#4,789 |
| 87. | Santa Clara | 0.33% | 0.35%(-0.016)#87 | 0.28%(+0.055)#4,843 |
| 88. | Heceta Beach | 0.33% | 0.35%(-0.020)#88 | 0.28%(+0.051)#4,882 |
| 89. | Sutherlin | 0.33% | 0.35%(-0.021)#89 | 0.28%(+0.050)#4,888 |
| 90. | Roseburg North | 0.31% | 0.35%(-0.037)#90 | 0.28%(+0.033)#5,072 |
| 91. | Grants Pass | 0.30% | 0.35%(-0.048)#91 | 0.28%(+0.022)#5,198 |
| 92. | St Helens | 0.30% | 0.35%(-0.050)#92 | 0.28%(+0.020)#5,224 |
| 93. | Banks | 0.29% | 0.35%(-0.057)#93 | 0.28%(+0.014)#5,317 |
| 94. | Bull Mountain | 0.29% | 0.35%(-0.060)#94 | 0.28%(+0.010)#5,361 |
| 95. | Gladstone | 0.28% | 0.35%(-0.067)#95 | 0.28%(+0.004)#5,432 |
| 96. | Garden Home Whitford | 0.28% | 0.35%(-0.068)#96 | 0.28%(+0.003)#5,446 |
| 97. | Beaverton | 0.28% | 0.35%(-0.071)#97 | 0.28%(-0.000)#5,496 |
| 98. | Salem | 0.28% | 0.35%(-0.072)#98 | 0.28%(-0.002)#5,513 |
| 99. | Gresham | 0.26% | 0.35%(-0.091)#99 | 0.28%(-0.020)#5,757 |
| 100. | Keizer | 0.26% | 0.35%(-0.094)#100 | 0.28%(-0.024)#5,805 |
Common Questions
What are the Top 10 Cities with the Highest Percentage of Immigrants from Western Europe in Oregon?
Top 10 Cities with the Highest Percentage of Immigrants from Western Europe in Oregon are:
#1
18.00%
#2
6.62%
#3
5.31%
#4
4.85%
#5
3.79%
#6
3.42%
#7
2.95%
#8
2.73%
#9
2.42%
#10
1.83%
What city has the Highest Percentage of Immigrants from Western Europe in Oregon?
Seventh Mountain has the Highest Percentage of Immigrants from Western Europe in Oregon with 18.00%.
What is the Percentage of Immigrants from Western Europe in the State of Oregon?
Percentage of Immigrants from Western Europe in Oregon is 0.35%.
What is the Percentage of Immigrants from Western Europe in the United States?
Percentage of Immigrants from Western Europe in the United States is 0.28%.