Cities with the Highest Percentage of Immigrants from Western Europe in Virginia
RELATED REPORTS & OPTIONS
Western Europe
Virginia
Compare Cities
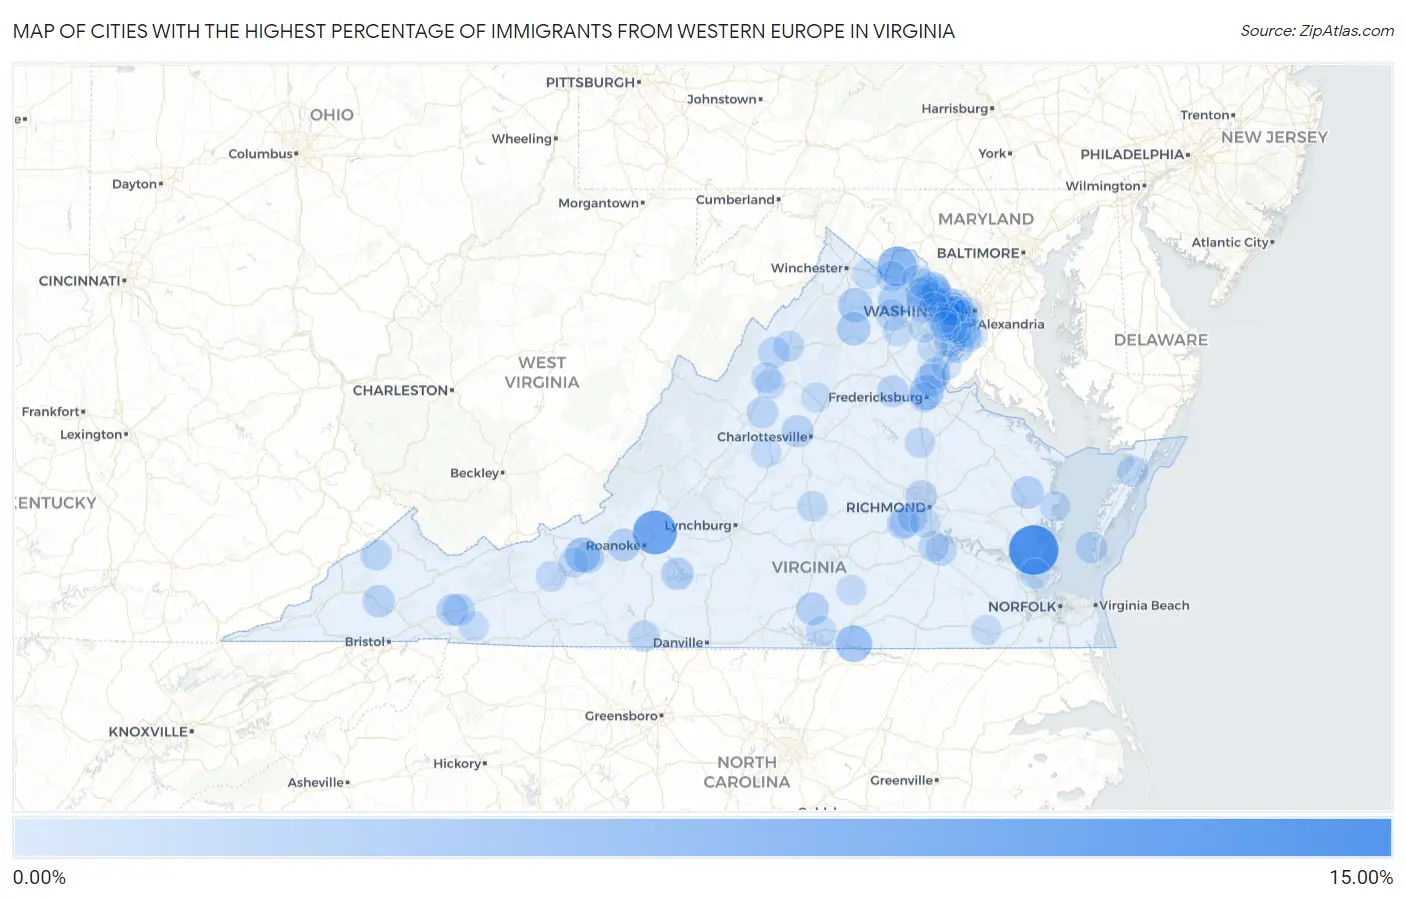
Map of Cities with the Highest Percentage of Immigrants from Western Europe in Virginia
0.00%
15.00%
Cities with the Highest Percentage of Immigrants from Western Europe in Virginia
| City | Western Europe | vs State | vs National | |
| 1. | Yorktown | 10.60% | 0.33%(+10.3)#1 | 0.28%(+10.3)#27 |
| 2. | Laymantown | 7.54% | 0.33%(+7.20)#2 | 0.28%(+7.26)#65 |
| 3. | Glen Wilton | 6.02% | 0.33%(+5.68)#3 | 0.28%(+5.74)#90 |
| 4. | Hillsboro | 5.26% | 0.33%(+4.93)#4 | 0.28%(+4.98)#116 |
| 5. | Port Republic | 4.37% | 0.33%(+4.04)#5 | 0.28%(+4.09)#154 |
| 6. | Bracey | 3.81% | 0.33%(+3.48)#6 | 0.28%(+3.53)#176 |
| 7. | Baywood | 3.78% | 0.33%(+3.45)#7 | 0.28%(+3.50)#179 |
| 8. | Prices Fork | 3.06% | 0.33%(+2.72)#8 | 0.28%(+2.78)#251 |
| 9. | Falmouth | 2.82% | 0.33%(+2.48)#9 | 0.28%(+2.54)#283 |
| 10. | Skyland Estates | 2.53% | 0.33%(+2.19)#10 | 0.28%(+2.25)#350 |
| 11. | Middleburg | 2.33% | 0.33%(+2.00)#11 | 0.28%(+2.05)#395 |
| 12. | Flint Hill | 2.19% | 0.33%(+1.86)#12 | 0.28%(+1.92)#443 |
| 13. | Stafford Courthouse | 1.98% | 0.33%(+1.65)#13 | 0.28%(+1.70)#523 |
| 14. | Wolf Trap | 1.86% | 0.33%(+1.53)#14 | 0.28%(+1.59)#572 |
| 15. | Urbanna | 1.83% | 0.33%(+1.50)#15 | 0.28%(+1.55)#591 |
| 16. | Fairview | 1.82% | 0.33%(+1.49)#16 | 0.28%(+1.55)#597 |
| 17. | Mason Neck | 1.81% | 0.33%(+1.48)#17 | 0.28%(+1.53)#603 |
| 18. | North Shore | 1.73% | 0.33%(+1.39)#18 | 0.28%(+1.45)#640 |
| 19. | Glenvar | 1.72% | 0.33%(+1.38)#19 | 0.28%(+1.44)#646 |
| 20. | Mcmullin | 1.67% | 0.33%(+1.33)#20 | 0.28%(+1.39)#677 |
| 21. | Hayfield | 1.64% | 0.33%(+1.31)#21 | 0.28%(+1.36)#696 |
| 22. | Ivy | 1.61% | 0.33%(+1.28)#22 | 0.28%(+1.33)#715 |
| 23. | Castlewood | 1.60% | 0.33%(+1.27)#23 | 0.28%(+1.33)#722 |
| 24. | Seven Mile Ford | 1.43% | 0.33%(+1.10)#24 | 0.28%(+1.16)#842 |
| 25. | Lake Of The Woods | 1.41% | 0.33%(+1.08)#25 | 0.28%(+1.13)#861 |
| 26. | Dumbarton | 1.37% | 0.33%(+1.03)#26 | 0.28%(+1.09)#908 |
| 27. | Vienna | 1.35% | 0.33%(+1.01)#27 | 0.28%(+1.07)#928 |
| 28. | Mclean | 1.30% | 0.33%(+0.963)#28 | 0.28%(+1.02)#984 |
| 29. | New Hope | 1.29% | 0.33%(+0.961)#29 | 0.28%(+1.02)#988 |
| 30. | Broadway | 1.27% | 0.33%(+0.938)#30 | 0.28%(+0.992)#1,015 |
| 31. | Allison Gap | 1.24% | 0.33%(+0.903)#31 | 0.28%(+0.957)#1,047 |
| 32. | Horse Pasture | 1.22% | 0.33%(+0.888)#32 | 0.28%(+0.943)#1,063 |
| 33. | Dranesville | 1.22% | 0.33%(+0.884)#33 | 0.28%(+0.938)#1,068 |
| 34. | Lake Barcroft | 1.21% | 0.33%(+0.875)#34 | 0.28%(+0.929)#1,079 |
| 35. | Cape Charles | 1.18% | 0.33%(+0.850)#35 | 0.28%(+0.904)#1,116 |
| 36. | Aquia Harbour | 1.18% | 0.33%(+0.847)#36 | 0.28%(+0.901)#1,129 |
| 37. | Woodlake | 1.16% | 0.33%(+0.829)#37 | 0.28%(+0.884)#1,153 |
| 38. | Mcgaheysville | 1.13% | 0.33%(+0.794)#38 | 0.28%(+0.849)#1,202 |
| 39. | Countryside | 1.12% | 0.33%(+0.786)#39 | 0.28%(+0.840)#1,212 |
| 40. | Occoquan | 1.12% | 0.33%(+0.786)#40 | 0.28%(+0.840)#1,213 |
| 41. | Merrimac | 1.10% | 0.33%(+0.770)#41 | 0.28%(+0.824)#1,239 |
| 42. | The Plains | 1.10% | 0.33%(+0.765)#42 | 0.28%(+0.820)#1,244 |
| 43. | Fort Lee | 1.07% | 0.33%(+0.735)#43 | 0.28%(+0.790)#1,294 |
| 44. | Parksley | 1.05% | 0.33%(+0.713)#44 | 0.28%(+0.768)#1,332 |
| 45. | Great Falls Crossing | 1.03% | 0.33%(+0.692)#45 | 0.28%(+0.747)#1,384 |
| 46. | Haysi | 1.01% | 0.33%(+0.680)#46 | 0.28%(+0.734)#1,404 |
| 47. | New Market | 0.97% | 0.33%(+0.638)#47 | 0.28%(+0.692)#1,488 |
| 48. | Pulaski | 0.96% | 0.33%(+0.624)#48 | 0.28%(+0.678)#1,515 |
| 49. | Brandermill | 0.91% | 0.33%(+0.576)#49 | 0.28%(+0.631)#1,630 |
| 50. | Colonial Heights | 0.90% | 0.33%(+0.569)#50 | 0.28%(+0.624)#1,649 |
| 51. | Round Hill | 0.90% | 0.33%(+0.564)#51 | 0.28%(+0.619)#1,660 |
| 52. | Cascades | 0.88% | 0.33%(+0.543)#52 | 0.28%(+0.598)#1,722 |
| 53. | Deltaville | 0.87% | 0.33%(+0.532)#53 | 0.28%(+0.586)#1,753 |
| 54. | Dillwyn | 0.86% | 0.33%(+0.528)#54 | 0.28%(+0.583)#1,764 |
| 55. | Idylwood | 0.86% | 0.33%(+0.526)#55 | 0.28%(+0.581)#1,771 |
| 56. | Moorefield | 0.84% | 0.33%(+0.504)#56 | 0.28%(+0.558)#1,821 |
| 57. | Lake Caroline | 0.83% | 0.33%(+0.496)#57 | 0.28%(+0.550)#1,838 |
| 58. | Rose Hill Cdp Fairfax County | 0.80% | 0.33%(+0.463)#58 | 0.28%(+0.518)#1,937 |
| 59. | Reston | 0.78% | 0.33%(+0.446)#59 | 0.28%(+0.500)#1,990 |
| 60. | Goose Creek | 0.77% | 0.33%(+0.438)#60 | 0.28%(+0.493)#2,015 |
| 61. | Seven Corners | 0.77% | 0.33%(+0.432)#61 | 0.28%(+0.487)#2,038 |
| 62. | Tysons | 0.73% | 0.33%(+0.398)#62 | 0.28%(+0.452)#2,154 |
| 63. | Ashburn | 0.73% | 0.33%(+0.396)#63 | 0.28%(+0.451)#2,159 |
| 64. | Boydton | 0.72% | 0.33%(+0.383)#64 | 0.28%(+0.438)#2,211 |
| 65. | Fort Hunt | 0.71% | 0.33%(+0.378)#65 | 0.28%(+0.433)#2,228 |
| 66. | Springfield | 0.70% | 0.33%(+0.366)#66 | 0.28%(+0.420)#2,263 |
| 67. | Berryville | 0.70% | 0.33%(+0.362)#67 | 0.28%(+0.417)#2,272 |
| 68. | Oakton | 0.68% | 0.33%(+0.351)#68 | 0.28%(+0.405)#2,319 |
| 69. | Harrisonburg | 0.67% | 0.33%(+0.336)#69 | 0.28%(+0.391)#2,377 |
| 70. | Rockwood | 0.66% | 0.33%(+0.323)#70 | 0.28%(+0.377)#2,443 |
| 71. | Mantua | 0.65% | 0.33%(+0.317)#71 | 0.28%(+0.371)#2,468 |
| 72. | Nellysford | 0.64% | 0.33%(+0.311)#72 | 0.28%(+0.365)#2,499 |
| 73. | Arlington | 0.63% | 0.33%(+0.293)#73 | 0.28%(+0.347)#2,597 |
| 74. | Newport News | 0.62% | 0.33%(+0.288)#74 | 0.28%(+0.342)#2,621 |
| 75. | West Springfield | 0.62% | 0.33%(+0.282)#75 | 0.28%(+0.337)#2,656 |
| 76. | Stanardsville | 0.61% | 0.33%(+0.276)#76 | 0.28%(+0.330)#2,699 |
| 77. | Dunn Loring | 0.61% | 0.33%(+0.275)#77 | 0.28%(+0.329)#2,709 |
| 78. | Massanetta Springs | 0.61% | 0.33%(+0.274)#78 | 0.28%(+0.328)#2,712 |
| 79. | Oak Grove | 0.59% | 0.33%(+0.258)#79 | 0.28%(+0.313)#2,779 |
| 80. | Kings Park West | 0.59% | 0.33%(+0.255)#80 | 0.28%(+0.309)#2,801 |
| 81. | Fairlawn | 0.58% | 0.33%(+0.250)#81 | 0.28%(+0.304)#2,831 |
| 82. | Leesburg | 0.58% | 0.33%(+0.246)#82 | 0.28%(+0.301)#2,848 |
| 83. | Kenbridge | 0.58% | 0.33%(+0.242)#83 | 0.28%(+0.297)#2,863 |
| 84. | Mount Vernon | 0.57% | 0.33%(+0.238)#84 | 0.28%(+0.292)#2,887 |
| 85. | New Baltimore | 0.57% | 0.33%(+0.237)#85 | 0.28%(+0.291)#2,892 |
| 86. | George Mason | 0.57% | 0.33%(+0.235)#86 | 0.28%(+0.290)#2,898 |
| 87. | South Riding | 0.57% | 0.33%(+0.233)#87 | 0.28%(+0.287)#2,915 |
| 88. | Broadlands | 0.56% | 0.33%(+0.222)#88 | 0.28%(+0.276)#2,978 |
| 89. | Quantico | 0.55% | 0.33%(+0.219)#89 | 0.28%(+0.273)#2,990 |
| 90. | Meadowbrook | 0.55% | 0.33%(+0.215)#90 | 0.28%(+0.269)#3,010 |
| 91. | Independent Hill | 0.55% | 0.33%(+0.214)#91 | 0.28%(+0.269)#3,016 |
| 92. | Loudoun Valley Estates | 0.54% | 0.33%(+0.208)#92 | 0.28%(+0.263)#3,048 |
| 93. | Troutdale | 0.54% | 0.33%(+0.207)#93 | 0.28%(+0.261)#3,059 |
| 94. | Sugarland Run | 0.54% | 0.33%(+0.205)#94 | 0.28%(+0.259)#3,074 |
| 95. | Lansdowne | 0.54% | 0.33%(+0.204)#95 | 0.28%(+0.258)#3,084 |
| 96. | Franklin | 0.54% | 0.33%(+0.203)#96 | 0.28%(+0.258)#3,085 |
| 97. | Fredericksburg | 0.53% | 0.33%(+0.201)#97 | 0.28%(+0.255)#3,099 |
| 98. | Franklin Farm | 0.53% | 0.33%(+0.195)#98 | 0.28%(+0.250)#3,132 |
| 99. | Loch Lomond | 0.52% | 0.33%(+0.186)#99 | 0.28%(+0.240)#3,190 |
| 100. | Burke Centre | 0.52% | 0.33%(+0.185)#100 | 0.28%(+0.240)#3,196 |
Common Questions
What are the Top 10 Cities with the Highest Percentage of Immigrants from Western Europe in Virginia?
Top 10 Cities with the Highest Percentage of Immigrants from Western Europe in Virginia are:
#1
10.60%
#2
7.54%
#3
5.26%
#4
3.81%
#5
3.06%
#6
2.82%
#7
2.53%
#8
2.33%
#9
2.19%
#10
1.98%
What city has the Highest Percentage of Immigrants from Western Europe in Virginia?
Yorktown has the Highest Percentage of Immigrants from Western Europe in Virginia with 10.60%.
What is the Percentage of Immigrants from Western Europe in the State of Virginia?
Percentage of Immigrants from Western Europe in Virginia is 0.33%.
What is the Percentage of Immigrants from Western Europe in the United States?
Percentage of Immigrants from Western Europe in the United States is 0.28%.