Cities with the Highest Percentage of Immigrants from Western Europe in South Carolina
RELATED REPORTS & OPTIONS
Western Europe
South Carolina
Compare Cities
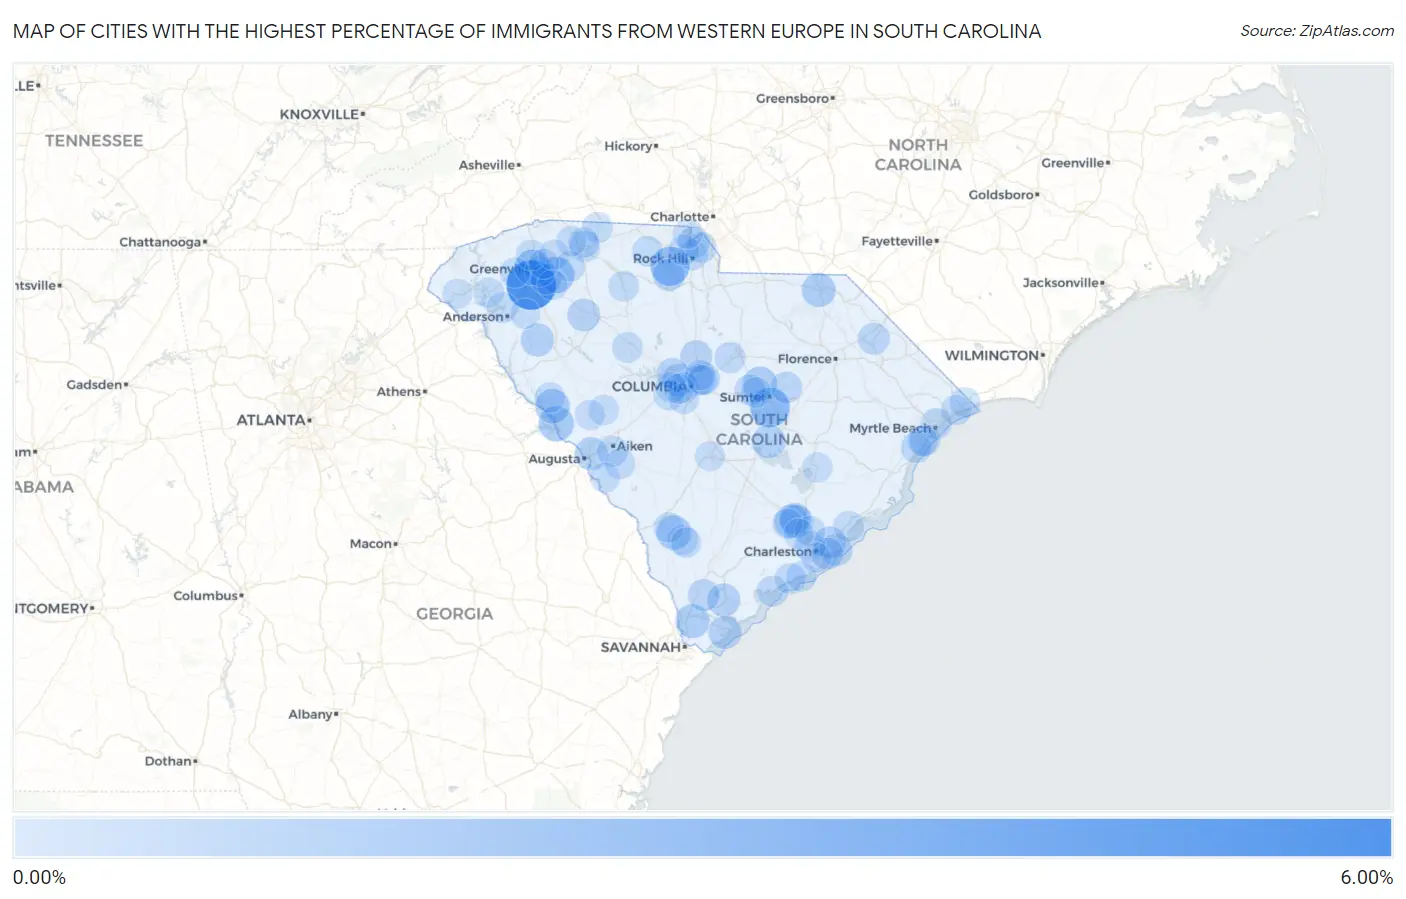
Map of Cities with the Highest Percentage of Immigrants from Western Europe in South Carolina
0.00%
6.00%
Cities with the Highest Percentage of Immigrants from Western Europe in South Carolina
| City | Western Europe | vs State | vs National | |
| 1. | Golden Grove | 5.39% | 0.27%(+5.12)#1 | 0.28%(+5.11)#107 |
| 2. | The Cliffs Valley | 3.21% | 0.27%(+2.94)#2 | 0.28%(+2.93)#227 |
| 3. | Lakewood | 2.65% | 0.27%(+2.38)#3 | 0.28%(+2.37)#324 |
| 4. | Mcconnells | 2.48% | 0.27%(+2.21)#4 | 0.28%(+2.20)#355 |
| 5. | Capitol View | 2.06% | 0.27%(+1.79)#5 | 0.28%(+1.78)#490 |
| 6. | Fripp Island | 1.96% | 0.27%(+1.69)#6 | 0.28%(+1.68)#536 |
| 7. | Five Forks | 1.79% | 0.27%(+1.52)#7 | 0.28%(+1.51)#610 |
| 8. | City View | 1.59% | 0.27%(+1.32)#8 | 0.28%(+1.31)#732 |
| 9. | Debordieu Colony | 1.58% | 0.27%(+1.31)#9 | 0.28%(+1.30)#741 |
| 10. | Modoc | 1.50% | 0.27%(+1.23)#10 | 0.28%(+1.22)#800 |
| 11. | Brunson | 1.33% | 0.27%(+1.06)#11 | 0.28%(+1.05)#943 |
| 12. | Plum Branch | 1.32% | 0.27%(+1.05)#12 | 0.28%(+1.04)#962 |
| 13. | Dalzell | 1.26% | 0.27%(+0.990)#13 | 0.28%(+0.979)#1,030 |
| 14. | Cheraw | 1.19% | 0.27%(+0.918)#14 | 0.28%(+0.907)#1,112 |
| 15. | Hardeeville | 1.18% | 0.27%(+0.912)#15 | 0.28%(+0.901)#1,128 |
| 16. | Lincolnville | 1.09% | 0.27%(+0.823)#16 | 0.28%(+0.813)#1,254 |
| 17. | Summerton | 0.98% | 0.27%(+0.712)#17 | 0.28%(+0.701)#1,469 |
| 18. | Clearwater | 0.97% | 0.27%(+0.701)#18 | 0.28%(+0.690)#1,492 |
| 19. | Due West | 0.96% | 0.27%(+0.689)#19 | 0.28%(+0.679)#1,512 |
| 20. | Burton | 0.93% | 0.27%(+0.665)#20 | 0.28%(+0.655)#1,567 |
| 21. | Hilton Head Island | 0.92% | 0.27%(+0.651)#21 | 0.28%(+0.641)#1,601 |
| 22. | Wyboo | 0.90% | 0.27%(+0.629)#22 | 0.28%(+0.619)#1,661 |
| 23. | Ladson | 0.88% | 0.27%(+0.607)#23 | 0.28%(+0.597)#1,724 |
| 24. | Watts Mills | 0.84% | 0.27%(+0.576)#24 | 0.28%(+0.565)#1,802 |
| 25. | Isle Of Palms | 0.81% | 0.27%(+0.536)#25 | 0.28%(+0.526)#1,910 |
| 26. | Mount Pleasant | 0.75% | 0.27%(+0.477)#26 | 0.28%(+0.466)#2,095 |
| 27. | Ben Avon | 0.74% | 0.27%(+0.472)#27 | 0.28%(+0.461)#2,119 |
| 28. | Woodfield | 0.73% | 0.27%(+0.460)#28 | 0.28%(+0.450)#2,172 |
| 29. | Seven Oaks | 0.71% | 0.27%(+0.439)#29 | 0.28%(+0.428)#2,241 |
| 30. | Blythewood | 0.70% | 0.27%(+0.426)#30 | 0.28%(+0.416)#2,274 |
| 31. | Lowrys | 0.67% | 0.27%(+0.405)#31 | 0.28%(+0.394)#2,363 |
| 32. | Ridgeland | 0.67% | 0.27%(+0.400)#32 | 0.28%(+0.390)#2,385 |
| 33. | Latta | 0.66% | 0.27%(+0.390)#33 | 0.28%(+0.379)#2,430 |
| 34. | Sullivan S Island | 0.65% | 0.27%(+0.379)#34 | 0.28%(+0.368)#2,488 |
| 35. | Tega Cay | 0.64% | 0.27%(+0.371)#35 | 0.28%(+0.361)#2,527 |
| 36. | Irmo | 0.60% | 0.27%(+0.330)#36 | 0.28%(+0.320)#2,757 |
| 37. | Mayesville | 0.60% | 0.27%(+0.328)#37 | 0.28%(+0.318)#2,768 |
| 38. | Sangaree | 0.56% | 0.27%(+0.296)#38 | 0.28%(+0.285)#2,928 |
| 39. | Mauldin | 0.50% | 0.27%(+0.230)#39 | 0.28%(+0.219)#3,340 |
| 40. | Myrtle Beach | 0.49% | 0.27%(+0.216)#40 | 0.28%(+0.206)#3,435 |
| 41. | Stateburg | 0.46% | 0.27%(+0.191)#41 | 0.28%(+0.181)#3,615 |
| 42. | Edisto Beach | 0.45% | 0.27%(+0.184)#42 | 0.28%(+0.173)#3,668 |
| 43. | Forest Acres | 0.45% | 0.27%(+0.178)#43 | 0.28%(+0.168)#3,709 |
| 44. | Lugoff | 0.45% | 0.27%(+0.177)#44 | 0.28%(+0.166)#3,720 |
| 45. | Litchfield Beach | 0.44% | 0.27%(+0.169)#45 | 0.28%(+0.159)#3,786 |
| 46. | Surfside Beach | 0.43% | 0.27%(+0.162)#46 | 0.28%(+0.151)#3,840 |
| 47. | Murrells Inlet | 0.43% | 0.27%(+0.159)#47 | 0.28%(+0.148)#3,865 |
| 48. | Aiken | 0.42% | 0.27%(+0.147)#48 | 0.28%(+0.136)#3,967 |
| 49. | Charleston | 0.41% | 0.27%(+0.142)#49 | 0.28%(+0.132)#4,012 |
| 50. | Valley Falls | 0.41% | 0.27%(+0.139)#50 | 0.28%(+0.129)#4,032 |
| 51. | Seabrook Island | 0.39% | 0.27%(+0.119)#51 | 0.28%(+0.109)#4,254 |
| 52. | Awendaw | 0.39% | 0.27%(+0.119)#52 | 0.28%(+0.108)#4,256 |
| 53. | Hickory Grove | 0.37% | 0.27%(+0.101)#53 | 0.28%(+0.090)#4,446 |
| 54. | New Ellenton | 0.36% | 0.27%(+0.090)#54 | 0.28%(+0.080)#4,567 |
| 55. | Greenville | 0.36% | 0.27%(+0.087)#55 | 0.28%(+0.076)#4,604 |
| 56. | West Columbia | 0.36% | 0.27%(+0.086)#56 | 0.28%(+0.076)#4,615 |
| 57. | Northlake | 0.35% | 0.27%(+0.082)#57 | 0.28%(+0.072)#4,657 |
| 58. | Red Bank | 0.35% | 0.27%(+0.082)#58 | 0.28%(+0.072)#4,658 |
| 59. | Travelers Rest | 0.34% | 0.27%(+0.072)#59 | 0.28%(+0.061)#4,770 |
| 60. | Garden City | 0.34% | 0.27%(+0.071)#60 | 0.28%(+0.061)#4,777 |
| 61. | Chesnee | 0.34% | 0.27%(+0.066)#61 | 0.28%(+0.056)#4,832 |
| 62. | Rock Hill | 0.33% | 0.27%(+0.064)#62 | 0.28%(+0.054)#4,854 |
| 63. | Hanahan | 0.33% | 0.27%(+0.064)#63 | 0.28%(+0.054)#4,855 |
| 64. | Newberry | 0.33% | 0.27%(+0.059)#64 | 0.28%(+0.048)#4,900 |
| 65. | Fort Mill | 0.32% | 0.27%(+0.054)#65 | 0.28%(+0.044)#4,956 |
| 66. | Union | 0.32% | 0.27%(+0.052)#66 | 0.28%(+0.042)#4,973 |
| 67. | Newport | 0.31% | 0.27%(+0.039)#67 | 0.28%(+0.028)#5,138 |
| 68. | Lexington | 0.30% | 0.27%(+0.031)#68 | 0.28%(+0.021)#5,220 |
| 69. | Greer | 0.30% | 0.27%(+0.031)#69 | 0.28%(+0.021)#5,222 |
| 70. | Boiling Springs | 0.29% | 0.27%(+0.026)#70 | 0.28%(+0.016)#5,300 |
| 71. | Hampton | 0.29% | 0.27%(+0.025)#71 | 0.28%(+0.014)#5,312 |
| 72. | Reidville | 0.29% | 0.27%(+0.020)#72 | 0.28%(+0.009)#5,381 |
| 73. | Cherryvale | 0.28% | 0.27%(+0.013)#73 | 0.28%(+0.002)#5,456 |
| 74. | Dentsville | 0.28% | 0.27%(+0.012)#74 | 0.28%(+0.001)#5,470 |
| 75. | Clemson | 0.27% | 0.27%(+0.005)#75 | 0.28%(-0.006)#5,558 |
| 76. | Little River | 0.26% | 0.27%(-0.004)#76 | 0.28%(-0.014)#5,674 |
| 77. | Pine Ridge | 0.26% | 0.27%(-0.008)#77 | 0.28%(-0.019)#5,734 |
| 78. | Easley | 0.26% | 0.27%(-0.009)#78 | 0.28%(-0.020)#5,749 |
| 79. | North Myrtle Beach | 0.25% | 0.27%(-0.014)#79 | 0.28%(-0.025)#5,819 |
| 80. | Mccormick | 0.25% | 0.27%(-0.015)#80 | 0.28%(-0.026)#5,832 |
| 81. | Johnston | 0.25% | 0.27%(-0.016)#81 | 0.28%(-0.027)#5,853 |
| 82. | Fairfax | 0.25% | 0.27%(-0.023)#82 | 0.28%(-0.034)#5,949 |
| 83. | Kiawah Island | 0.23% | 0.27%(-0.034)#83 | 0.28%(-0.045)#6,098 |
| 84. | Inman | 0.23% | 0.27%(-0.034)#84 | 0.28%(-0.045)#6,103 |
| 85. | Varnville | 0.23% | 0.27%(-0.039)#85 | 0.28%(-0.049)#6,171 |
| 86. | Belton | 0.23% | 0.27%(-0.039)#86 | 0.28%(-0.050)#6,178 |
| 87. | Summerville | 0.22% | 0.27%(-0.047)#87 | 0.28%(-0.057)#6,290 |
| 88. | North Charleston | 0.22% | 0.27%(-0.049)#88 | 0.28%(-0.059)#6,324 |
| 89. | Simpsonville | 0.22% | 0.27%(-0.049)#89 | 0.28%(-0.060)#6,334 |
| 90. | Oak Grove | 0.22% | 0.27%(-0.049)#90 | 0.28%(-0.060)#6,335 |
| 91. | St Stephen | 0.22% | 0.27%(-0.052)#91 | 0.28%(-0.063)#6,396 |
| 92. | Carolina Forest | 0.21% | 0.27%(-0.055)#92 | 0.28%(-0.066)#6,425 |
| 93. | Jackson | 0.21% | 0.27%(-0.056)#93 | 0.28%(-0.067)#6,439 |
| 94. | Edgefield | 0.20% | 0.27%(-0.069)#94 | 0.28%(-0.080)#6,661 |
| 95. | Lake Wylie | 0.19% | 0.27%(-0.074)#95 | 0.28%(-0.085)#6,740 |
| 96. | Wade Hampton | 0.19% | 0.27%(-0.079)#96 | 0.28%(-0.089)#6,829 |
| 97. | Orangeburg | 0.19% | 0.27%(-0.080)#97 | 0.28%(-0.090)#6,841 |
| 98. | James Island | 0.19% | 0.27%(-0.081)#98 | 0.28%(-0.091)#6,856 |
| 99. | Columbia | 0.19% | 0.27%(-0.082)#99 | 0.28%(-0.092)#6,870 |
| 100. | Westminster | 0.18% | 0.27%(-0.088)#100 | 0.28%(-0.099)#6,986 |
Common Questions
What are the Top 10 Cities with the Highest Percentage of Immigrants from Western Europe in South Carolina?
Top 10 Cities with the Highest Percentage of Immigrants from Western Europe in South Carolina are:
#1
5.39%
#2
2.65%
#3
2.48%
#4
1.79%
#5
1.59%
#6
1.50%
#7
1.33%
#8
1.32%
#9
1.26%
#10
1.19%
What city has the Highest Percentage of Immigrants from Western Europe in South Carolina?
Golden Grove has the Highest Percentage of Immigrants from Western Europe in South Carolina with 5.39%.
What is the Percentage of Immigrants from Western Europe in the State of South Carolina?
Percentage of Immigrants from Western Europe in South Carolina is 0.27%.
What is the Percentage of Immigrants from Western Europe in the United States?
Percentage of Immigrants from Western Europe in the United States is 0.28%.