Highfield Cascade, MD
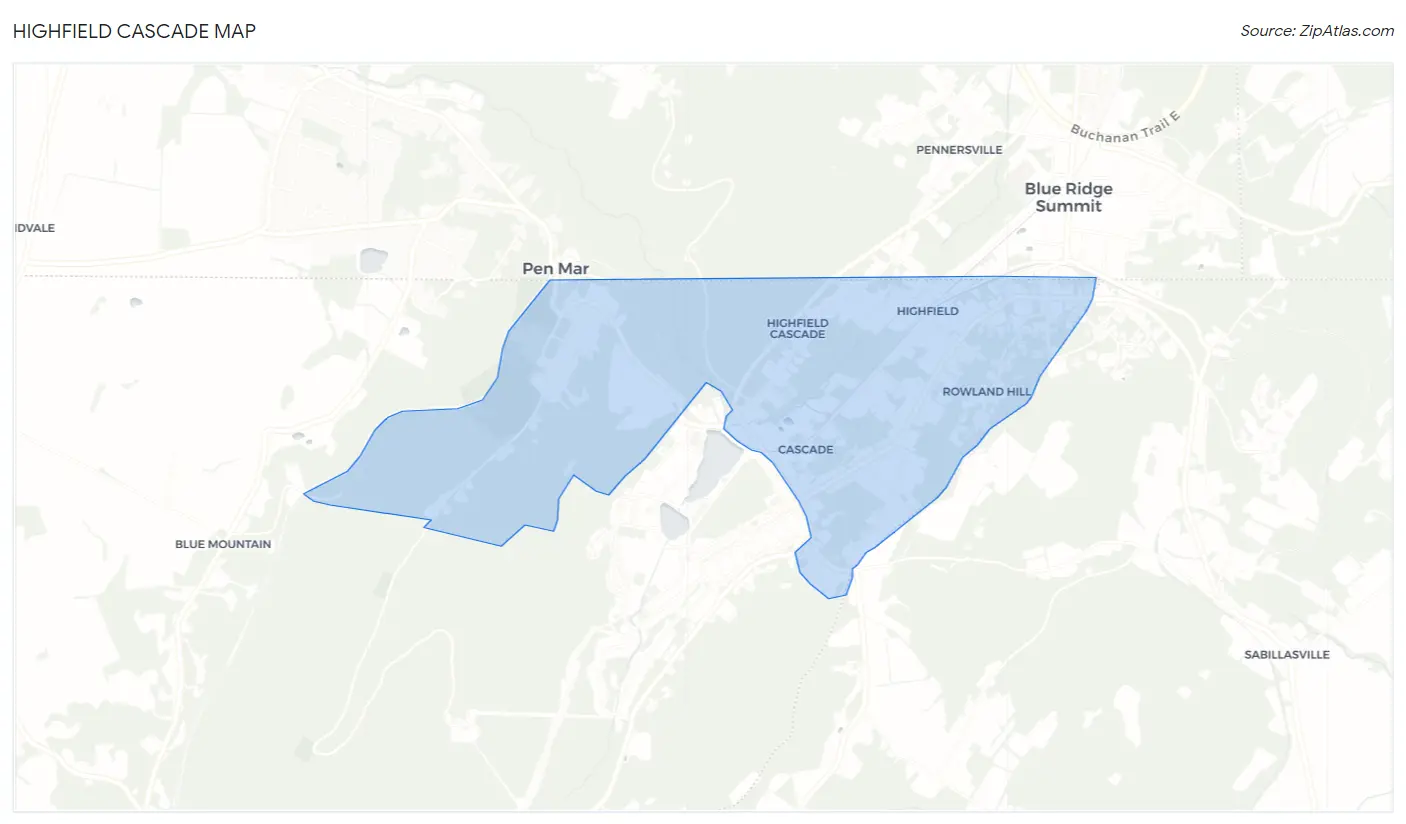
Highfield Cascade Map
Highfield Cascade Overview
1,031
TOTAL POPULATION
491
MALE POPULATION
540
FEMALE POPULATION
90.93
MALES / 100 FEMALES
109.98
FEMALES / 100 MALES
38.3
MEDIAN AGE
3.4
AVG FAMILY SIZE
2.7
AVG HOUSEHOLD SIZE
$37,103
PER CAPITA INCOME
$112,708
AVG FAMILY INCOME
$73,854
AVG HOUSEHOLD INCOME
38.0%
WAGE / INCOME GAP [ % ]
62.0¢/ $1
WAGE / INCOME GAP [ $ ]
0.44
INEQUALITY / GINI INDEX
595
LABOR FORCE [ PEOPLE ]
71.9%
PERCENT IN LABOR FORCE
2.7%
UNEMPLOYMENT RATE
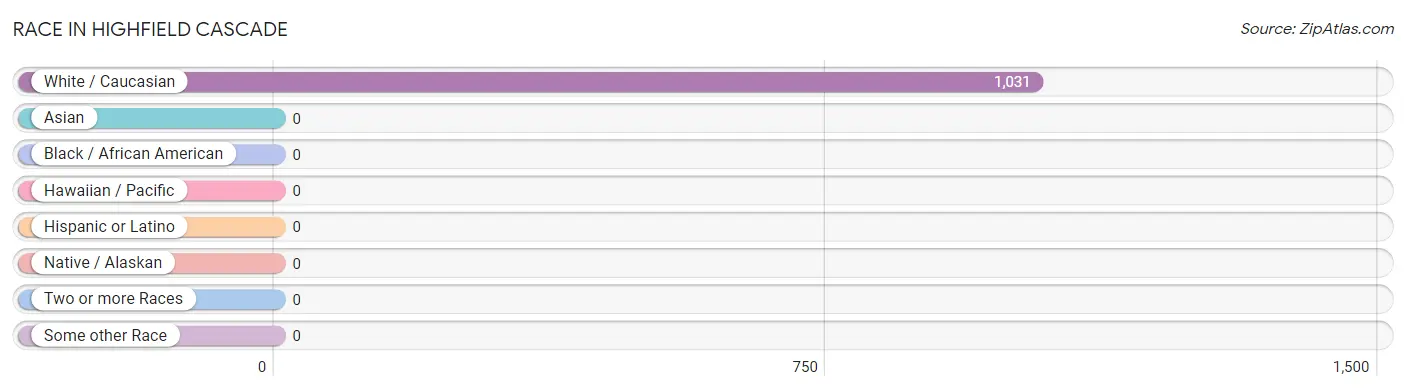
Race in Highfield Cascade
The most populous races in Highfield Cascade are , and White / Caucasian (1,031 | 100.0%).
| Race | # Population | % Population |
| Asian | 0 | 0.0% |
| Black / African American | 0 | 0.0% |
| Hawaiian / Pacific | 0 | 0.0% |
| Hispanic or Latino | 0 | 0.0% |
| Native / Alaskan | 0 | 0.0% |
| White / Caucasian | 1,031 | 100.0% |
| Two or more Races | 0 | 0.0% |
| Some other Race | 0 | 0.0% |
| Total | 1,031 | 100.0% |
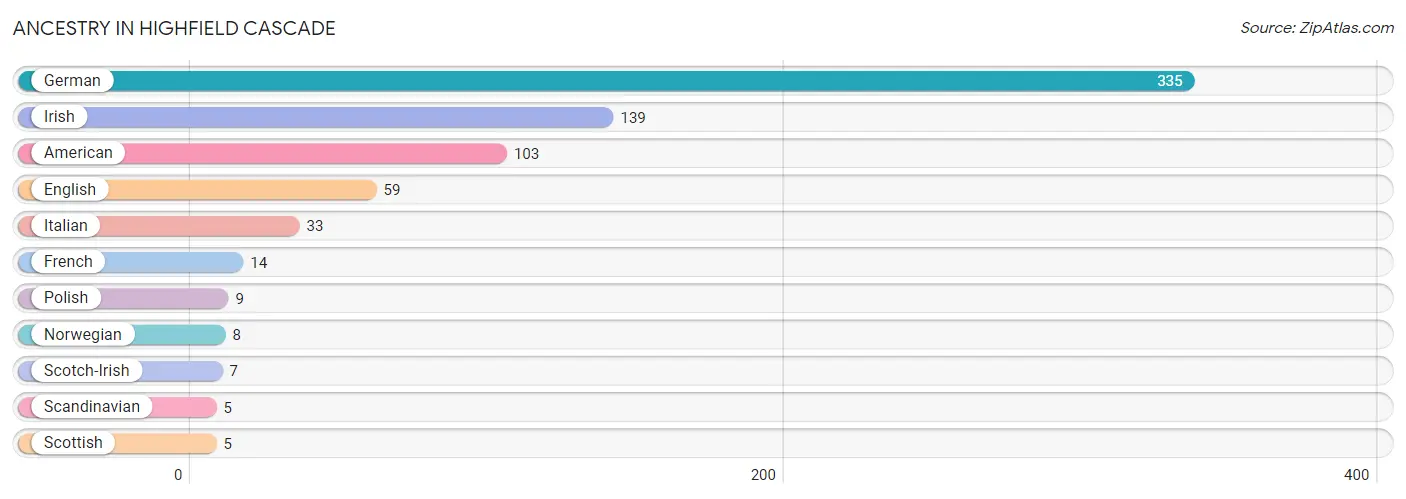
Ancestry in Highfield Cascade
The most populous ancestries reported in Highfield Cascade are German (335 | 32.5%), Irish (139 | 13.5%), American (103 | 10.0%), English (59 | 5.7%), and Italian (33 | 3.2%), together accounting for 64.9% of all Highfield Cascade residents.
| Ancestry | # Population | % Population |
| American | 103 | 10.0% |
| English | 59 | 5.7% |
| French | 14 | 1.4% |
| German | 335 | 32.5% |
| Irish | 139 | 13.5% |
| Italian | 33 | 3.2% |
| Norwegian | 8 | 0.8% |
| Polish | 9 | 0.9% |
| Scandinavian | 5 | 0.5% |
| Scotch-Irish | 7 | 0.7% |
| Scottish | 5 | 0.5% | View All 11 Rows |
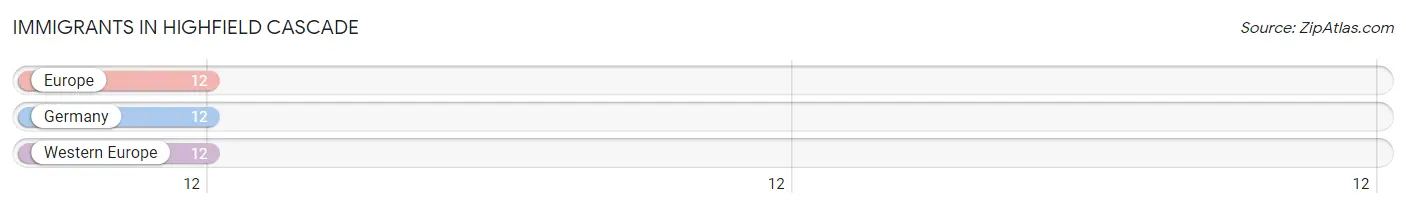
Immigrants in Highfield Cascade
The most numerous immigrant groups reported in Highfield Cascade came from Europe (12 | 1.2%), Germany (12 | 1.2%), and Western Europe (12 | 1.2%), together accounting for 3.5% of all Highfield Cascade residents.
| Immigration Origin | # Population | % Population |
| Europe | 12 | 1.2% |
| Germany | 12 | 1.2% |
| Western Europe | 12 | 1.2% | View All 3 Rows |
Sex and Age in Highfield Cascade
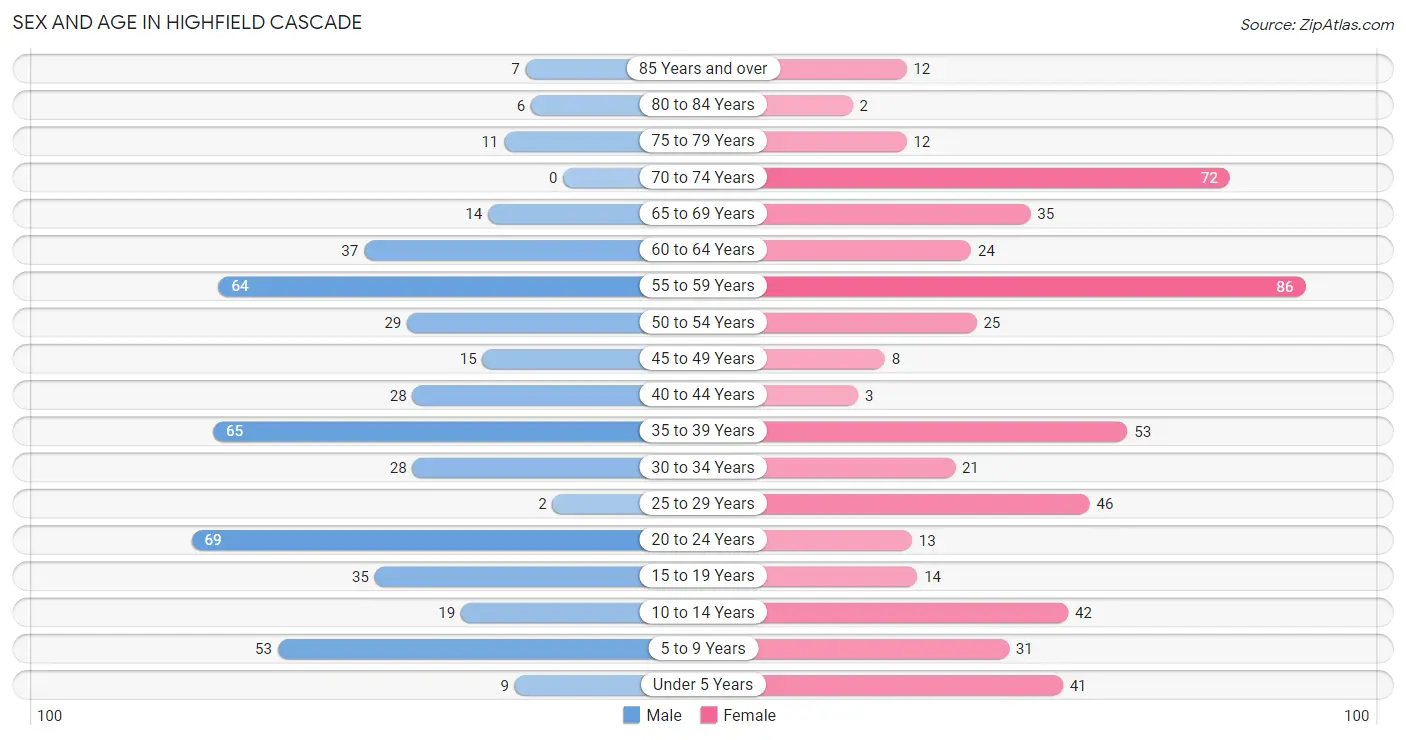
Sex and Age in Highfield Cascade
The most populous age groups in Highfield Cascade are 20 to 24 Years (69 | 14.1%) for men and 55 to 59 Years (86 | 15.9%) for women.
| Age Bracket | Male | Female |
| Under 5 Years | 9 (1.8%) | 41 (7.6%) |
| 5 to 9 Years | 53 (10.8%) | 31 (5.7%) |
| 10 to 14 Years | 19 (3.9%) | 42 (7.8%) |
| 15 to 19 Years | 35 (7.1%) | 14 (2.6%) |
| 20 to 24 Years | 69 (14.1%) | 13 (2.4%) |
| 25 to 29 Years | 2 (0.4%) | 46 (8.5%) |
| 30 to 34 Years | 28 (5.7%) | 21 (3.9%) |
| 35 to 39 Years | 65 (13.2%) | 53 (9.8%) |
| 40 to 44 Years | 28 (5.7%) | 3 (0.6%) |
| 45 to 49 Years | 15 (3.0%) | 8 (1.5%) |
| 50 to 54 Years | 29 (5.9%) | 25 (4.6%) |
| 55 to 59 Years | 64 (13.0%) | 86 (15.9%) |
| 60 to 64 Years | 37 (7.5%) | 24 (4.4%) |
| 65 to 69 Years | 14 (2.9%) | 35 (6.5%) |
| 70 to 74 Years | 0 (0.0%) | 72 (13.3%) |
| 75 to 79 Years | 11 (2.2%) | 12 (2.2%) |
| 80 to 84 Years | 6 (1.2%) | 2 (0.4%) |
| 85 Years and over | 7 (1.4%) | 12 (2.2%) |
| Total | 491 (100.0%) | 540 (100.0%) |
Families and Households in Highfield Cascade
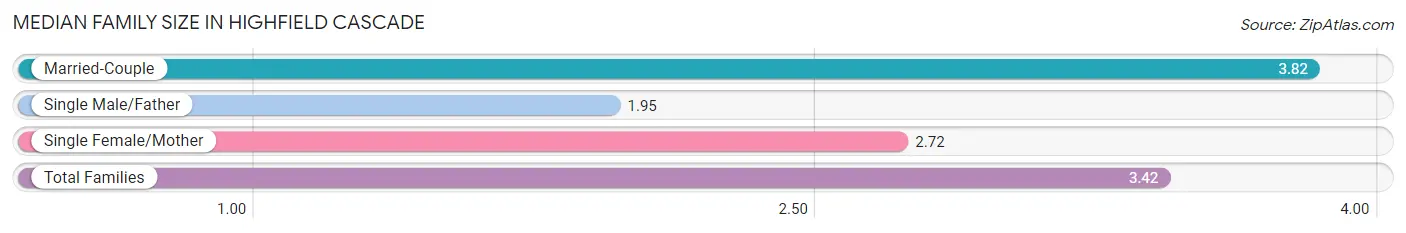
Median Family Size in Highfield Cascade
The median family size in Highfield Cascade is 3.42 persons per family, with married-couple families (179 | 69.1%) accounting for the largest median family size of 3.82 persons per family. On the other hand, single male/father families (22 | 8.5%) represent the smallest median family size with 1.95 persons per family.
| Family Type | # Families | Family Size |
| Married-Couple | 179 (69.1%) | 3.82 |
| Single Male/Father | 22 (8.5%) | 1.95 |
| Single Female/Mother | 58 (22.4%) | 2.72 |
| Total Families | 259 (100.0%) | 3.42 |
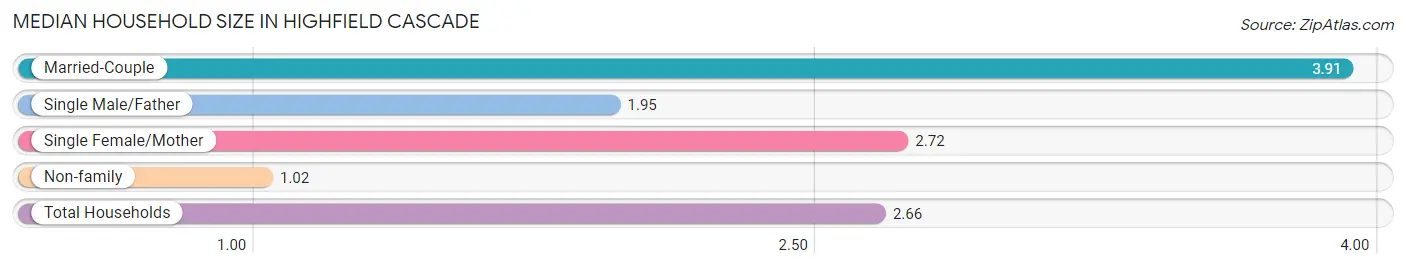
Median Household Size in Highfield Cascade
The median household size in Highfield Cascade is 2.66 persons per household, with married-couple households (179 | 46.3%) accounting for the largest median household size of 3.91 persons per household. non-family households (128 | 33.1%) represent the smallest median household size with 1.02 persons per household.
| Household Type | # Households | Household Size |
| Married-Couple | 179 (46.3%) | 3.91 |
| Single Male/Father | 22 (5.7%) | 1.95 |
| Single Female/Mother | 58 (15.0%) | 2.72 |
| Non-family | 128 (33.1%) | 1.02 |
| Total Households | 387 (100.0%) | 2.66 |
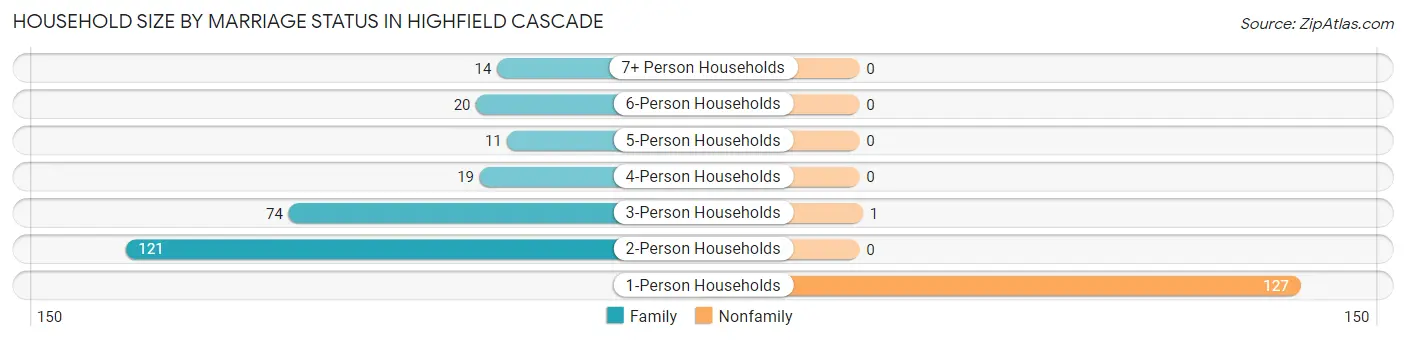
Household Size by Marriage Status in Highfield Cascade
Out of a total of 387 households in Highfield Cascade, 259 (66.9%) are family households, while 128 (33.1%) are nonfamily households. The most numerous type of family households are 2-person households, comprising 121, and the most common type of nonfamily households are 1-person households, comprising 127.
| Household Size | Family Households | Nonfamily Households |
| 1-Person Households | - | 127 (32.8%) |
| 2-Person Households | 121 (31.3%) | 0 (0.0%) |
| 3-Person Households | 74 (19.1%) | 1 (0.3%) |
| 4-Person Households | 19 (4.9%) | 0 (0.0%) |
| 5-Person Households | 11 (2.8%) | 0 (0.0%) |
| 6-Person Households | 20 (5.2%) | 0 (0.0%) |
| 7+ Person Households | 14 (3.6%) | 0 (0.0%) |
| Total | 259 (66.9%) | 128 (33.1%) |
Female Fertility in Highfield Cascade
Fertility by Age in Highfield Cascade
| Age Bracket | Women with Births | Births / 1,000 Women |
| 15 to 19 years | 0 (0.0%) | 0.0 |
| 20 to 34 years | 0 (0.0%) | 0.0 |
| 35 to 50 years | 0 (0.0%) | 0.0 |
| Total | 0 (0.0%) | 0.0 |
Fertility by Age by Marriage Status in Highfield Cascade
| Age Bracket | Married | Unmarried |
| 15 to 19 years | 0 (0.0%) | 0 (0.0%) |
| 20 to 34 years | 0 (0.0%) | 0 (0.0%) |
| 35 to 50 years | 0 (0.0%) | 0 (0.0%) |
| Total | 0 (0.0%) | 0 (0.0%) |
Fertility by Education in Highfield Cascade
| Educational Attainment | Women with Births | Births / 1,000 Women |
| Less than High School | 0 (0.0%) | 0.0 |
| High School Diploma | 0 (0.0%) | 0.0 |
| College or Associate's Degree | 0 (0.0%) | 0.0 |
| Bachelor's Degree | 0 (0.0%) | 0.0 |
| Graduate Degree | 0 (0.0%) | 0.0 |
| Total | 0 (0.0%) | 0.0 |
Fertility by Education by Marriage Status in Highfield Cascade
| Educational Attainment | Married | Unmarried |
| Less than High School | 0 (0.0%) | 0 (0.0%) |
| High School Diploma | 0 (0.0%) | 0 (0.0%) |
| College or Associate's Degree | 0 (0.0%) | 0 (0.0%) |
| Bachelor's Degree | 0 (0.0%) | 0 (0.0%) |
| Graduate Degree | 0 (0.0%) | 0 (0.0%) |
| Total | 0 (0.0%) | 0 (0.0%) |
Income in Highfield Cascade
Income Overview in Highfield Cascade
Per Capita Income in Highfield Cascade is $37,103, while median incomes of families and households are $112,708 and $73,854 respectively.
| Characteristic | Number | Measure |
| Per Capita Income | 1,031 | $37,103 |
| Median Family Income | 259 | $112,708 |
| Mean Family Income | 259 | $113,740 |
| Median Household Income | 387 | $73,854 |
| Mean Household Income | 387 | $90,097 |
| Income Deficit | 259 | $0 |
| Wage / Income Gap (%) | 1,031 | 37.97% |
| Wage / Income Gap ($) | 1,031 | 62.03¢ per $1 |
| Gini / Inequality Index | 1,031 | 0.44 |
Earnings by Sex in Highfield Cascade
Average Earnings in Highfield Cascade are $49,044, $58,170 for men and $36,083 for women, a difference of 38.0%.
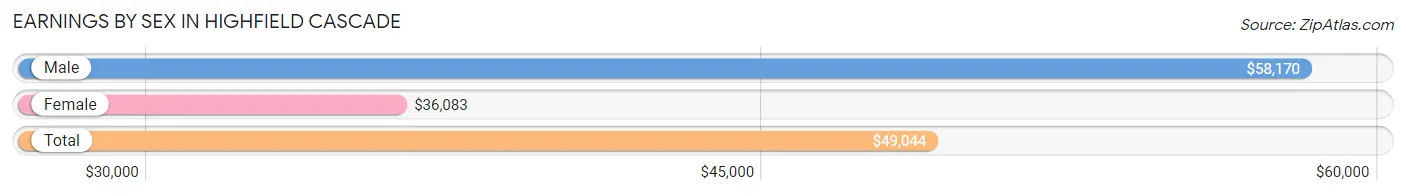
| Sex | Number | Average Earnings |
| Male | 350 (57.9%) | $58,170 |
| Female | 255 (42.1%) | $36,083 |
| Total | 605 (100.0%) | $49,044 |
Earnings by Sex by Income Bracket in Highfield Cascade
The most common earnings brackets in Highfield Cascade are $55,000 to $64,999 for men (70 | 20.0%) and $65,000 to $74,999 for women (39 | 15.3%).
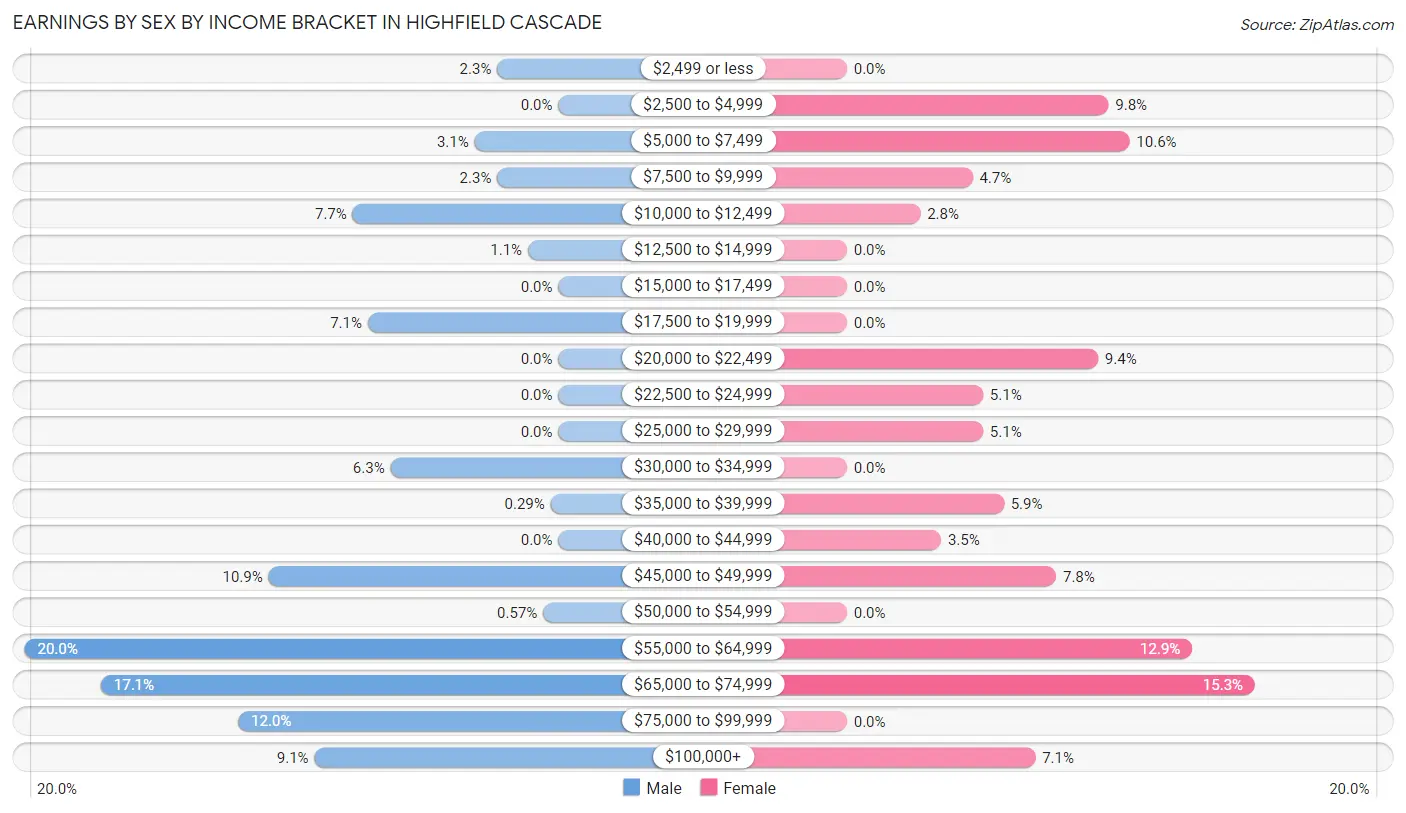
| Income | Male | Female |
| $2,499 or less | 8 (2.3%) | 0 (0.0%) |
| $2,500 to $4,999 | 0 (0.0%) | 25 (9.8%) |
| $5,000 to $7,499 | 11 (3.1%) | 27 (10.6%) |
| $7,500 to $9,999 | 8 (2.3%) | 12 (4.7%) |
| $10,000 to $12,499 | 27 (7.7%) | 7 (2.8%) |
| $12,500 to $14,999 | 4 (1.1%) | 0 (0.0%) |
| $15,000 to $17,499 | 0 (0.0%) | 0 (0.0%) |
| $17,500 to $19,999 | 25 (7.1%) | 0 (0.0%) |
| $20,000 to $22,499 | 0 (0.0%) | 24 (9.4%) |
| $22,500 to $24,999 | 0 (0.0%) | 13 (5.1%) |
| $25,000 to $29,999 | 0 (0.0%) | 13 (5.1%) |
| $30,000 to $34,999 | 22 (6.3%) | 0 (0.0%) |
| $35,000 to $39,999 | 1 (0.3%) | 15 (5.9%) |
| $40,000 to $44,999 | 0 (0.0%) | 9 (3.5%) |
| $45,000 to $49,999 | 38 (10.9%) | 20 (7.8%) |
| $50,000 to $54,999 | 2 (0.6%) | 0 (0.0%) |
| $55,000 to $64,999 | 70 (20.0%) | 33 (12.9%) |
| $65,000 to $74,999 | 60 (17.1%) | 39 (15.3%) |
| $75,000 to $99,999 | 42 (12.0%) | 0 (0.0%) |
| $100,000+ | 32 (9.1%) | 18 (7.1%) |
| Total | 350 (100.0%) | 255 (100.0%) |
Earnings by Sex by Educational Attainment in Highfield Cascade
Average earnings in Highfield Cascade are $66,750 for men and $37,167 for women, a difference of 44.3%. Men with an educational attainment of high school diploma enjoy the highest average annual earnings of $72,614, while those with college or associate's degree education earn the least with $51,250. Women with an educational attainment of bachelor's degree earn the most with the average annual earnings of $58,807, while those with college or associate's degree education have the smallest earnings of $35,417.
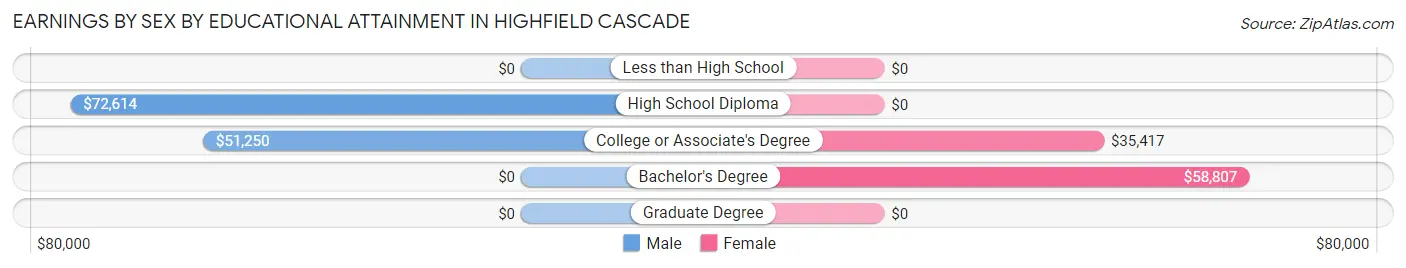
| Educational Attainment | Male Income | Female Income |
| Less than High School | - | - |
| High School Diploma | $72,614 | $0 |
| College or Associate's Degree | $51,250 | $35,417 |
| Bachelor's Degree | - | - |
| Graduate Degree | - | - |
| Total | $66,750 | $37,167 |
Family Income in Highfield Cascade
Family Income Brackets in Highfield Cascade
According to the Highfield Cascade family income data, there are 71 families falling into the $100,000 to $149,999 income range, which is the most common income bracket and makes up 27.4% of all families.
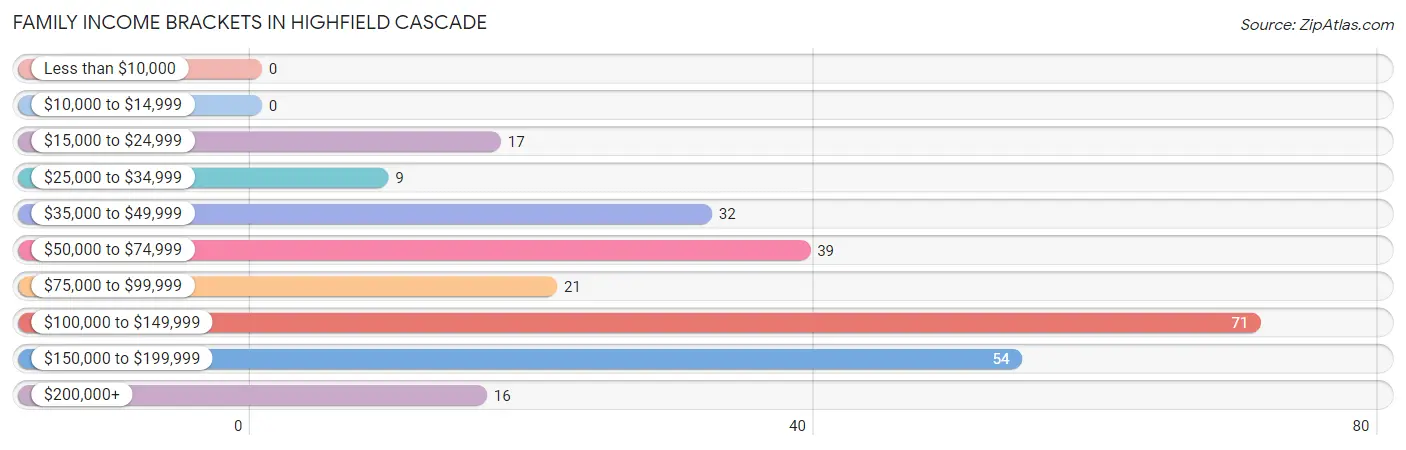
| Income Bracket | # Families | % Families |
| Less than $10,000 | 0 | 0.0% |
| $10,000 to $14,999 | 0 | 0.0% |
| $15,000 to $24,999 | 17 | 6.6% |
| $25,000 to $34,999 | 9 | 3.5% |
| $35,000 to $49,999 | 32 | 12.4% |
| $50,000 to $74,999 | 39 | 15.1% |
| $75,000 to $99,999 | 21 | 8.1% |
| $100,000 to $149,999 | 71 | 27.4% |
| $150,000 to $199,999 | 54 | 20.8% |
| $200,000+ | 16 | 6.2% |
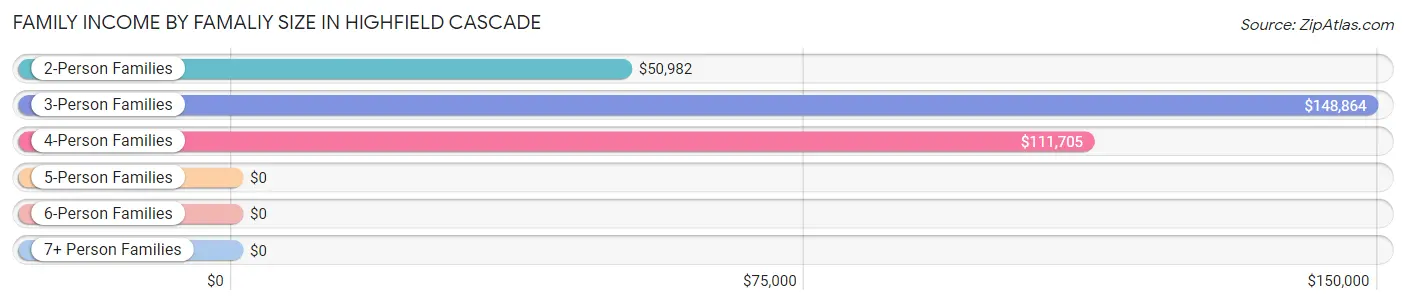
Family Income by Famaliy Size in Highfield Cascade
3-person families (74 | 28.6%) account for the highest median family income in Highfield Cascade with $148,864 per family, while 3-person families (74 | 28.6%) have the highest median income of $49,621 per family member.
| Income Bracket | # Families | Median Income |
| 2-Person Families | 121 (46.7%) | $50,982 |
| 3-Person Families | 74 (28.6%) | $148,864 |
| 4-Person Families | 19 (7.3%) | $111,705 |
| 5-Person Families | 11 (4.3%) | $0 |
| 6-Person Families | 20 (7.7%) | $0 |
| 7+ Person Families | 14 (5.4%) | $0 |
| Total | 259 (100.0%) | $112,708 |
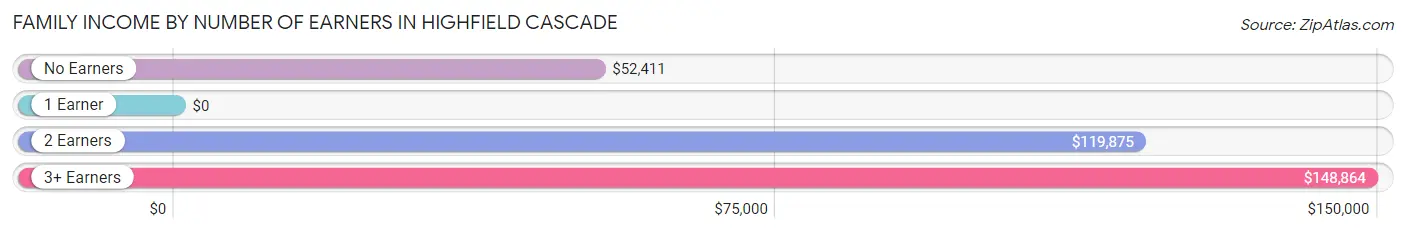
Family Income by Number of Earners in Highfield Cascade
| Number of Earners | # Families | Median Income |
| No Earners | 27 (10.4%) | $52,411 |
| 1 Earner | 88 (34.0%) | $0 |
| 2 Earners | 82 (31.7%) | $119,875 |
| 3+ Earners | 62 (23.9%) | $148,864 |
| Total | 259 (100.0%) | $112,708 |
Household Income in Highfield Cascade
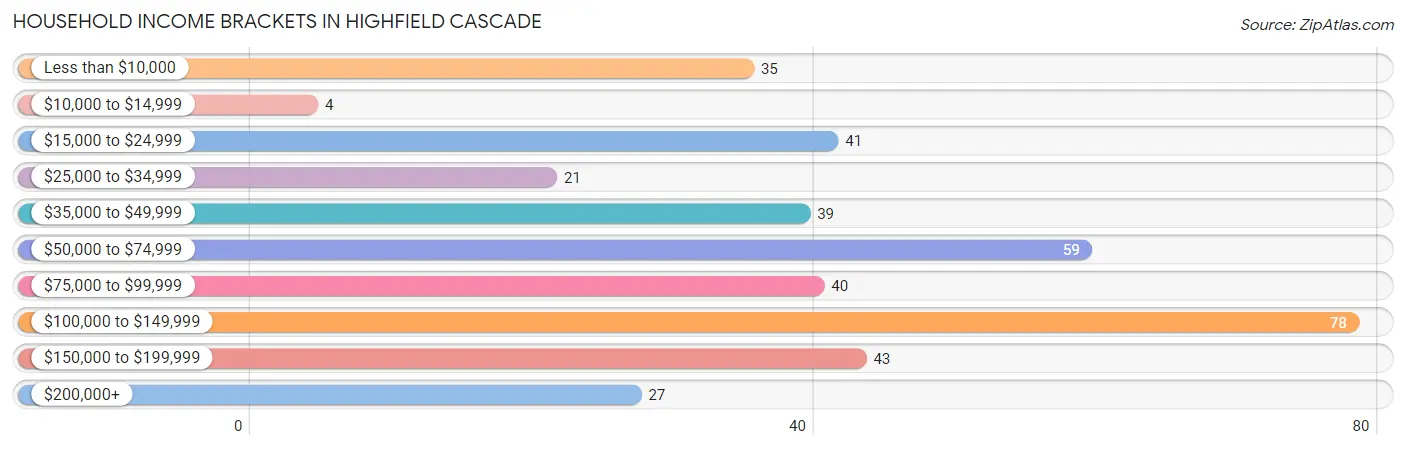
Household Income Brackets in Highfield Cascade
With 78 households falling in the category, the $100,000 to $149,999 income range is the most frequent in Highfield Cascade, accounting for 20.2% of all households. In contrast, only 4 households (1.0%) fall into the $10,000 to $14,999 income bracket, making it the least populous group.
| Income Bracket | # Households | % Households |
| Less than $10,000 | 35 | 9.0% |
| $10,000 to $14,999 | 4 | 1.0% |
| $15,000 to $24,999 | 41 | 10.6% |
| $25,000 to $34,999 | 21 | 5.4% |
| $35,000 to $49,999 | 39 | 10.1% |
| $50,000 to $74,999 | 59 | 15.2% |
| $75,000 to $99,999 | 40 | 10.3% |
| $100,000 to $149,999 | 78 | 20.2% |
| $150,000 to $199,999 | 43 | 11.1% |
| $200,000+ | 27 | 7.0% |
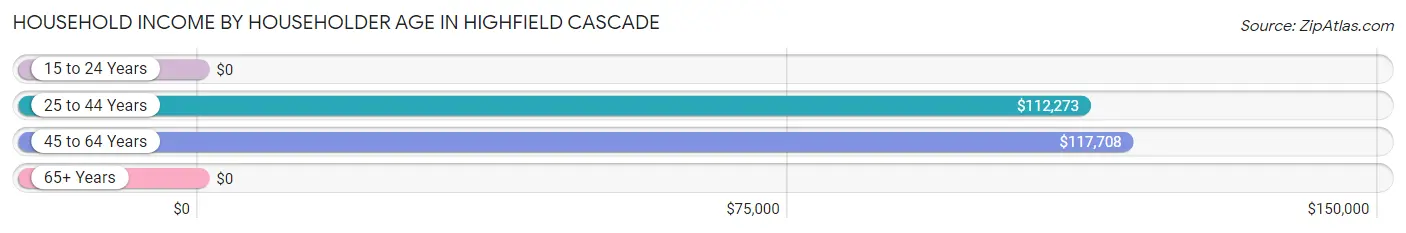
Household Income by Householder Age in Highfield Cascade
The median household income in Highfield Cascade is $73,854, with the highest median household income of $117,708 found in the 45 to 64 years age bracket for the primary householder. A total of 177 households (45.7%) fall into this category.
| Income Bracket | # Households | Median Income |
| 15 to 24 Years | 0 (0.0%) | $0 |
| 25 to 44 Years | 82 (21.2%) | $112,273 |
| 45 to 64 Years | 177 (45.7%) | $117,708 |
| 65+ Years | 128 (33.1%) | $0 |
| Total | 387 (100.0%) | $73,854 |
Poverty in Highfield Cascade
Income Below Poverty by Sex and Age in Highfield Cascade
With 3.9% poverty level for males and 7.8% for females among the residents of Highfield Cascade, 12 to 14 year old males and 65 to 74 year old females are the most vulnerable to poverty, with 6 males (100.0%) and 31 females (29.0%) in their respective age groups living below the poverty level.
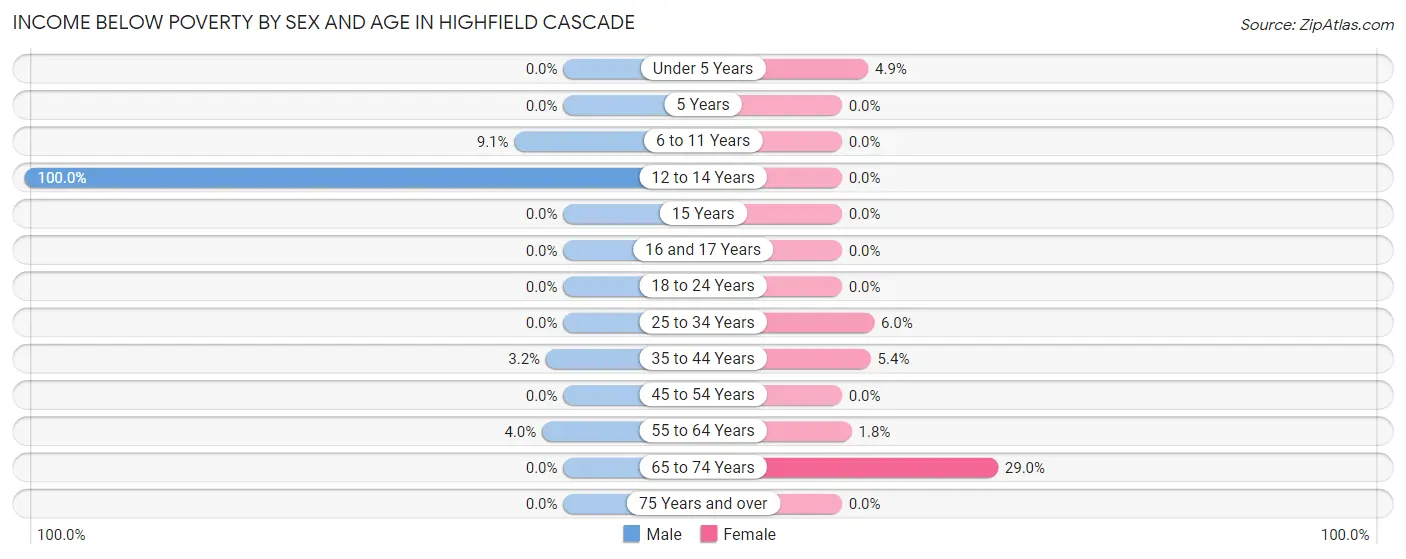
| Age Bracket | Male | Female |
| Under 5 Years | 0 (0.0%) | 2 (4.9%) |
| 5 Years | 0 (0.0%) | 0 (0.0%) |
| 6 to 11 Years | 6 (9.1%) | 0 (0.0%) |
| 12 to 14 Years | 6 (100.0%) | 0 (0.0%) |
| 15 Years | 0 (0.0%) | 0 (0.0%) |
| 16 and 17 Years | 0 (0.0%) | 0 (0.0%) |
| 18 to 24 Years | 0 (0.0%) | 0 (0.0%) |
| 25 to 34 Years | 0 (0.0%) | 4 (6.0%) |
| 35 to 44 Years | 3 (3.2%) | 3 (5.4%) |
| 45 to 54 Years | 0 (0.0%) | 0 (0.0%) |
| 55 to 64 Years | 4 (4.0%) | 2 (1.8%) |
| 65 to 74 Years | 0 (0.0%) | 31 (29.0%) |
| 75 Years and over | 0 (0.0%) | 0 (0.0%) |
| Total | 19 (3.9%) | 42 (7.8%) |
Income Above Poverty by Sex and Age in Highfield Cascade
According to the poverty statistics in Highfield Cascade, males aged under 5 years and females aged 6 to 11 years are the age groups that are most secure financially, with 100.0% of males and 100.0% of females in these age groups living above the poverty line.
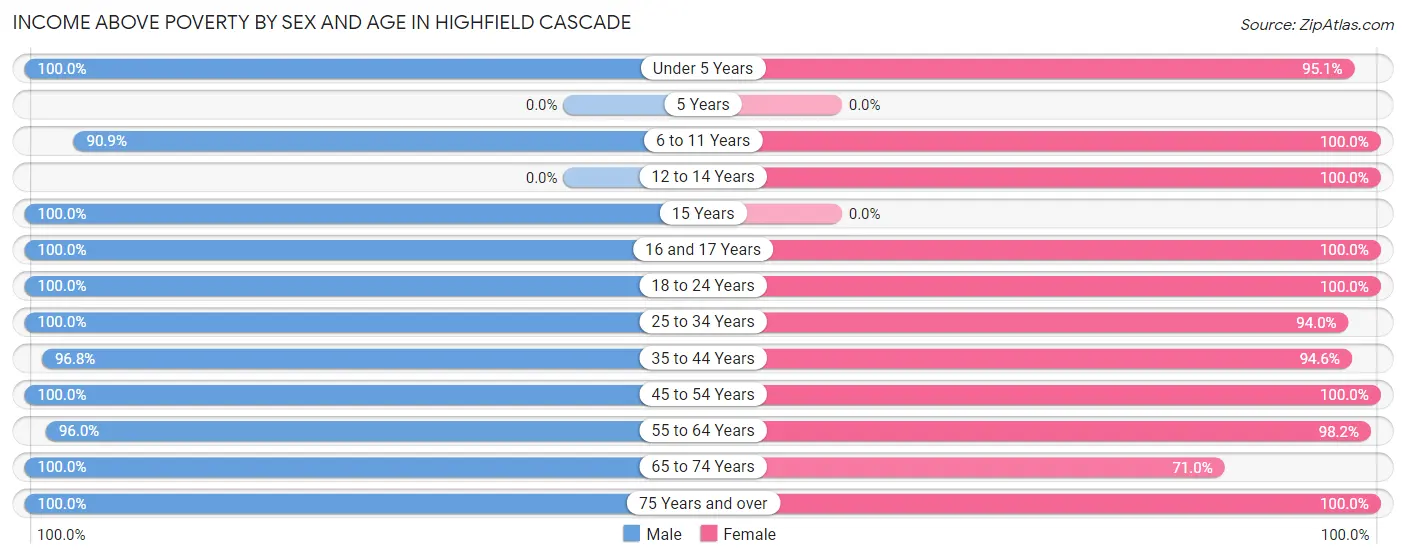
| Age Bracket | Male | Female |
| Under 5 Years | 9 (100.0%) | 39 (95.1%) |
| 5 Years | 0 (0.0%) | 0 (0.0%) |
| 6 to 11 Years | 60 (90.9%) | 52 (100.0%) |
| 12 to 14 Years | 0 (0.0%) | 21 (100.0%) |
| 15 Years | 8 (100.0%) | 0 (0.0%) |
| 16 and 17 Years | 8 (100.0%) | 14 (100.0%) |
| 18 to 24 Years | 88 (100.0%) | 13 (100.0%) |
| 25 to 34 Years | 30 (100.0%) | 63 (94.0%) |
| 35 to 44 Years | 90 (96.8%) | 53 (94.6%) |
| 45 to 54 Years | 44 (100.0%) | 33 (100.0%) |
| 55 to 64 Years | 97 (96.0%) | 108 (98.2%) |
| 65 to 74 Years | 14 (100.0%) | 76 (71.0%) |
| 75 Years and over | 24 (100.0%) | 26 (100.0%) |
| Total | 472 (96.1%) | 498 (92.2%) |
Income Below Poverty Among Married-Couple Families in Highfield Cascade
The poverty statistics for married-couple families in Highfield Cascade show that 1.7% or 3 of the total 179 families live below the poverty line. Families with 5 or more children have the highest poverty rate of 100.0%, comprising of 3 families. On the other hand, families with no children have the lowest poverty rate of 0.0%, which includes 0 families.
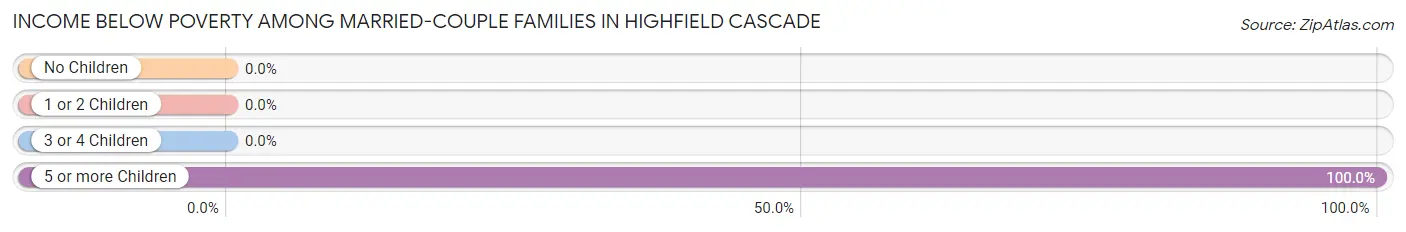
| Children | Above Poverty | Below Poverty |
| No Children | 98 (100.0%) | 0 (0.0%) |
| 1 or 2 Children | 53 (100.0%) | 0 (0.0%) |
| 3 or 4 Children | 25 (100.0%) | 0 (0.0%) |
| 5 or more Children | 0 (0.0%) | 3 (100.0%) |
| Total | 176 (98.3%) | 3 (1.7%) |
Income Below Poverty Among Single-Parent Households in Highfield Cascade
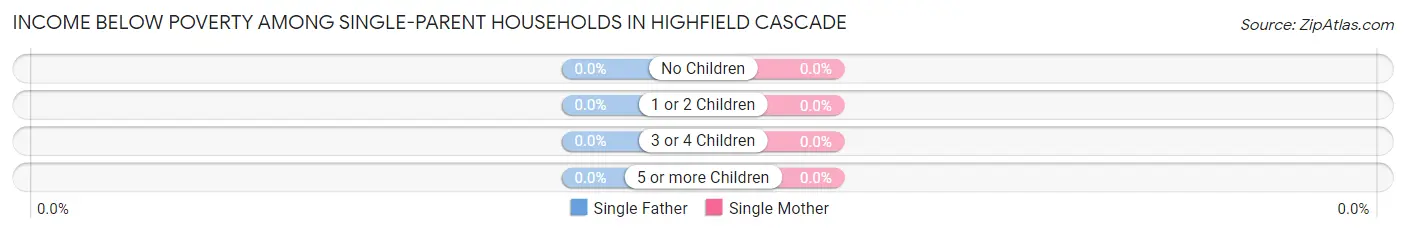
| Children | Single Father | Single Mother |
| No Children | 0 (0.0%) | 0 (0.0%) |
| 1 or 2 Children | 0 (0.0%) | 0 (0.0%) |
| 3 or 4 Children | 0 (0.0%) | 0 (0.0%) |
| 5 or more Children | 0 (0.0%) | 0 (0.0%) |
| Total | 0 (0.0%) | 0 (0.0%) |
Income Below Poverty Among Married-Couple vs Single-Parent Households in Highfield Cascade
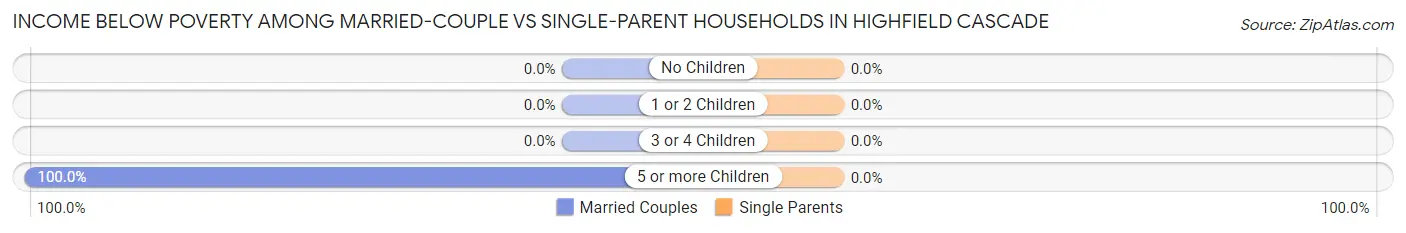
| Children | Married-Couple Families | Single-Parent Households |
| No Children | 0 (0.0%) | 0 (0.0%) |
| 1 or 2 Children | 0 (0.0%) | 0 (0.0%) |
| 3 or 4 Children | 0 (0.0%) | 0 (0.0%) |
| 5 or more Children | 3 (100.0%) | 0 (0.0%) |
| Total | 3 (1.7%) | 0 (0.0%) |
Employment Characteristics in Highfield Cascade
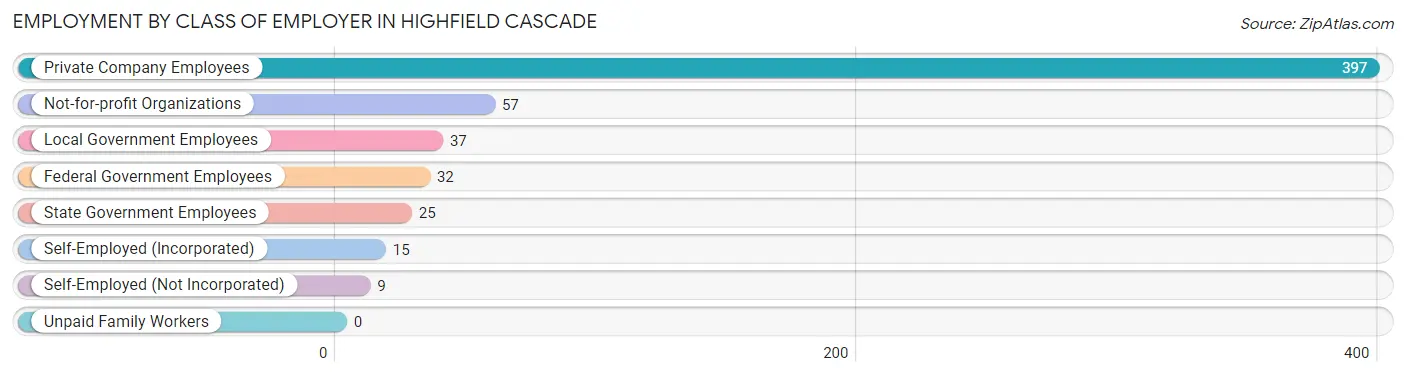
Employment by Class of Employer in Highfield Cascade
Among the 572 employed individuals in Highfield Cascade, private company employees (397 | 69.4%), not-for-profit organizations (57 | 10.0%), and local government employees (37 | 6.5%) make up the most common classes of employment.
| Employer Class | # Employees | % Employees |
| Private Company Employees | 397 | 69.4% |
| Self-Employed (Incorporated) | 15 | 2.6% |
| Self-Employed (Not Incorporated) | 9 | 1.6% |
| Not-for-profit Organizations | 57 | 10.0% |
| Local Government Employees | 37 | 6.5% |
| State Government Employees | 25 | 4.4% |
| Federal Government Employees | 32 | 5.6% |
| Unpaid Family Workers | 0 | 0.0% |
| Total | 572 | 100.0% |
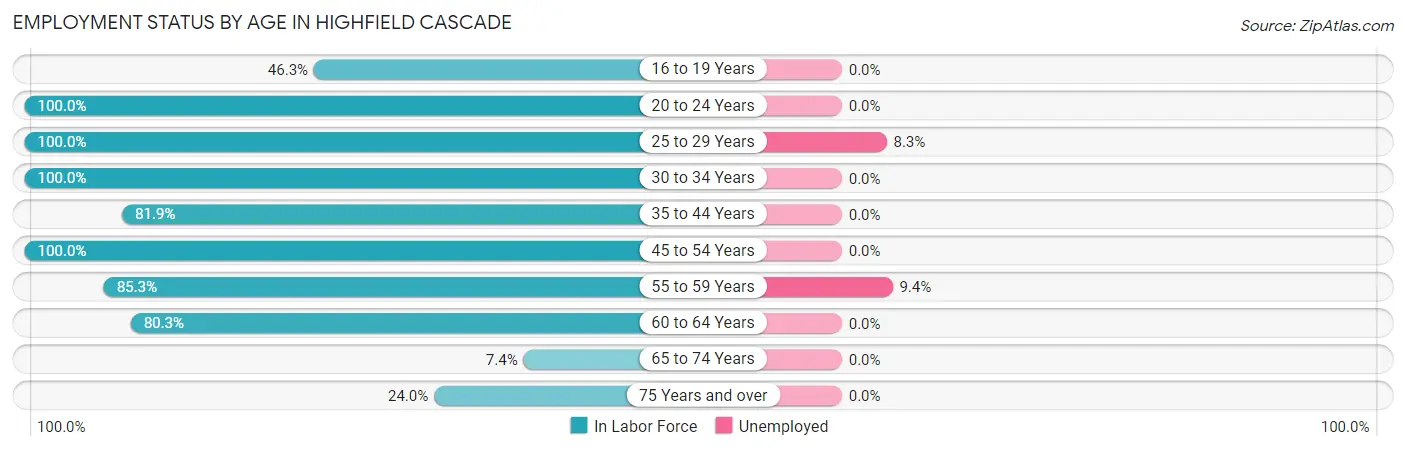
Employment Status by Age in Highfield Cascade
According to the labor force statistics for Highfield Cascade, out of the total population over 16 years of age (828), 71.9% or 595 individuals are in the labor force, with 2.7% or 16 of them unemployed. The age group with the highest labor force participation rate is 20 to 24 years, with 100.0% or 82 individuals in the labor force. Within the labor force, the 55 to 59 years age range has the highest percentage of unemployed individuals, with 9.4% or 12 of them being unemployed.
| Age Bracket | In Labor Force | Unemployed |
| 16 to 19 Years | 19 (46.3%) | 0 (0.0%) |
| 20 to 24 Years | 82 (100.0%) | 0 (0.0%) |
| 25 to 29 Years | 48 (100.0%) | 4 (8.3%) |
| 30 to 34 Years | 49 (100.0%) | 0 (0.0%) |
| 35 to 44 Years | 122 (81.9%) | 0 (0.0%) |
| 45 to 54 Years | 77 (100.0%) | 0 (0.0%) |
| 55 to 59 Years | 128 (85.3%) | 12 (9.4%) |
| 60 to 64 Years | 49 (80.3%) | 0 (0.0%) |
| 65 to 74 Years | 9 (7.4%) | 0 (0.0%) |
| 75 Years and over | 12 (24.0%) | 0 (0.0%) |
| Total | 595 (71.9%) | 16 (2.7%) |
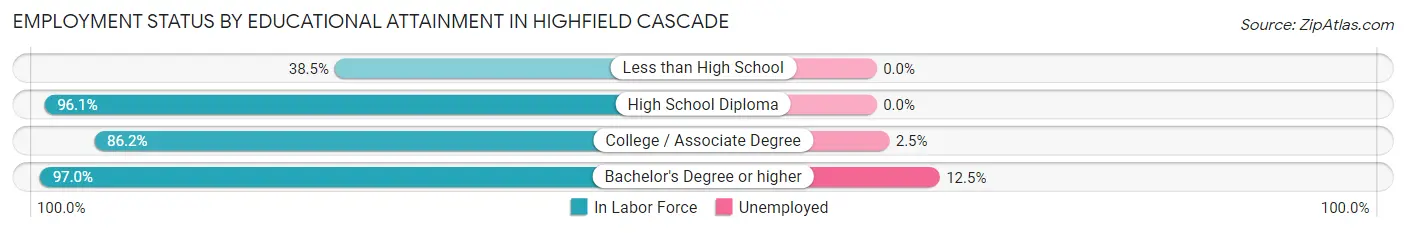
Employment Status by Educational Attainment in Highfield Cascade
According to labor force statistics for Highfield Cascade, 88.6% of individuals (473) out of the total population between 25 and 64 years of age (534) are in the labor force, with 3.4% or 16 of them being unemployed. The group with the highest labor force participation rate are those with the educational attainment of bachelor's degree or higher, with 97.0% or 96 individuals in the labor force. Within the labor force, individuals with bachelor's degree or higher education have the highest percentage of unemployment, with 12.5% or 12 of them being unemployed.
| Educational Attainment | In Labor Force | Unemployed |
| Less than High School | 15 (38.5%) | 0 (0.0%) |
| High School Diploma | 199 (96.1%) | 0 (0.0%) |
| College / Associate Degree | 163 (86.2%) | 5 (2.5%) |
| Bachelor's Degree or higher | 96 (97.0%) | 12 (12.5%) |
| Total | 473 (88.6%) | 18 (3.4%) |
Employment Occupations by Sex in Highfield Cascade
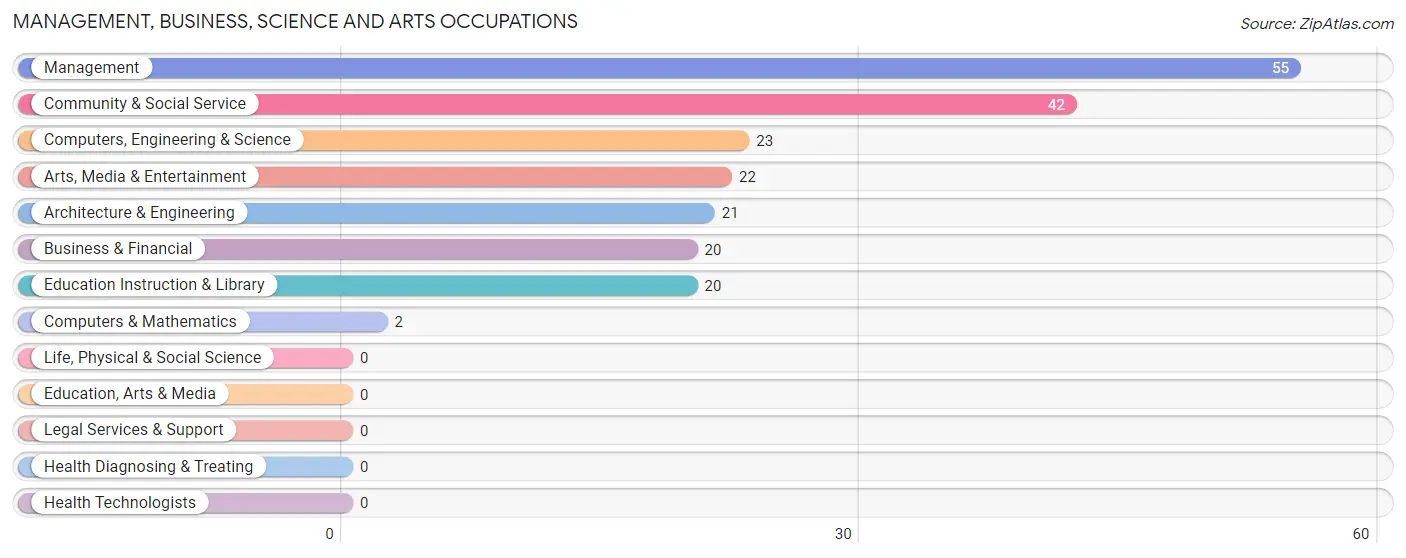
Management, Business, Science and Arts Occupations
The most common Management, Business, Science and Arts occupations in Highfield Cascade are Management (55 | 9.5%), Community & Social Service (42 | 7.2%), Computers, Engineering & Science (23 | 4.0%), Arts, Media & Entertainment (22 | 3.8%), and Architecture & Engineering (21 | 3.6%).
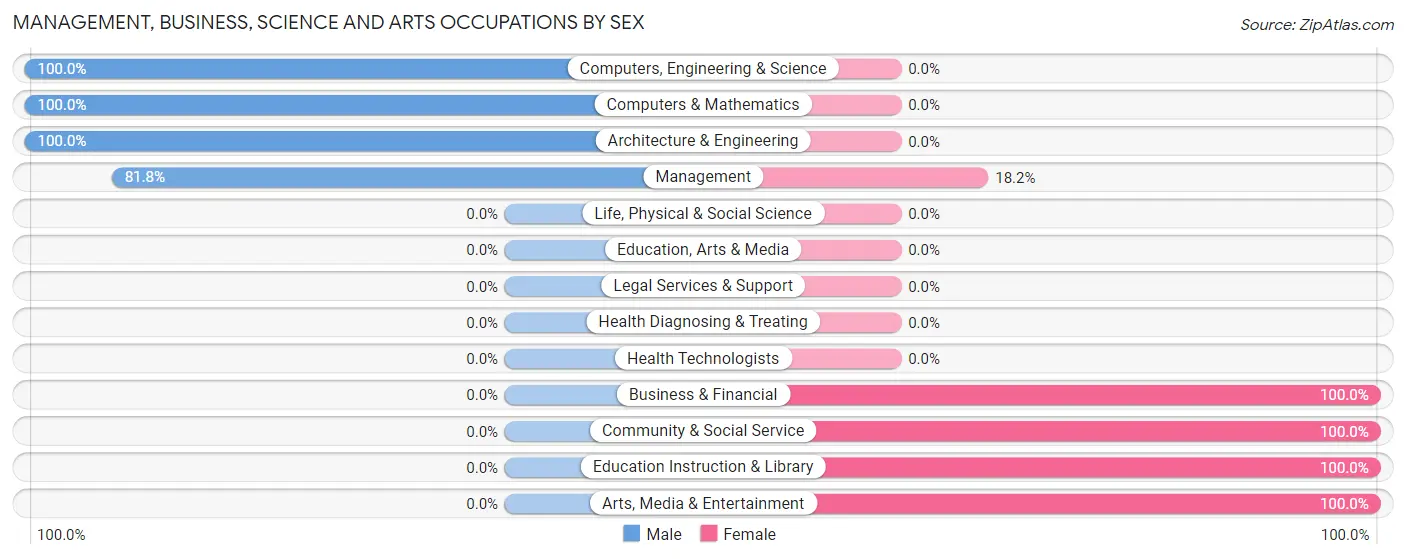
Management, Business, Science and Arts Occupations by Sex
Within the Management, Business, Science and Arts occupations in Highfield Cascade, the most male-oriented occupations are Computers, Engineering & Science (100.0%), Computers & Mathematics (100.0%), and Architecture & Engineering (100.0%), while the most female-oriented occupations are Business & Financial (100.0%), Community & Social Service (100.0%), and Education Instruction & Library (100.0%).
| Occupation | Male | Female |
| Management | 45 (81.8%) | 10 (18.2%) |
| Business & Financial | 0 (0.0%) | 20 (100.0%) |
| Computers, Engineering & Science | 23 (100.0%) | 0 (0.0%) |
| Computers & Mathematics | 2 (100.0%) | 0 (0.0%) |
| Architecture & Engineering | 21 (100.0%) | 0 (0.0%) |
| Life, Physical & Social Science | 0 (0.0%) | 0 (0.0%) |
| Community & Social Service | 0 (0.0%) | 42 (100.0%) |
| Education, Arts & Media | 0 (0.0%) | 0 (0.0%) |
| Legal Services & Support | 0 (0.0%) | 0 (0.0%) |
| Education Instruction & Library | 0 (0.0%) | 20 (100.0%) |
| Arts, Media & Entertainment | 0 (0.0%) | 22 (100.0%) |
| Health Diagnosing & Treating | 0 (0.0%) | 0 (0.0%) |
| Health Technologists | 0 (0.0%) | 0 (0.0%) |
| Total (Category) | 68 (48.6%) | 72 (51.4%) |
| Total (Overall) | 342 (59.1%) | 237 (40.9%) |
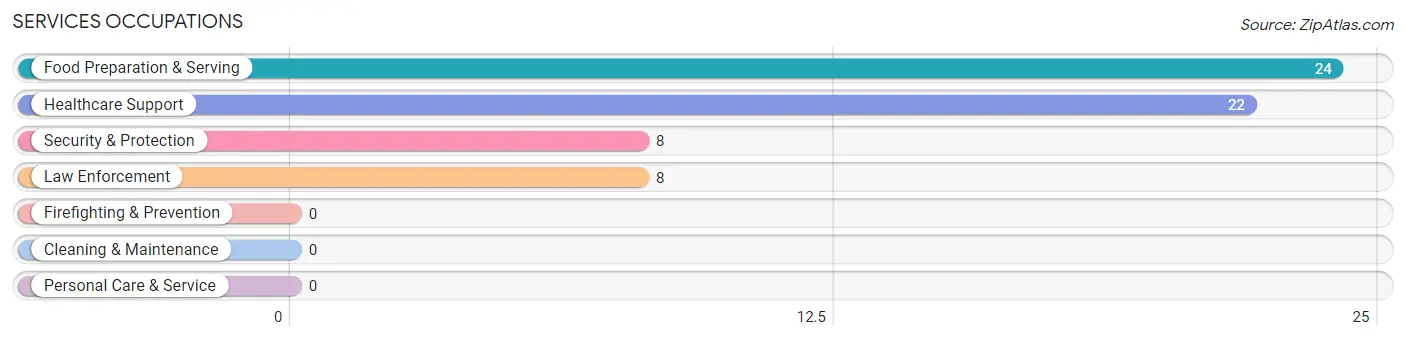
Services Occupations
The most common Services occupations in Highfield Cascade are Food Preparation & Serving (24 | 4.2%), Healthcare Support (22 | 3.8%), Security & Protection (8 | 1.4%), and Law Enforcement (8 | 1.4%).
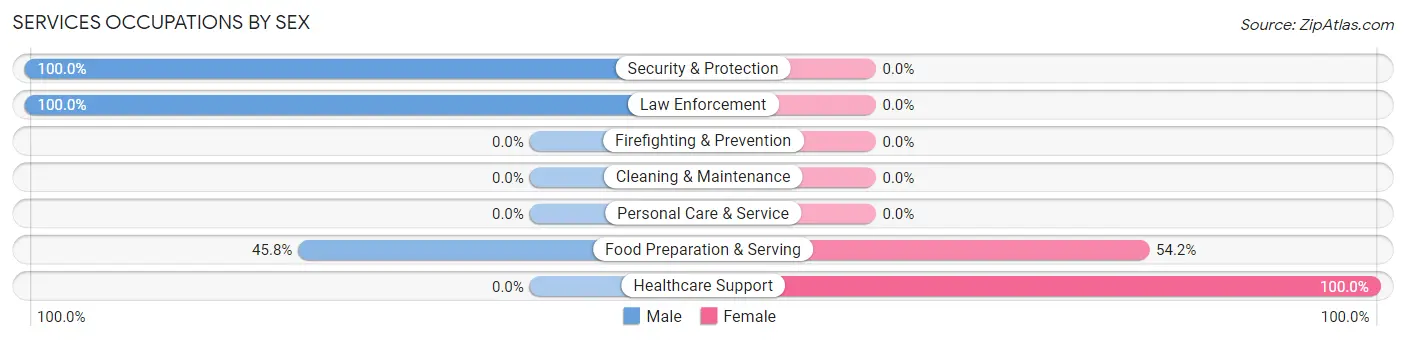
Services Occupations by Sex
Within the Services occupations in Highfield Cascade, the most male-oriented occupations are Security & Protection (100.0%), Law Enforcement (100.0%), and Food Preparation & Serving (45.8%), while the most female-oriented occupations are Healthcare Support (100.0%), and Food Preparation & Serving (54.2%).
| Occupation | Male | Female |
| Healthcare Support | 0 (0.0%) | 22 (100.0%) |
| Security & Protection | 8 (100.0%) | 0 (0.0%) |
| Firefighting & Prevention | 0 (0.0%) | 0 (0.0%) |
| Law Enforcement | 8 (100.0%) | 0 (0.0%) |
| Food Preparation & Serving | 11 (45.8%) | 13 (54.2%) |
| Cleaning & Maintenance | 0 (0.0%) | 0 (0.0%) |
| Personal Care & Service | 0 (0.0%) | 0 (0.0%) |
| Total (Category) | 19 (35.2%) | 35 (64.8%) |
| Total (Overall) | 342 (59.1%) | 237 (40.9%) |
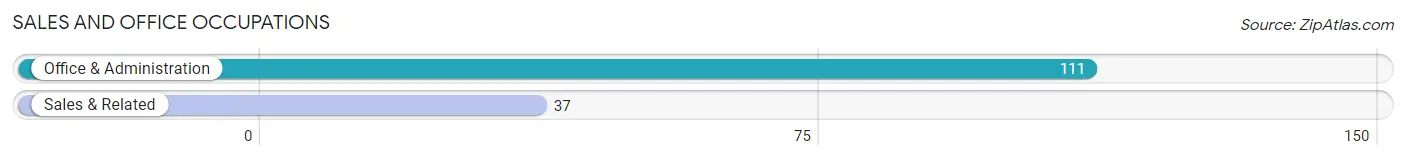
Sales and Office Occupations
The most common Sales and Office occupations in Highfield Cascade are Office & Administration (111 | 19.2%), and Sales & Related (37 | 6.4%).
Sales and Office Occupations by Sex
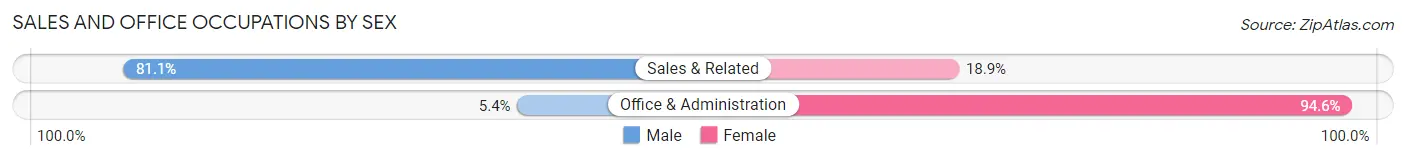
| Occupation | Male | Female |
| Sales & Related | 30 (81.1%) | 7 (18.9%) |
| Office & Administration | 6 (5.4%) | 105 (94.6%) |
| Total (Category) | 36 (24.3%) | 112 (75.7%) |
| Total (Overall) | 342 (59.1%) | 237 (40.9%) |
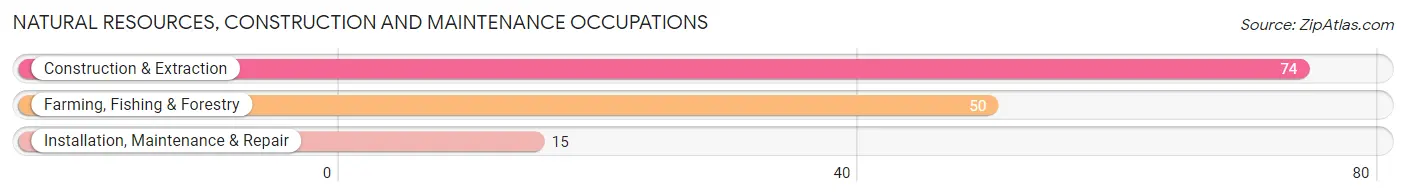
Natural Resources, Construction and Maintenance Occupations
The most common Natural Resources, Construction and Maintenance occupations in Highfield Cascade are Construction & Extraction (74 | 12.8%), Farming, Fishing & Forestry (50 | 8.6%), and Installation, Maintenance & Repair (15 | 2.6%).
Natural Resources, Construction and Maintenance Occupations by Sex
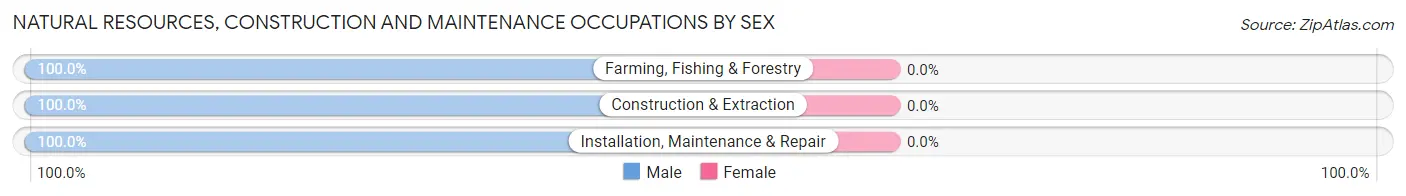
| Occupation | Male | Female |
| Farming, Fishing & Forestry | 50 (100.0%) | 0 (0.0%) |
| Construction & Extraction | 74 (100.0%) | 0 (0.0%) |
| Installation, Maintenance & Repair | 15 (100.0%) | 0 (0.0%) |
| Total (Category) | 139 (100.0%) | 0 (0.0%) |
| Total (Overall) | 342 (59.1%) | 237 (40.9%) |
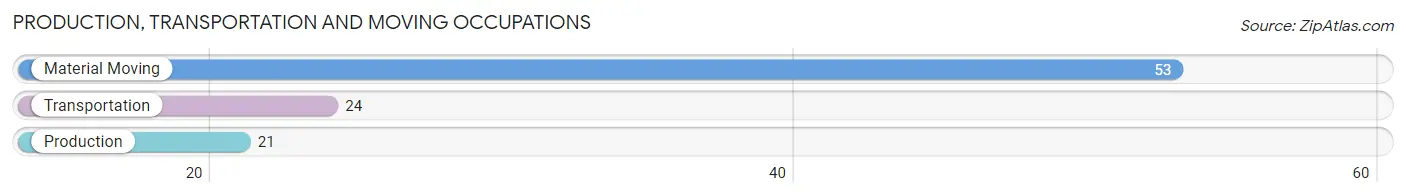
Production, Transportation and Moving Occupations
The most common Production, Transportation and Moving occupations in Highfield Cascade are Material Moving (53 | 9.1%), Transportation (24 | 4.2%), and Production (21 | 3.6%).
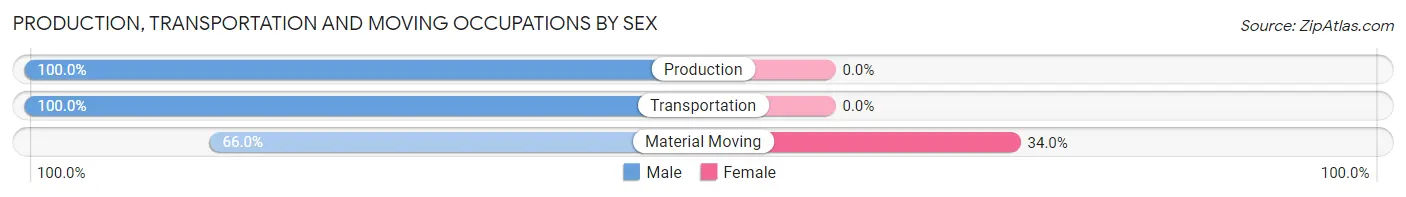
Production, Transportation and Moving Occupations by Sex
| Occupation | Male | Female |
| Production | 21 (100.0%) | 0 (0.0%) |
| Transportation | 24 (100.0%) | 0 (0.0%) |
| Material Moving | 35 (66.0%) | 18 (34.0%) |
| Total (Category) | 80 (81.6%) | 18 (18.4%) |
| Total (Overall) | 342 (59.1%) | 237 (40.9%) |
Employment Industries by Sex in Highfield Cascade
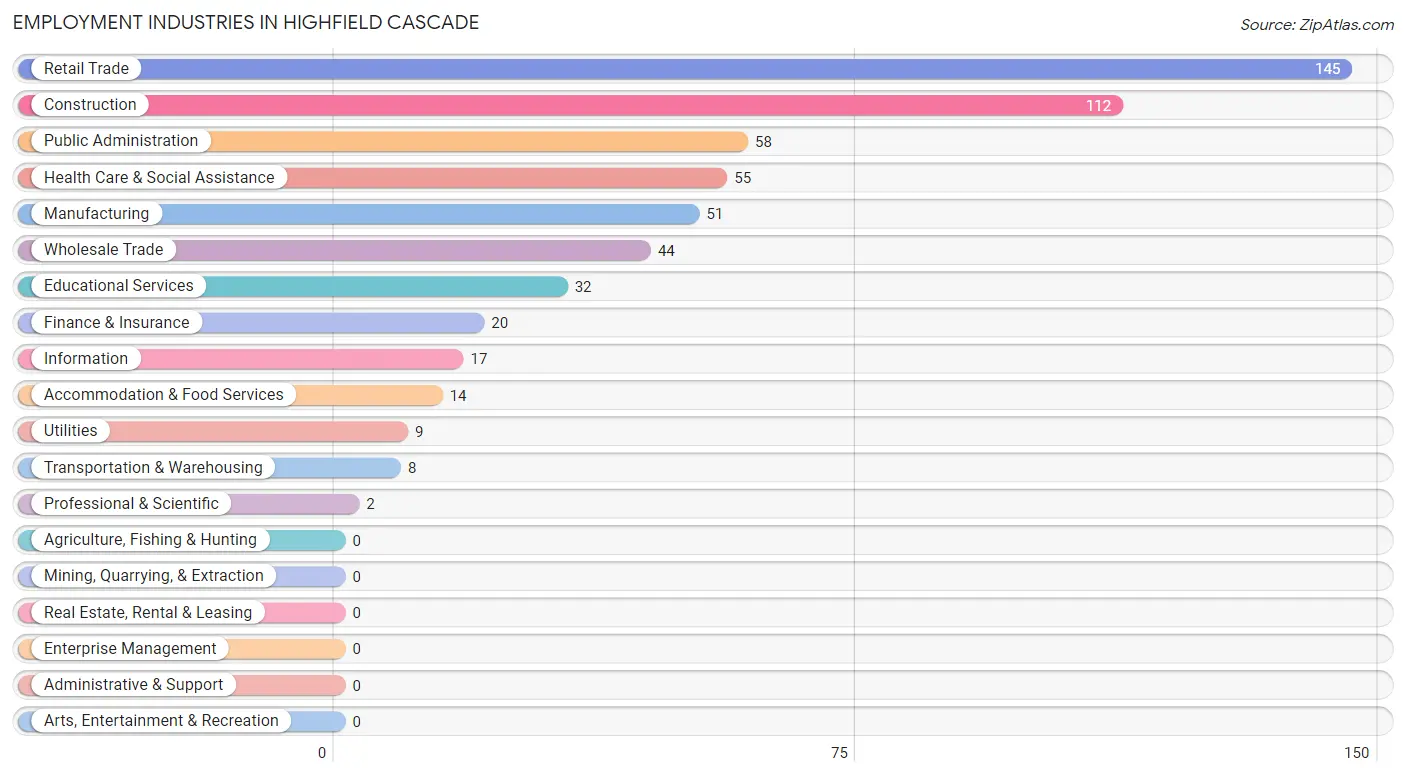
Employment Industries in Highfield Cascade
The major employment industries in Highfield Cascade include Retail Trade (145 | 25.0%), Construction (112 | 19.3%), Public Administration (58 | 10.0%), Health Care & Social Assistance (55 | 9.5%), and Manufacturing (51 | 8.8%).
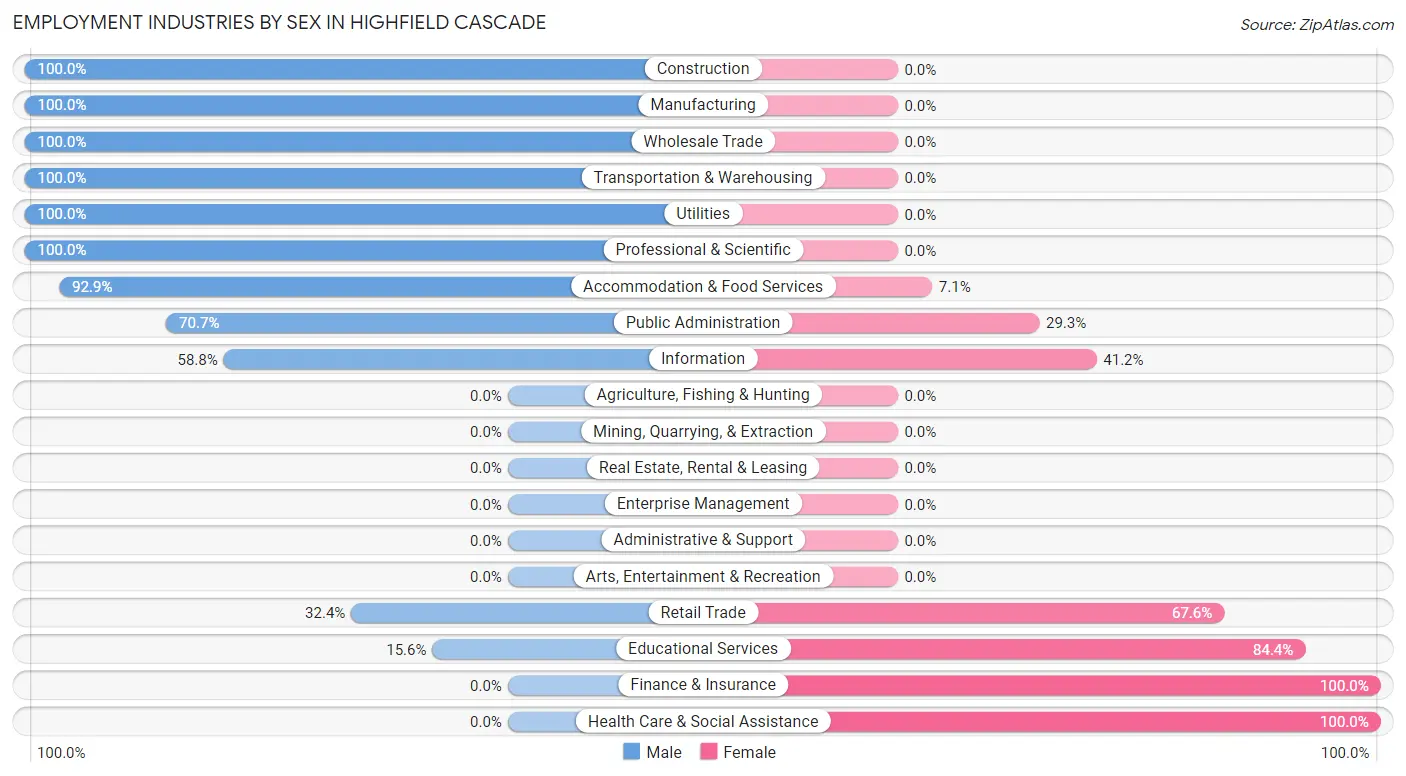
Employment Industries by Sex in Highfield Cascade
The Highfield Cascade industries that see more men than women are Construction (100.0%), Manufacturing (100.0%), and Wholesale Trade (100.0%), whereas the industries that tend to have a higher number of women are Finance & Insurance (100.0%), Health Care & Social Assistance (100.0%), and Educational Services (84.4%).
| Industry | Male | Female |
| Agriculture, Fishing & Hunting | 0 (0.0%) | 0 (0.0%) |
| Mining, Quarrying, & Extraction | 0 (0.0%) | 0 (0.0%) |
| Construction | 112 (100.0%) | 0 (0.0%) |
| Manufacturing | 51 (100.0%) | 0 (0.0%) |
| Wholesale Trade | 44 (100.0%) | 0 (0.0%) |
| Retail Trade | 47 (32.4%) | 98 (67.6%) |
| Transportation & Warehousing | 8 (100.0%) | 0 (0.0%) |
| Utilities | 9 (100.0%) | 0 (0.0%) |
| Information | 10 (58.8%) | 7 (41.2%) |
| Finance & Insurance | 0 (0.0%) | 20 (100.0%) |
| Real Estate, Rental & Leasing | 0 (0.0%) | 0 (0.0%) |
| Professional & Scientific | 2 (100.0%) | 0 (0.0%) |
| Enterprise Management | 0 (0.0%) | 0 (0.0%) |
| Administrative & Support | 0 (0.0%) | 0 (0.0%) |
| Educational Services | 5 (15.6%) | 27 (84.4%) |
| Health Care & Social Assistance | 0 (0.0%) | 55 (100.0%) |
| Arts, Entertainment & Recreation | 0 (0.0%) | 0 (0.0%) |
| Accommodation & Food Services | 13 (92.9%) | 1 (7.1%) |
| Public Administration | 41 (70.7%) | 17 (29.3%) |
| Total | 342 (59.1%) | 237 (40.9%) |
Education in Highfield Cascade
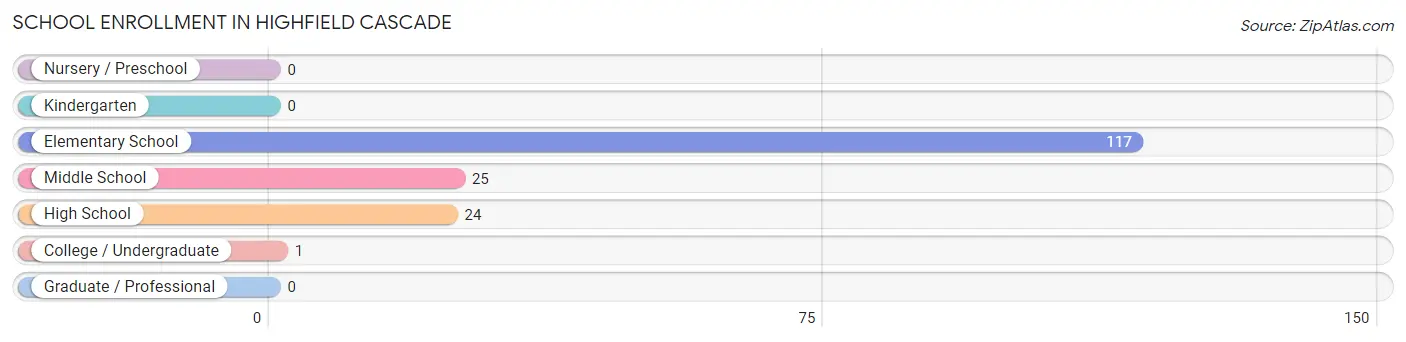
School Enrollment in Highfield Cascade
The most common levels of schooling among the 167 students in Highfield Cascade are elementary school (117 | 70.1%), middle school (25 | 15.0%), and high school (24 | 14.4%).
| School Level | # Students | % Students |
| Nursery / Preschool | 0 | 0.0% |
| Kindergarten | 0 | 0.0% |
| Elementary School | 117 | 70.1% |
| Middle School | 25 | 15.0% |
| High School | 24 | 14.4% |
| College / Undergraduate | 1 | 0.6% |
| Graduate / Professional | 0 | 0.0% |
| Total | 167 | 100.0% |
School Enrollment by Age by Funding Source in Highfield Cascade
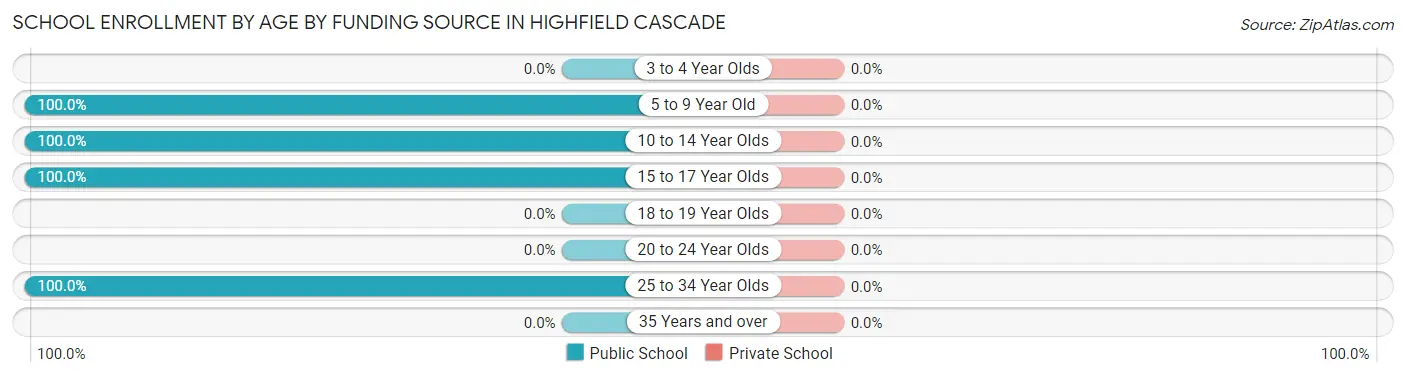
| Age Bracket | Public School | Private School |
| 3 to 4 Year Olds | 0 (0.0%) | 0 (0.0%) |
| 5 to 9 Year Old | 84 (100.0%) | 0 (0.0%) |
| 10 to 14 Year Olds | 61 (100.0%) | 0 (0.0%) |
| 15 to 17 Year Olds | 21 (100.0%) | 0 (0.0%) |
| 18 to 19 Year Olds | 0 (0.0%) | 0 (0.0%) |
| 20 to 24 Year Olds | 0 (0.0%) | 0 (0.0%) |
| 25 to 34 Year Olds | 1 (100.0%) | 0 (0.0%) |
| 35 Years and over | 0 (0.0%) | 0 (0.0%) |
| Total | 167 (100.0%) | 0 (0.0%) |
Educational Attainment by Field of Study in Highfield Cascade
Communications (32 | 25.4%), social sciences (21 | 16.7%), arts & humanities (17 | 13.5%), engineering (16 | 12.7%), and education (12 | 9.5%) are the most common fields of study among 126 individuals in Highfield Cascade who have obtained a bachelor's degree or higher.
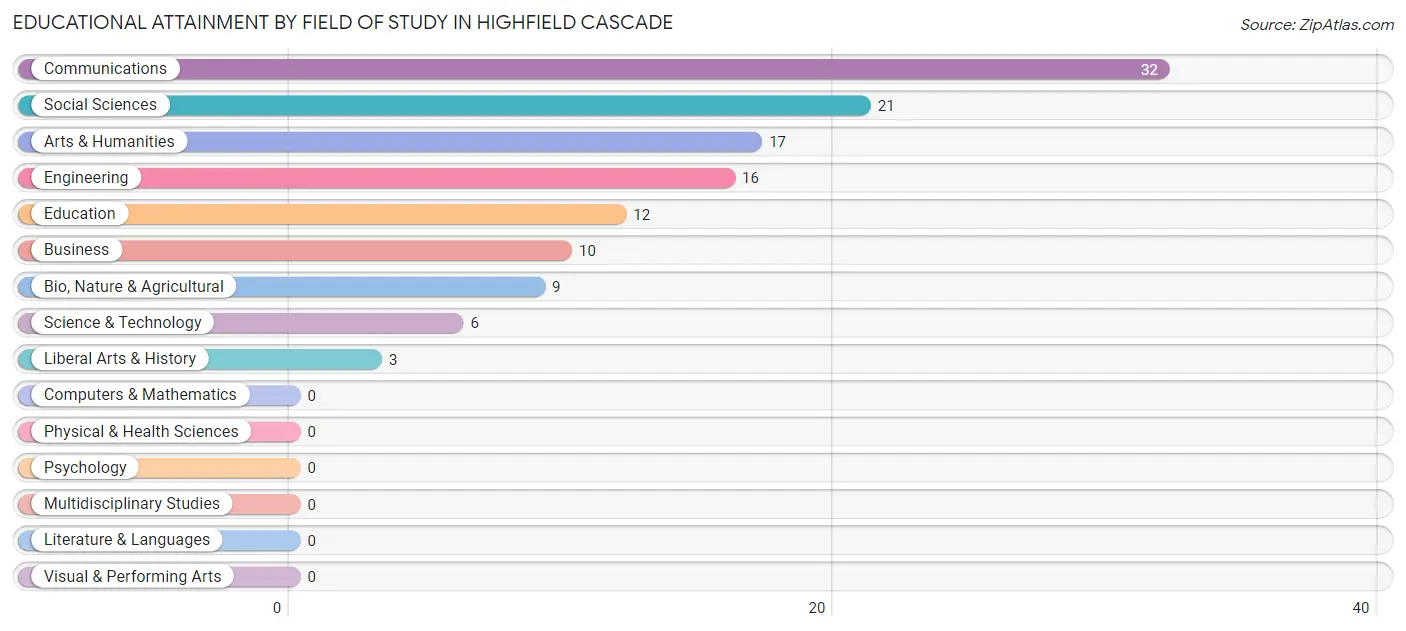
| Field of Study | # Graduates | % Graduates |
| Computers & Mathematics | 0 | 0.0% |
| Bio, Nature & Agricultural | 9 | 7.1% |
| Physical & Health Sciences | 0 | 0.0% |
| Psychology | 0 | 0.0% |
| Social Sciences | 21 | 16.7% |
| Engineering | 16 | 12.7% |
| Multidisciplinary Studies | 0 | 0.0% |
| Science & Technology | 6 | 4.8% |
| Business | 10 | 7.9% |
| Education | 12 | 9.5% |
| Literature & Languages | 0 | 0.0% |
| Liberal Arts & History | 3 | 2.4% |
| Visual & Performing Arts | 0 | 0.0% |
| Communications | 32 | 25.4% |
| Arts & Humanities | 17 | 13.5% |
| Total | 126 | 100.0% |
Transportation & Commute in Highfield Cascade
Vehicle Availability by Sex in Highfield Cascade
The most prevalent vehicle ownership categories in Highfield Cascade are males with 3 vehicles (86, accounting for 25.2%) and females with 3 vehicles (78, making up 37.4%).
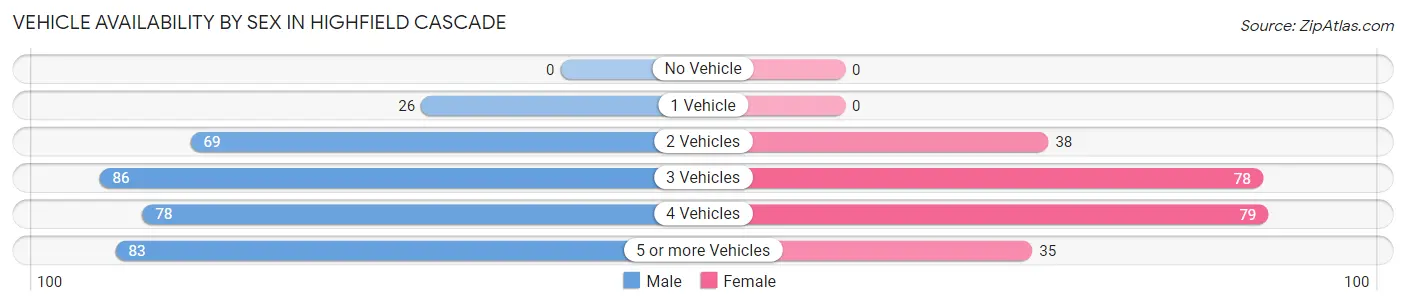
| Vehicles Available | Male | Female |
| No Vehicle | 0 (0.0%) | 0 (0.0%) |
| 1 Vehicle | 26 (7.6%) | 0 (0.0%) |
| 2 Vehicles | 69 (20.2%) | 38 (16.5%) |
| 3 Vehicles | 86 (25.2%) | 78 (33.9%) |
| 4 Vehicles | 78 (22.8%) | 79 (34.4%) |
| 5 or more Vehicles | 83 (24.3%) | 35 (15.2%) |
| Total | 342 (100.0%) | 230 (100.0%) |
Commute Time in Highfield Cascade
The most frequently occuring commute durations in Highfield Cascade are 60 to 89 minutes (72 commuters, 15.4%), 45 to 59 minutes (66 commuters, 14.2%), and 15 to 19 minutes (60 commuters, 12.9%).
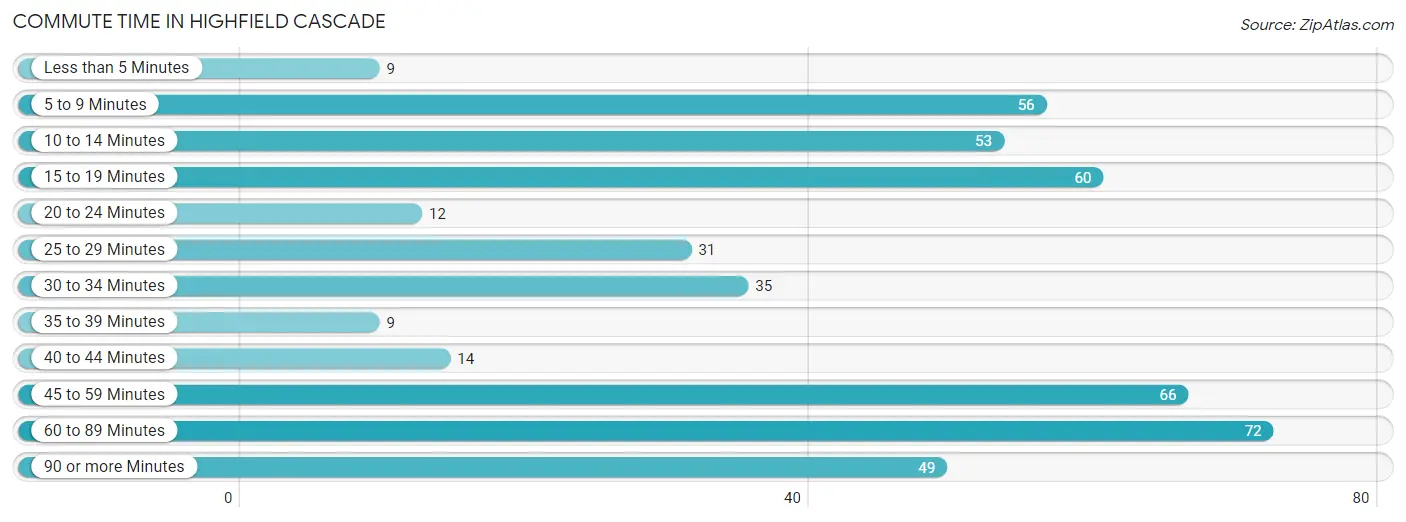
| Commute Time | # Commuters | % Commuters |
| Less than 5 Minutes | 9 | 1.9% |
| 5 to 9 Minutes | 56 | 12.0% |
| 10 to 14 Minutes | 53 | 11.4% |
| 15 to 19 Minutes | 60 | 12.9% |
| 20 to 24 Minutes | 12 | 2.6% |
| 25 to 29 Minutes | 31 | 6.7% |
| 30 to 34 Minutes | 35 | 7.5% |
| 35 to 39 Minutes | 9 | 1.9% |
| 40 to 44 Minutes | 14 | 3.0% |
| 45 to 59 Minutes | 66 | 14.2% |
| 60 to 89 Minutes | 72 | 15.4% |
| 90 or more Minutes | 49 | 10.5% |
Commute Time by Sex in Highfield Cascade
The most common commute times in Highfield Cascade are 60 to 89 minutes (54 commuters, 20.4%) for males and 5 to 9 minutes (56 commuters, 27.7%) for females.
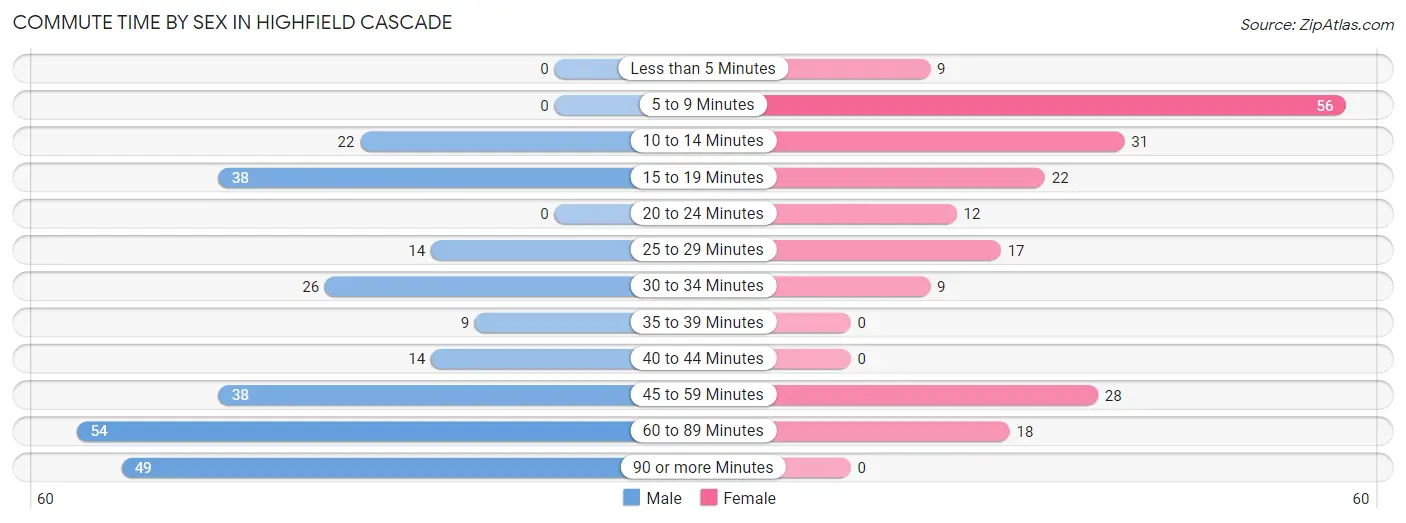
| Commute Time | Male | Female |
| Less than 5 Minutes | 0 (0.0%) | 9 (4.5%) |
| 5 to 9 Minutes | 0 (0.0%) | 56 (27.7%) |
| 10 to 14 Minutes | 22 (8.3%) | 31 (15.3%) |
| 15 to 19 Minutes | 38 (14.4%) | 22 (10.9%) |
| 20 to 24 Minutes | 0 (0.0%) | 12 (5.9%) |
| 25 to 29 Minutes | 14 (5.3%) | 17 (8.4%) |
| 30 to 34 Minutes | 26 (9.9%) | 9 (4.5%) |
| 35 to 39 Minutes | 9 (3.4%) | 0 (0.0%) |
| 40 to 44 Minutes | 14 (5.3%) | 0 (0.0%) |
| 45 to 59 Minutes | 38 (14.4%) | 28 (13.9%) |
| 60 to 89 Minutes | 54 (20.4%) | 18 (8.9%) |
| 90 or more Minutes | 49 (18.6%) | 0 (0.0%) |
Time of Departure to Work by Sex in Highfield Cascade
The most frequent times of departure to work in Highfield Cascade are 6:00 AM to 6:29 AM (50, 18.9%) for males and 7:30 AM to 7:59 AM (61, 30.2%) for females.
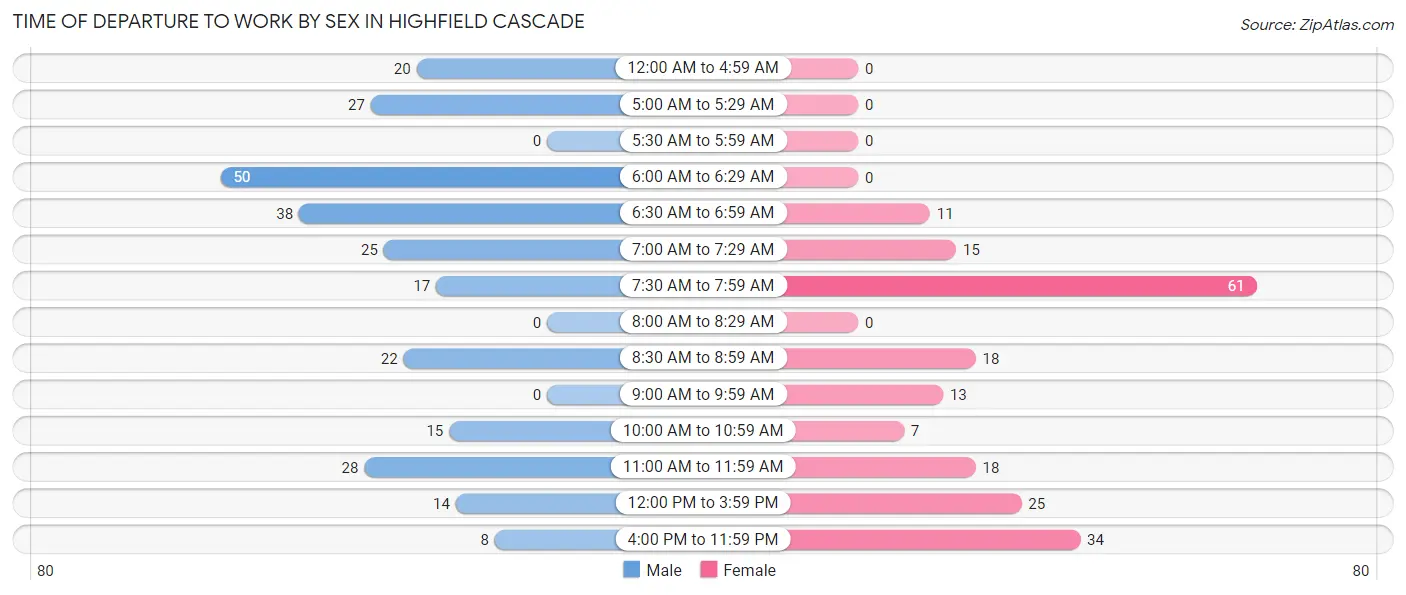
| Time of Departure | Male | Female |
| 12:00 AM to 4:59 AM | 20 (7.6%) | 0 (0.0%) |
| 5:00 AM to 5:29 AM | 27 (10.2%) | 0 (0.0%) |
| 5:30 AM to 5:59 AM | 0 (0.0%) | 0 (0.0%) |
| 6:00 AM to 6:29 AM | 50 (18.9%) | 0 (0.0%) |
| 6:30 AM to 6:59 AM | 38 (14.4%) | 11 (5.4%) |
| 7:00 AM to 7:29 AM | 25 (9.5%) | 15 (7.4%) |
| 7:30 AM to 7:59 AM | 17 (6.4%) | 61 (30.2%) |
| 8:00 AM to 8:29 AM | 0 (0.0%) | 0 (0.0%) |
| 8:30 AM to 8:59 AM | 22 (8.3%) | 18 (8.9%) |
| 9:00 AM to 9:59 AM | 0 (0.0%) | 13 (6.4%) |
| 10:00 AM to 10:59 AM | 15 (5.7%) | 7 (3.5%) |
| 11:00 AM to 11:59 AM | 28 (10.6%) | 18 (8.9%) |
| 12:00 PM to 3:59 PM | 14 (5.3%) | 25 (12.4%) |
| 4:00 PM to 11:59 PM | 8 (3.0%) | 34 (16.8%) |
| Total | 264 (100.0%) | 202 (100.0%) |
Housing Occupancy in Highfield Cascade
Occupancy by Ownership in Highfield Cascade
Of the total 387 dwellings in Highfield Cascade, owner-occupied units account for 358 (92.5%), while renter-occupied units make up 29 (7.5%).
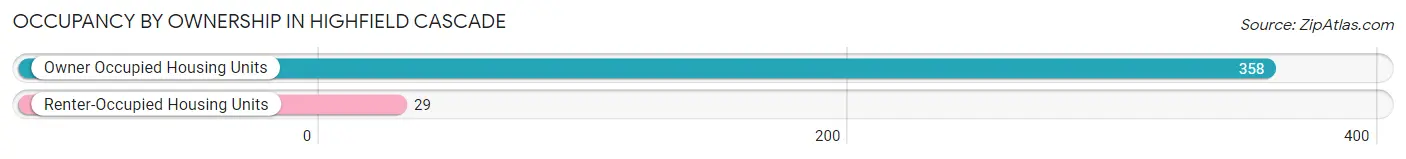
| Occupancy | # Housing Units | % Housing Units |
| Owner Occupied Housing Units | 358 | 92.5% |
| Renter-Occupied Housing Units | 29 | 7.5% |
| Total Occupied Housing Units | 387 | 100.0% |
Occupancy by Household Size in Highfield Cascade
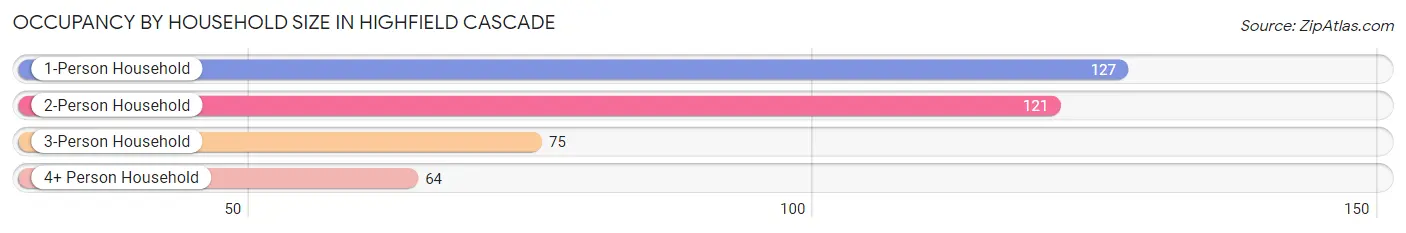
| Household Size | # Housing Units | % Housing Units |
| 1-Person Household | 127 | 32.8% |
| 2-Person Household | 121 | 31.3% |
| 3-Person Household | 75 | 19.4% |
| 4+ Person Household | 64 | 16.5% |
| Total Housing Units | 387 | 100.0% |
Occupancy by Ownership by Household Size in Highfield Cascade
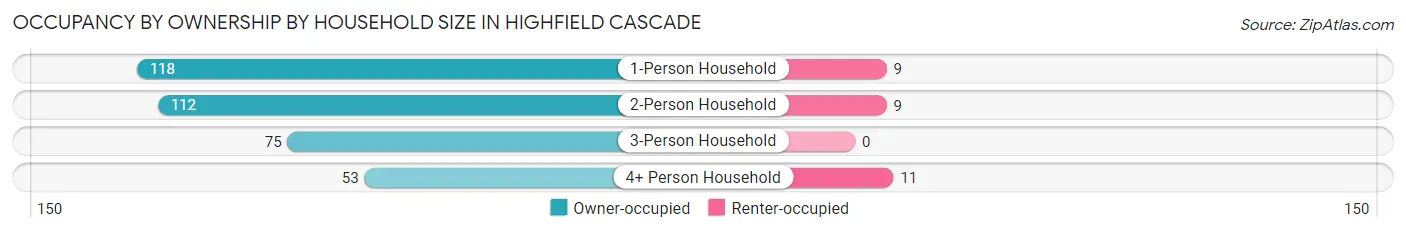
| Household Size | Owner-occupied | Renter-occupied |
| 1-Person Household | 118 (92.9%) | 9 (7.1%) |
| 2-Person Household | 112 (92.6%) | 9 (7.4%) |
| 3-Person Household | 75 (100.0%) | 0 (0.0%) |
| 4+ Person Household | 53 (82.8%) | 11 (17.2%) |
| Total Housing Units | 358 (92.5%) | 29 (7.5%) |
Occupancy by Educational Attainment in Highfield Cascade
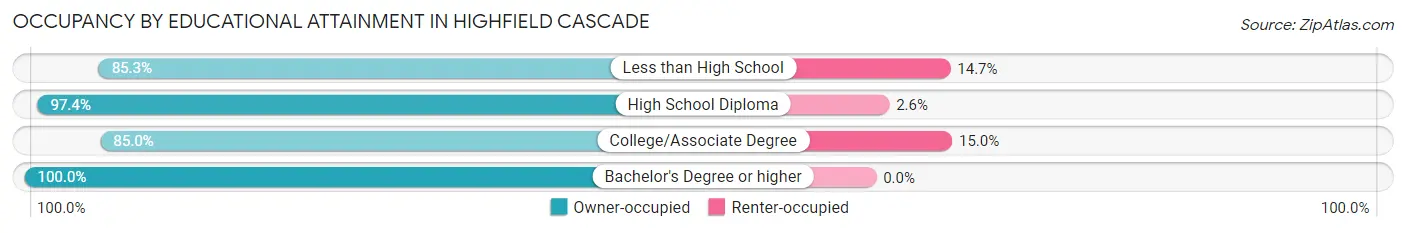
| Household Size | Owner-occupied | Renter-occupied |
| Less than High School | 29 (85.3%) | 5 (14.7%) |
| High School Diploma | 151 (97.4%) | 4 (2.6%) |
| College/Associate Degree | 113 (85.0%) | 20 (15.0%) |
| Bachelor's Degree or higher | 65 (100.0%) | 0 (0.0%) |
Occupancy by Age of Householder in Highfield Cascade
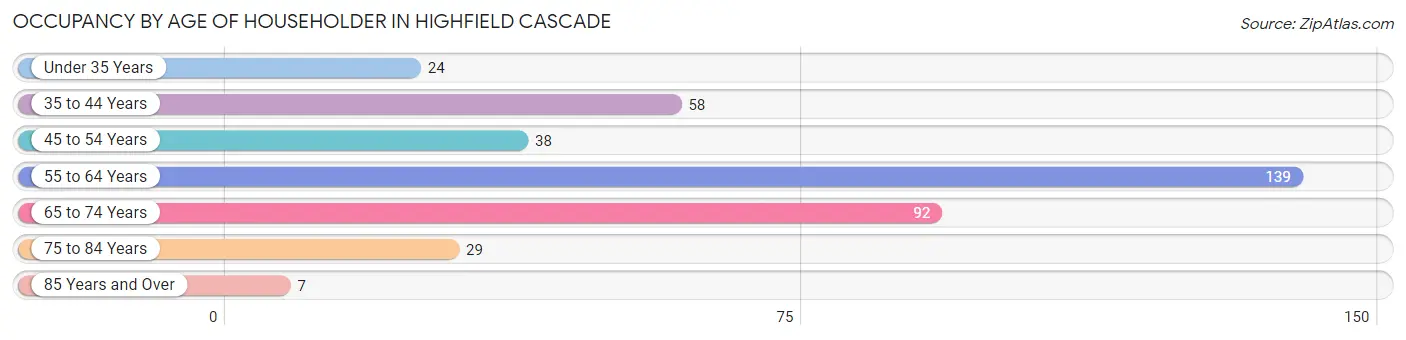
| Age Bracket | # Households | % Households |
| Under 35 Years | 24 | 6.2% |
| 35 to 44 Years | 58 | 15.0% |
| 45 to 54 Years | 38 | 9.8% |
| 55 to 64 Years | 139 | 35.9% |
| 65 to 74 Years | 92 | 23.8% |
| 75 to 84 Years | 29 | 7.5% |
| 85 Years and Over | 7 | 1.8% |
| Total | 387 | 100.0% |
Housing Finances in Highfield Cascade
Median Income by Occupancy in Highfield Cascade
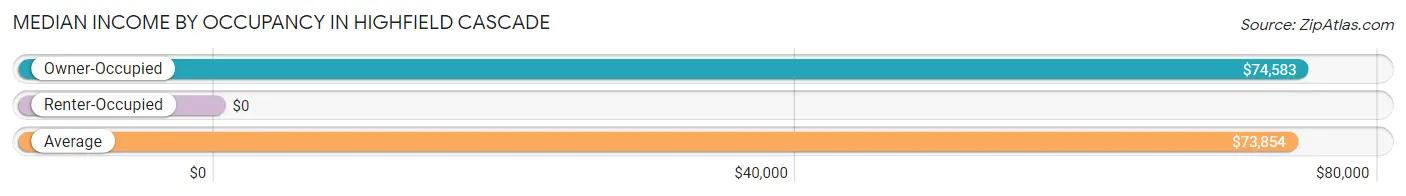
| Occupancy Type | # Households | Median Income |
| Owner-Occupied | 358 (92.5%) | $74,583 |
| Renter-Occupied | 29 (7.5%) | $0 |
| Average | 387 (100.0%) | $73,854 |
Occupancy by Householder Income Bracket in Highfield Cascade
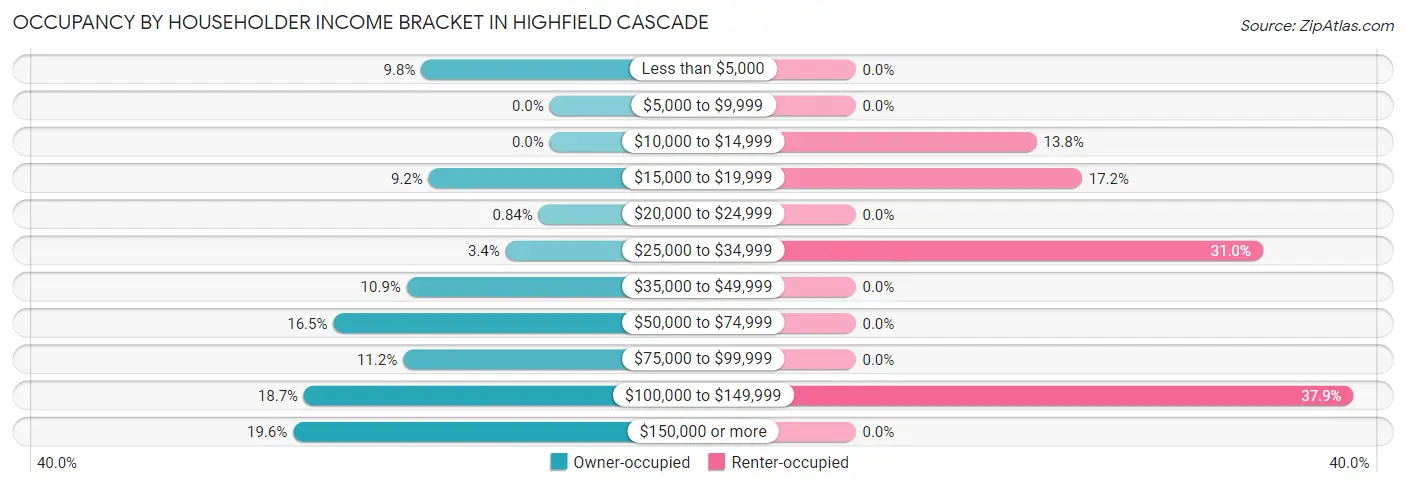
| Income Bracket | Owner-occupied | Renter-occupied |
| Less than $5,000 | 35 (9.8%) | 0 (0.0%) |
| $5,000 to $9,999 | 0 (0.0%) | 0 (0.0%) |
| $10,000 to $14,999 | 0 (0.0%) | 4 (13.8%) |
| $15,000 to $19,999 | 33 (9.2%) | 5 (17.2%) |
| $20,000 to $24,999 | 3 (0.8%) | 0 (0.0%) |
| $25,000 to $34,999 | 12 (3.4%) | 9 (31.0%) |
| $35,000 to $49,999 | 39 (10.9%) | 0 (0.0%) |
| $50,000 to $74,999 | 59 (16.5%) | 0 (0.0%) |
| $75,000 to $99,999 | 40 (11.2%) | 0 (0.0%) |
| $100,000 to $149,999 | 67 (18.7%) | 11 (37.9%) |
| $150,000 or more | 70 (19.6%) | 0 (0.0%) |
| Total | 358 (100.0%) | 29 (100.0%) |
Monthly Housing Cost Tiers in Highfield Cascade
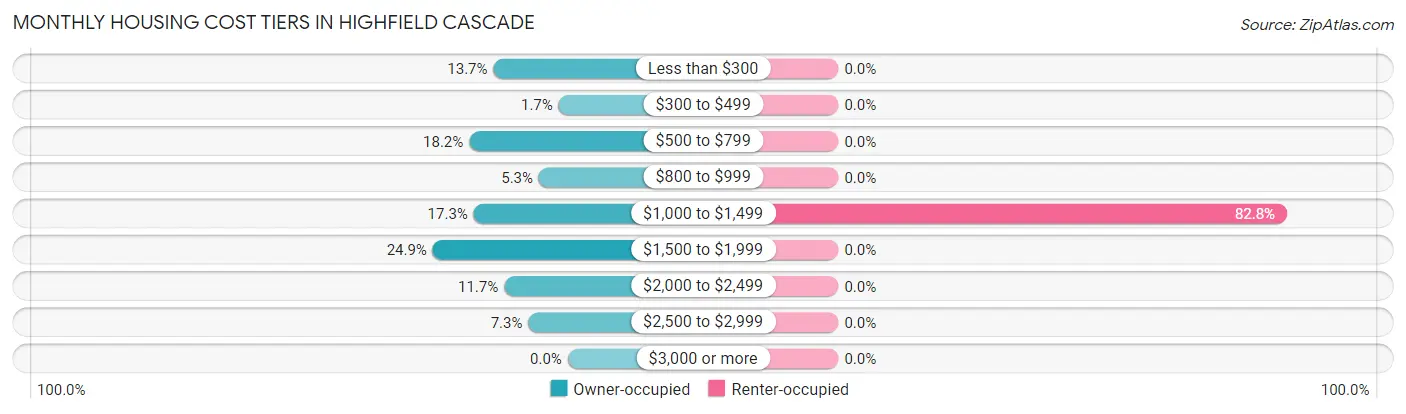
| Monthly Cost | Owner-occupied | Renter-occupied |
| Less than $300 | 49 (13.7%) | 0 (0.0%) |
| $300 to $499 | 6 (1.7%) | 0 (0.0%) |
| $500 to $799 | 65 (18.2%) | 0 (0.0%) |
| $800 to $999 | 19 (5.3%) | 0 (0.0%) |
| $1,000 to $1,499 | 62 (17.3%) | 24 (82.8%) |
| $1,500 to $1,999 | 89 (24.9%) | 0 (0.0%) |
| $2,000 to $2,499 | 42 (11.7%) | 0 (0.0%) |
| $2,500 to $2,999 | 26 (7.3%) | 0 (0.0%) |
| $3,000 or more | 0 (0.0%) | 0 (0.0%) |
| Total | 358 (100.0%) | 29 (100.0%) |
Physical Housing Characteristics in Highfield Cascade
Housing Structures in Highfield Cascade
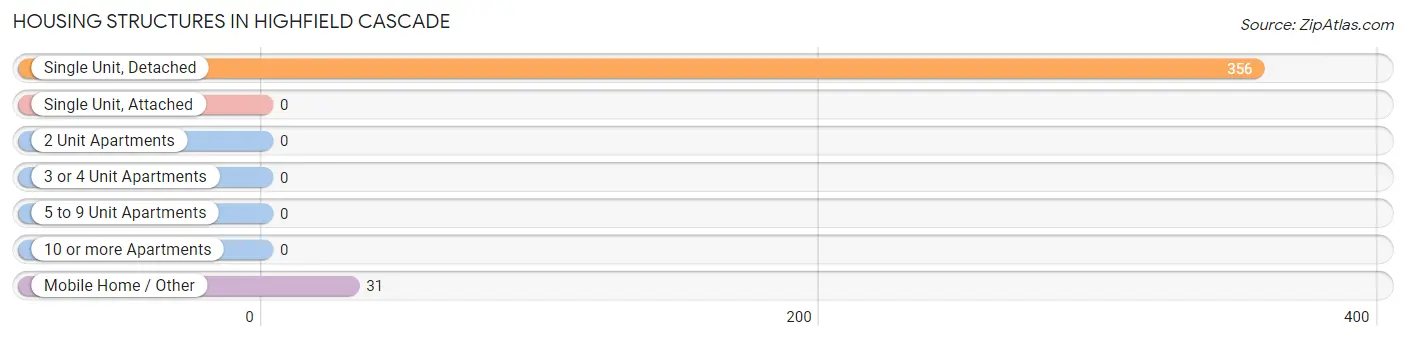
| Structure Type | # Housing Units | % Housing Units |
| Single Unit, Detached | 356 | 92.0% |
| Single Unit, Attached | 0 | 0.0% |
| 2 Unit Apartments | 0 | 0.0% |
| 3 or 4 Unit Apartments | 0 | 0.0% |
| 5 to 9 Unit Apartments | 0 | 0.0% |
| 10 or more Apartments | 0 | 0.0% |
| Mobile Home / Other | 31 | 8.0% |
| Total | 387 | 100.0% |
Housing Structures by Occupancy in Highfield Cascade
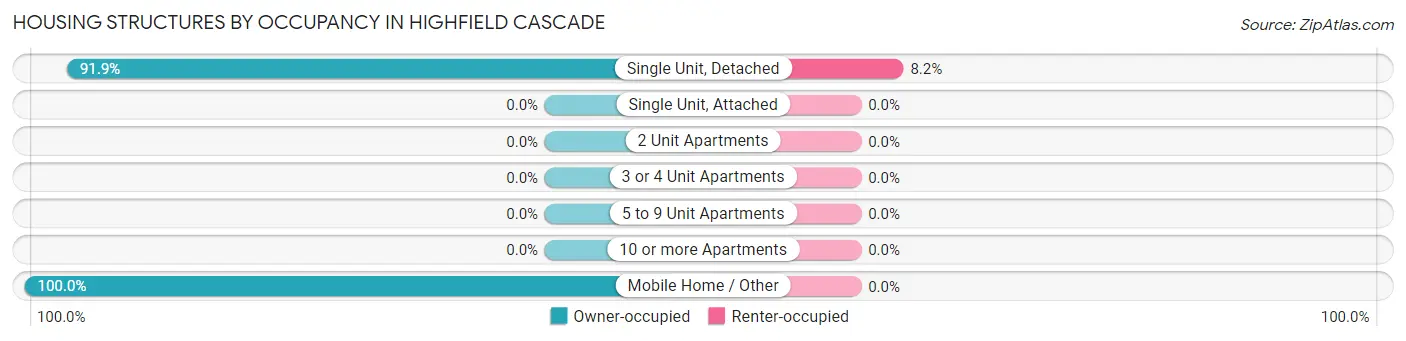
| Structure Type | Owner-occupied | Renter-occupied |
| Single Unit, Detached | 327 (91.8%) | 29 (8.2%) |
| Single Unit, Attached | 0 (0.0%) | 0 (0.0%) |
| 2 Unit Apartments | 0 (0.0%) | 0 (0.0%) |
| 3 or 4 Unit Apartments | 0 (0.0%) | 0 (0.0%) |
| 5 to 9 Unit Apartments | 0 (0.0%) | 0 (0.0%) |
| 10 or more Apartments | 0 (0.0%) | 0 (0.0%) |
| Mobile Home / Other | 31 (100.0%) | 0 (0.0%) |
| Total | 358 (92.5%) | 29 (7.5%) |
Housing Structures by Number of Rooms in Highfield Cascade
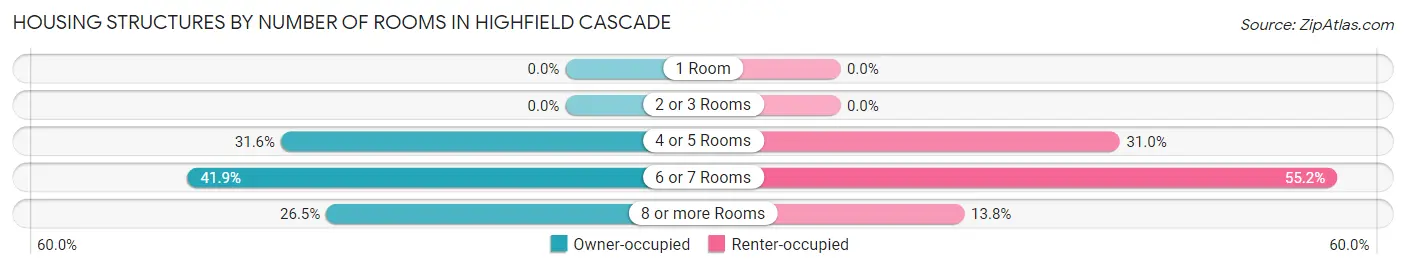
| Number of Rooms | Owner-occupied | Renter-occupied |
| 1 Room | 0 (0.0%) | 0 (0.0%) |
| 2 or 3 Rooms | 0 (0.0%) | 0 (0.0%) |
| 4 or 5 Rooms | 113 (31.6%) | 9 (31.0%) |
| 6 or 7 Rooms | 150 (41.9%) | 16 (55.2%) |
| 8 or more Rooms | 95 (26.5%) | 4 (13.8%) |
| Total | 358 (100.0%) | 29 (100.0%) |
Housing Structure by Heating Type in Highfield Cascade
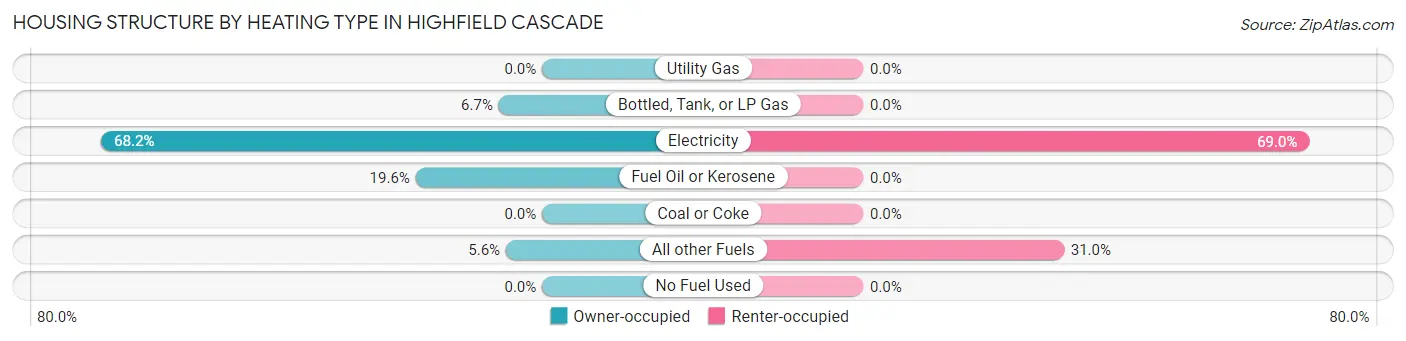
| Heating Type | Owner-occupied | Renter-occupied |
| Utility Gas | 0 (0.0%) | 0 (0.0%) |
| Bottled, Tank, or LP Gas | 24 (6.7%) | 0 (0.0%) |
| Electricity | 244 (68.2%) | 20 (69.0%) |
| Fuel Oil or Kerosene | 70 (19.6%) | 0 (0.0%) |
| Coal or Coke | 0 (0.0%) | 0 (0.0%) |
| All other Fuels | 20 (5.6%) | 9 (31.0%) |
| No Fuel Used | 0 (0.0%) | 0 (0.0%) |
| Total | 358 (100.0%) | 29 (100.0%) |
Household Vehicle Usage in Highfield Cascade
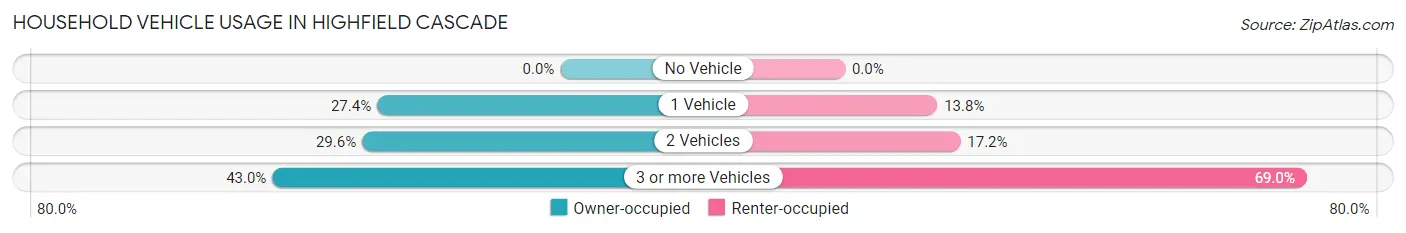
| Vehicles per Household | Owner-occupied | Renter-occupied |
| No Vehicle | 0 (0.0%) | 0 (0.0%) |
| 1 Vehicle | 98 (27.4%) | 4 (13.8%) |
| 2 Vehicles | 106 (29.6%) | 5 (17.2%) |
| 3 or more Vehicles | 154 (43.0%) | 20 (69.0%) |
| Total | 358 (100.0%) | 29 (100.0%) |
Real Estate & Mortgages in Highfield Cascade
Real Estate and Mortgage Overview in Highfield Cascade
| Characteristic | Without Mortgage | With Mortgage |
| Housing Units | 147 | 211 |
| Median Property Value | $211,000 | $243,600 |
| Median Household Income | $51,339 | $70 |
| Monthly Housing Costs | $536 | $0 |
| Real Estate Taxes | $1,869 | $0 |
Property Value by Mortgage Status in Highfield Cascade
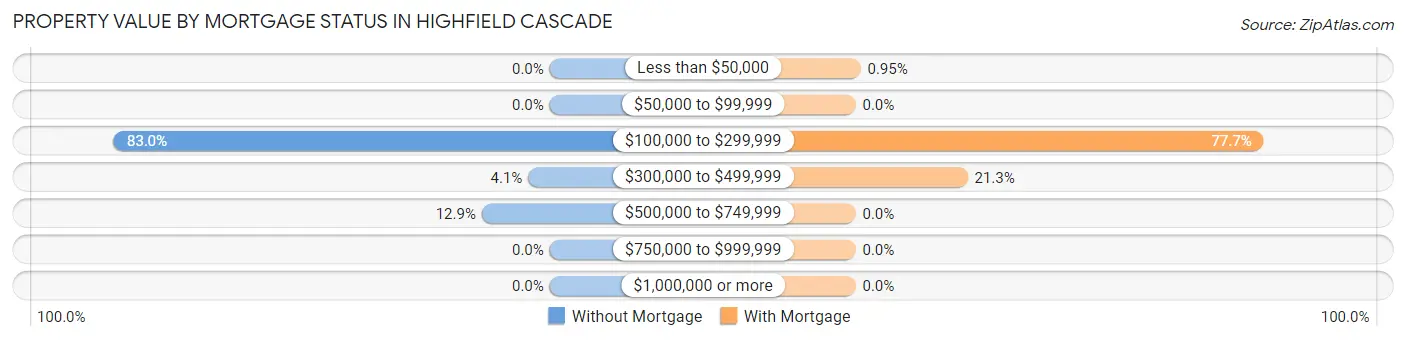
| Property Value | Without Mortgage | With Mortgage |
| Less than $50,000 | 0 (0.0%) | 2 (0.9%) |
| $50,000 to $99,999 | 0 (0.0%) | 0 (0.0%) |
| $100,000 to $299,999 | 122 (83.0%) | 164 (77.7%) |
| $300,000 to $499,999 | 6 (4.1%) | 45 (21.3%) |
| $500,000 to $749,999 | 19 (12.9%) | 0 (0.0%) |
| $750,000 to $999,999 | 0 (0.0%) | 0 (0.0%) |
| $1,000,000 or more | 0 (0.0%) | 0 (0.0%) |
| Total | 147 (100.0%) | 211 (100.0%) |
Household Income by Mortgage Status in Highfield Cascade
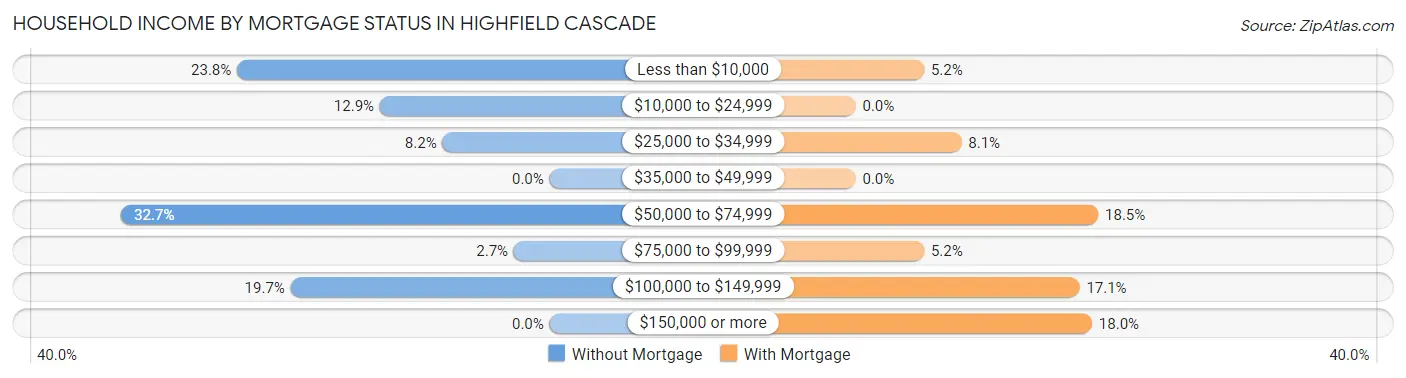
| Household Income | Without Mortgage | With Mortgage |
| Less than $10,000 | 35 (23.8%) | 11 (5.2%) |
| $10,000 to $24,999 | 19 (12.9%) | 0 (0.0%) |
| $25,000 to $34,999 | 12 (8.2%) | 17 (8.1%) |
| $35,000 to $49,999 | 0 (0.0%) | 0 (0.0%) |
| $50,000 to $74,999 | 48 (32.7%) | 39 (18.5%) |
| $75,000 to $99,999 | 4 (2.7%) | 11 (5.2%) |
| $100,000 to $149,999 | 29 (19.7%) | 36 (17.1%) |
| $150,000 or more | 0 (0.0%) | 38 (18.0%) |
| Total | 147 (100.0%) | 211 (100.0%) |
Property Value to Household Income Ratio in Highfield Cascade
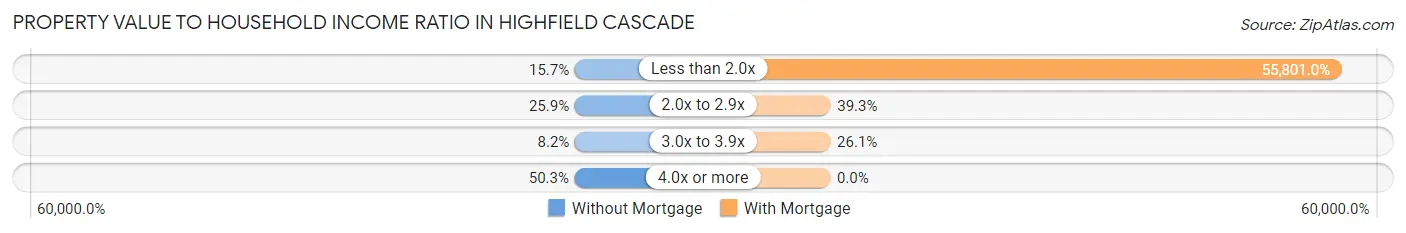
| Value-to-Income Ratio | Without Mortgage | With Mortgage |
| Less than 2.0x | 23 (15.7%) | 117,740 (55,801.0%) |
| 2.0x to 2.9x | 38 (25.9%) | 83 (39.3%) |
| 3.0x to 3.9x | 12 (8.2%) | 55 (26.1%) |
| 4.0x or more | 74 (50.3%) | 0 (0.0%) |
| Total | 147 (100.0%) | 211 (100.0%) |
Real Estate Taxes by Mortgage Status in Highfield Cascade
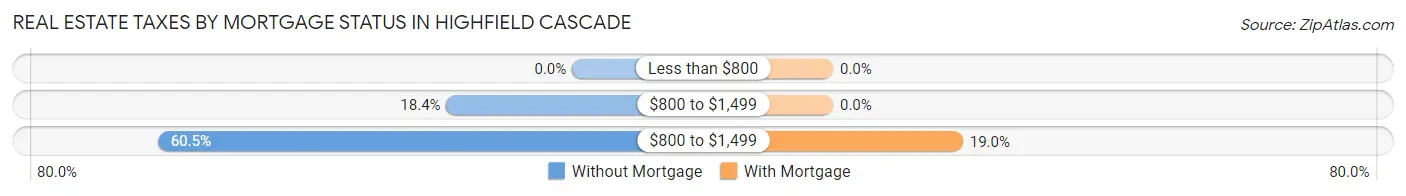
| Property Taxes | Without Mortgage | With Mortgage |
| Less than $800 | 0 (0.0%) | 0 (0.0%) |
| $800 to $1,499 | 27 (18.4%) | 0 (0.0%) |
| $800 to $1,499 | 89 (60.5%) | 40 (19.0%) |
| Total | 147 (100.0%) | 211 (100.0%) |
Health & Disability in Highfield Cascade
Health Insurance Coverage by Age in Highfield Cascade
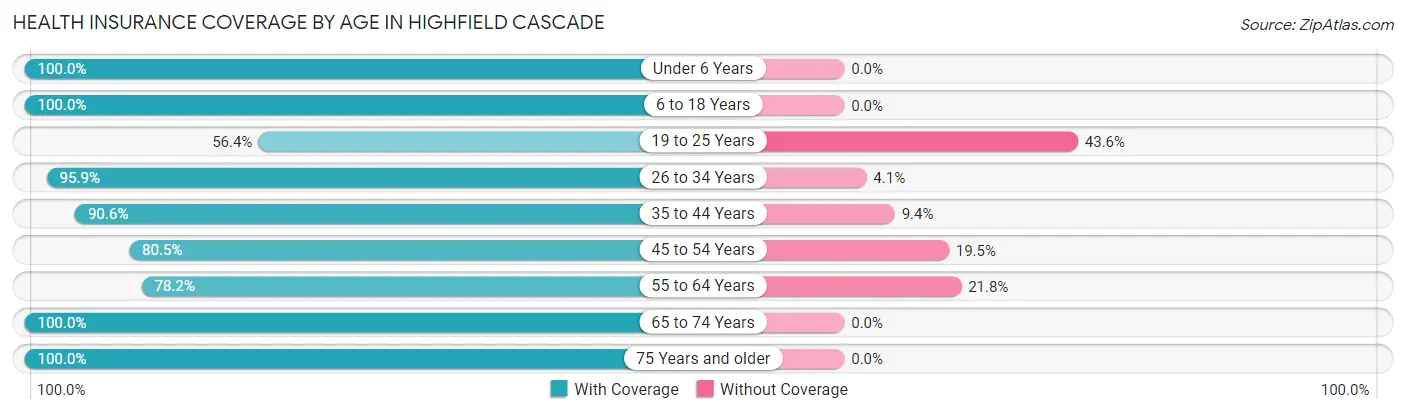
| Age Bracket | With Coverage | Without Coverage |
| Under 6 Years | 50 (100.0%) | 0 (0.0%) |
| 6 to 18 Years | 175 (100.0%) | 0 (0.0%) |
| 19 to 25 Years | 57 (56.4%) | 44 (43.6%) |
| 26 to 34 Years | 93 (95.9%) | 4 (4.1%) |
| 35 to 44 Years | 135 (90.6%) | 14 (9.4%) |
| 45 to 54 Years | 62 (80.5%) | 15 (19.5%) |
| 55 to 64 Years | 165 (78.2%) | 46 (21.8%) |
| 65 to 74 Years | 121 (100.0%) | 0 (0.0%) |
| 75 Years and older | 50 (100.0%) | 0 (0.0%) |
| Total | 908 (88.1%) | 123 (11.9%) |
Health Insurance Coverage by Citizenship Status in Highfield Cascade
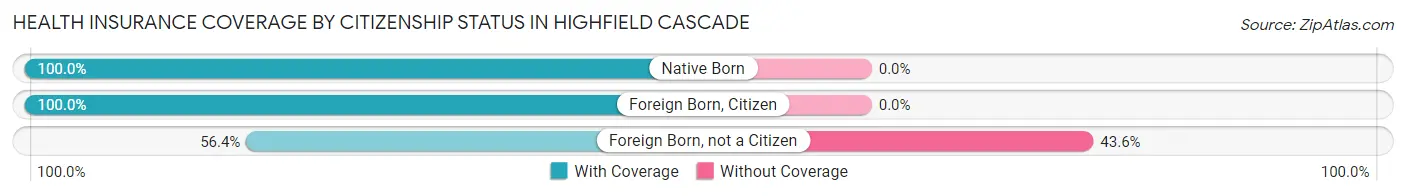
| Citizenship Status | With Coverage | Without Coverage |
| Native Born | 50 (100.0%) | 0 (0.0%) |
| Foreign Born, Citizen | 175 (100.0%) | 0 (0.0%) |
| Foreign Born, not a Citizen | 57 (56.4%) | 44 (43.6%) |
Health Insurance Coverage by Household Income in Highfield Cascade
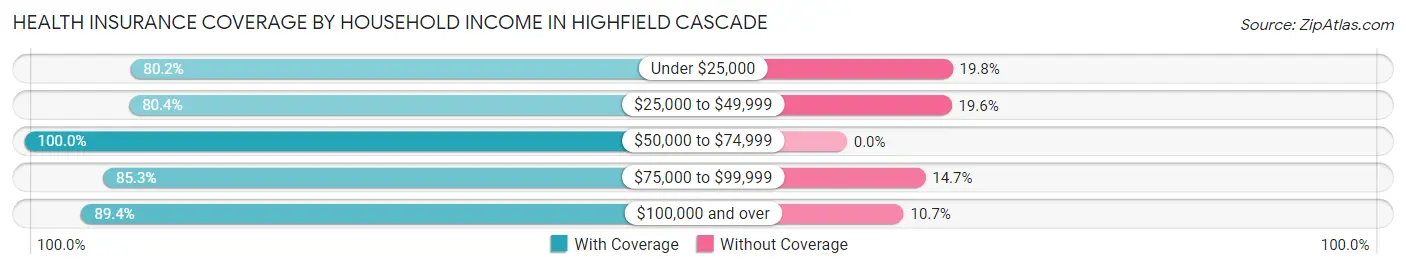
| Household Income | With Coverage | Without Coverage |
| Under $25,000 | 89 (80.2%) | 22 (19.8%) |
| $25,000 to $49,999 | 82 (80.4%) | 20 (19.6%) |
| $50,000 to $74,999 | 96 (100.0%) | 0 (0.0%) |
| $75,000 to $99,999 | 87 (85.3%) | 15 (14.7%) |
| $100,000 and over | 554 (89.3%) | 66 (10.6%) |
Public vs Private Health Insurance Coverage by Age in Highfield Cascade
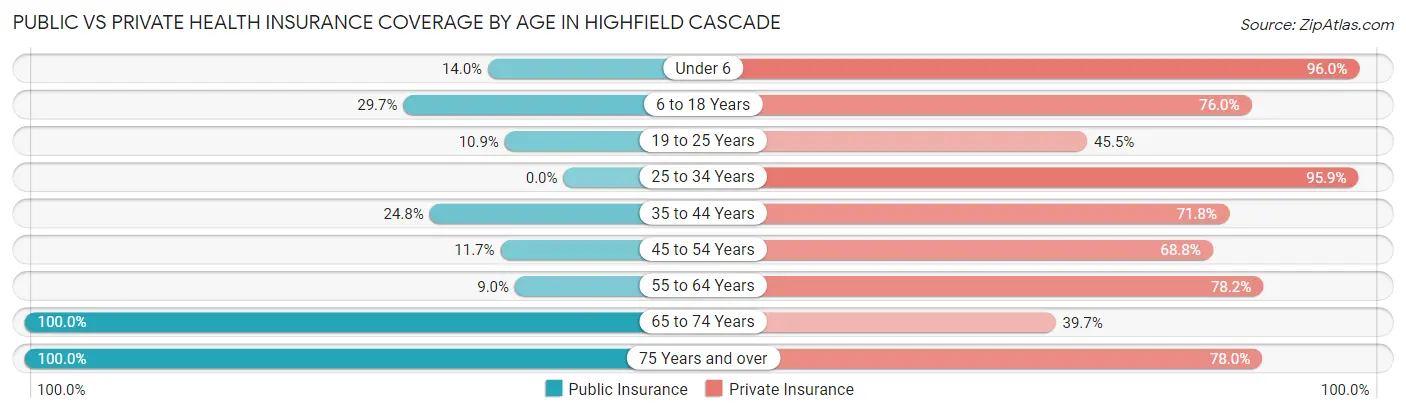
| Age Bracket | Public Insurance | Private Insurance |
| Under 6 | 7 (14.0%) | 48 (96.0%) |
| 6 to 18 Years | 52 (29.7%) | 133 (76.0%) |
| 19 to 25 Years | 11 (10.9%) | 46 (45.5%) |
| 25 to 34 Years | 0 (0.0%) | 93 (95.9%) |
| 35 to 44 Years | 37 (24.8%) | 107 (71.8%) |
| 45 to 54 Years | 9 (11.7%) | 53 (68.8%) |
| 55 to 64 Years | 19 (9.0%) | 165 (78.2%) |
| 65 to 74 Years | 121 (100.0%) | 48 (39.7%) |
| 75 Years and over | 50 (100.0%) | 39 (78.0%) |
| Total | 306 (29.7%) | 732 (71.0%) |
Disability Status by Sex by Age in Highfield Cascade
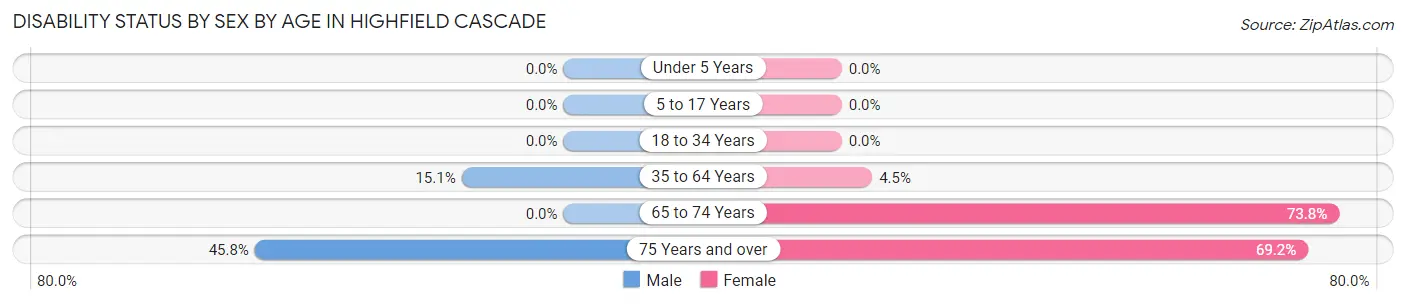
| Age Bracket | Male | Female |
| Under 5 Years | 0 (0.0%) | 0 (0.0%) |
| 5 to 17 Years | 0 (0.0%) | 0 (0.0%) |
| 18 to 34 Years | 0 (0.0%) | 0 (0.0%) |
| 35 to 64 Years | 36 (15.1%) | 9 (4.5%) |
| 65 to 74 Years | 0 (0.0%) | 79 (73.8%) |
| 75 Years and over | 11 (45.8%) | 18 (69.2%) |
Disability Class by Sex by Age in Highfield Cascade
Disability Class: Hearing Difficulty
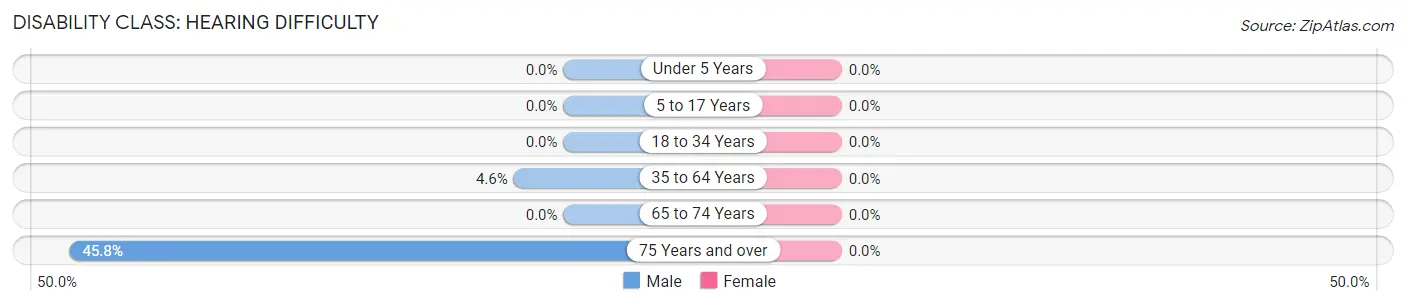
| Age Bracket | Male | Female |
| Under 5 Years | 0 (0.0%) | 0 (0.0%) |
| 5 to 17 Years | 0 (0.0%) | 0 (0.0%) |
| 18 to 34 Years | 0 (0.0%) | 0 (0.0%) |
| 35 to 64 Years | 11 (4.6%) | 0 (0.0%) |
| 65 to 74 Years | 0 (0.0%) | 0 (0.0%) |
| 75 Years and over | 11 (45.8%) | 0 (0.0%) |
Disability Class: Vision Difficulty
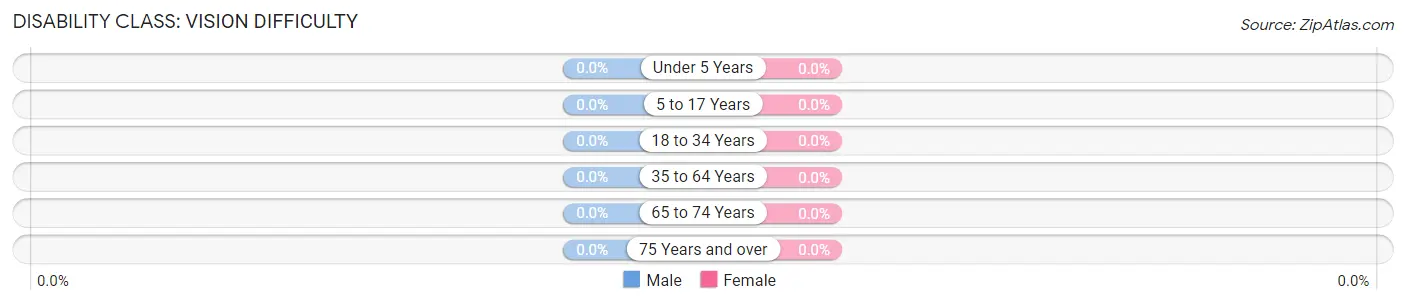
| Age Bracket | Male | Female |
| Under 5 Years | 0 (0.0%) | 0 (0.0%) |
| 5 to 17 Years | 0 (0.0%) | 0 (0.0%) |
| 18 to 34 Years | 0 (0.0%) | 0 (0.0%) |
| 35 to 64 Years | 0 (0.0%) | 0 (0.0%) |
| 65 to 74 Years | 0 (0.0%) | 0 (0.0%) |
| 75 Years and over | 0 (0.0%) | 0 (0.0%) |
Disability Class: Cognitive Difficulty
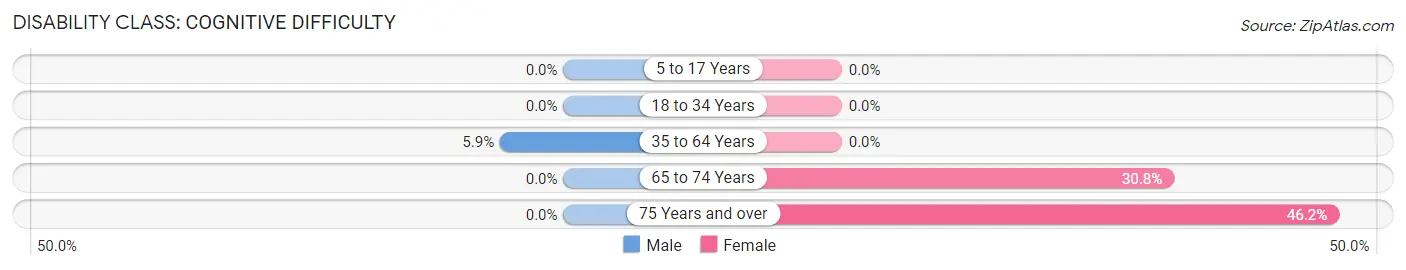
| Age Bracket | Male | Female |
| 5 to 17 Years | 0 (0.0%) | 0 (0.0%) |
| 18 to 34 Years | 0 (0.0%) | 0 (0.0%) |
| 35 to 64 Years | 14 (5.9%) | 0 (0.0%) |
| 65 to 74 Years | 0 (0.0%) | 33 (30.8%) |
| 75 Years and over | 0 (0.0%) | 12 (46.2%) |
Disability Class: Ambulatory Difficulty
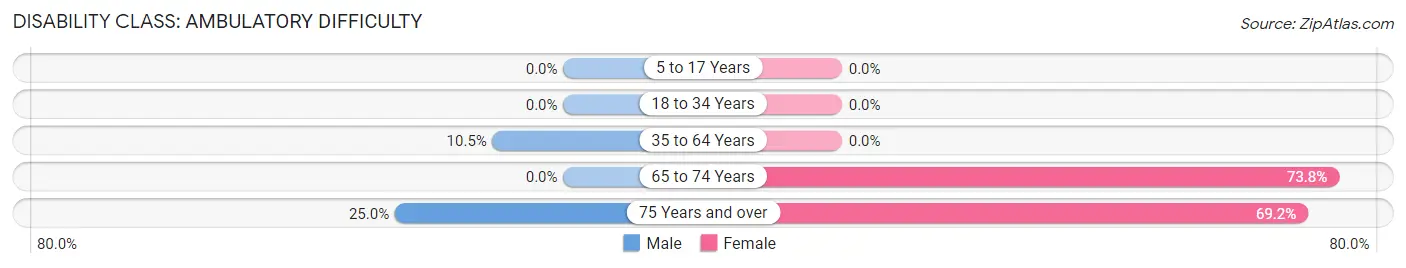
| Age Bracket | Male | Female |
| 5 to 17 Years | 0 (0.0%) | 0 (0.0%) |
| 18 to 34 Years | 0 (0.0%) | 0 (0.0%) |
| 35 to 64 Years | 25 (10.5%) | 0 (0.0%) |
| 65 to 74 Years | 0 (0.0%) | 79 (73.8%) |
| 75 Years and over | 6 (25.0%) | 18 (69.2%) |
Disability Class: Self-Care Difficulty
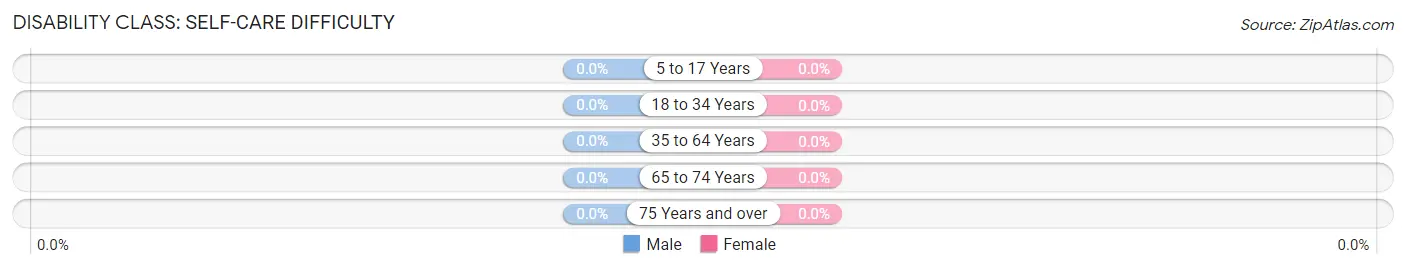
| Age Bracket | Male | Female |
| 5 to 17 Years | 0 (0.0%) | 0 (0.0%) |
| 18 to 34 Years | 0 (0.0%) | 0 (0.0%) |
| 35 to 64 Years | 0 (0.0%) | 0 (0.0%) |
| 65 to 74 Years | 0 (0.0%) | 0 (0.0%) |
| 75 Years and over | 0 (0.0%) | 0 (0.0%) |
Technology Access in Highfield Cascade
Computing Device Access in Highfield Cascade
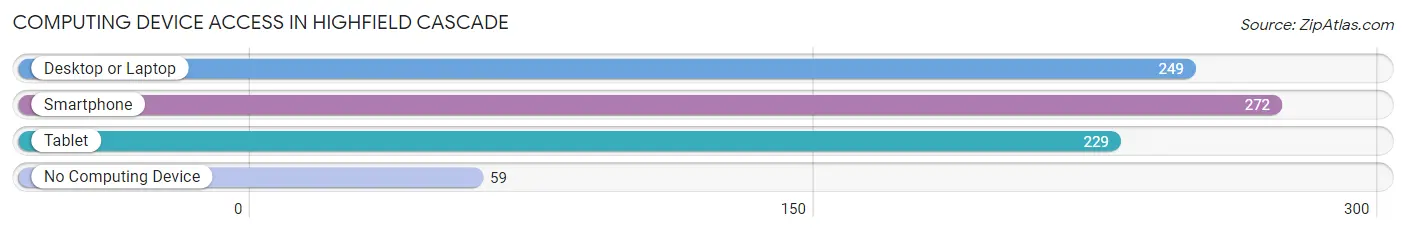
| Device Type | # Households | % Households |
| Desktop or Laptop | 249 | 64.3% |
| Smartphone | 272 | 70.3% |
| Tablet | 229 | 59.2% |
| No Computing Device | 59 | 15.2% |
| Total | 387 | 100.0% |
Internet Access in Highfield Cascade
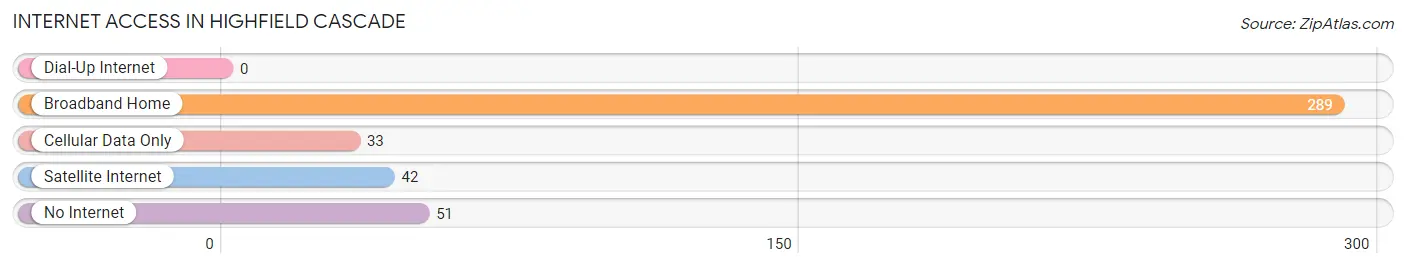
| Internet Type | # Households | % Households |
| Dial-Up Internet | 0 | 0.0% |
| Broadband Home | 289 | 74.7% |
| Cellular Data Only | 33 | 8.5% |
| Satellite Internet | 42 | 10.8% |
| No Internet | 51 | 13.2% |
| Total | 387 | 100.0% |
Highfield Cascade Summary
Highfield Cascade is a small town located in the state of Maryland, United States. It is situated in the northern part of the state, in the Appalachian Mountains. The town is located in Garrett County, and is part of the Cumberland Metropolitan Statistical Area. The population of Highfield Cascade was estimated to be 1,845 in the year 2000.
History
Highfield Cascade was founded in 1820 by a group of settlers from Pennsylvania. The town was named after the nearby Highfield Creek, which was named after the high elevation of the area. The town was originally a farming community, and the settlers grew corn, wheat, and other crops. The town was also known for its timber industry, and the surrounding forests were used for logging.
In the late 19th century, the town began to grow and develop. The railroad was built through the town, and the town became a popular tourist destination. The town was also known for its mineral springs, which were believed to have healing properties.
Geography
Highfield Cascade is located in the northern part of Maryland, in the Appalachian Mountains. The town is situated in Garrett County, and is part of the Cumberland Metropolitan Statistical Area. The town is located at an elevation of 1,845 feet above sea level. The town is surrounded by forests and mountains, and is located near the Potomac River.
The climate in Highfield Cascade is humid continental, with hot summers and cold winters. The average annual temperature is around 50 degrees Fahrenheit. The town receives an average of 40 inches of precipitation per year.
Economy
The economy of Highfield Cascade is largely based on tourism. The town is a popular destination for outdoor activities such as hiking, camping, fishing, and hunting. The town is also known for its mineral springs, which attract visitors from all over the country.
The town is also home to several small businesses, including restaurants, shops, and lodging. The town is also home to a few manufacturing companies, which produce furniture, clothing, and other products.
Demographics
The population of Highfield Cascade was estimated to be 1,845 in the year 2000. The town is predominantly white, with a small African American population. The median household income in the town is around $35,000. The town has a low unemployment rate, and the majority of the population is employed in the tourism and service industries.
Common Questions
What is the Total Population of Highfield Cascade?
Total Population of Highfield Cascade is 1,031.
What is the Total Male Population of Highfield Cascade?
Total Male Population of Highfield Cascade is 491.
What is the Total Female Population of Highfield Cascade?
Total Female Population of Highfield Cascade is 540.
What is the Ratio of Males per 100 Females in Highfield Cascade?
There are 90.93 Males per 100 Females in Highfield Cascade.
What is the Ratio of Females per 100 Males in Highfield Cascade?
There are 109.98 Females per 100 Males in Highfield Cascade.
What is the Median Population Age in Highfield Cascade?
Median Population Age in Highfield Cascade is 38.3 Years.
What is the Average Family Size in Highfield Cascade
Average Family Size in Highfield Cascade is 3.4 People.
What is the Average Household Size in Highfield Cascade
Average Household Size in Highfield Cascade is 2.7 People.
What is Per Capita Income in Highfield Cascade?
Per Capita income in Highfield Cascade is $37,103.
What is the Median Family Income in Highfield Cascade?
Median Family Income in Highfield Cascade is $112,708.
What is the Median Household income in Highfield Cascade?
Median Household Income in Highfield Cascade is $73,854.
What is Income or Wage Gap in Highfield Cascade?
Income or Wage Gap in Highfield Cascade is 38.0%.
Women in Highfield Cascade earn 62.0 cents for every dollar earned by a man.
What is Inequality or Gini Index in Highfield Cascade?
Inequality or Gini Index in Highfield Cascade is 0.44.
How Large is the Labor Force in Highfield Cascade?
There are 595 People in the Labor Forcein in Highfield Cascade.
What is the Percentage of People in the Labor Force in Highfield Cascade?
71.9% of People are in the Labor Force in Highfield Cascade.
What is the Unemployment Rate in Highfield Cascade?
Unemployment Rate in Highfield Cascade is 2.7%.