Cities with the Highest Percentage of Immigrants from Brazil in Massachusetts
RELATED REPORTS & OPTIONS
Brazil
Massachusetts
Compare Cities
Map of Cities with the Highest Percentage of Immigrants from Brazil in Massachusetts
0.00%
20.00%
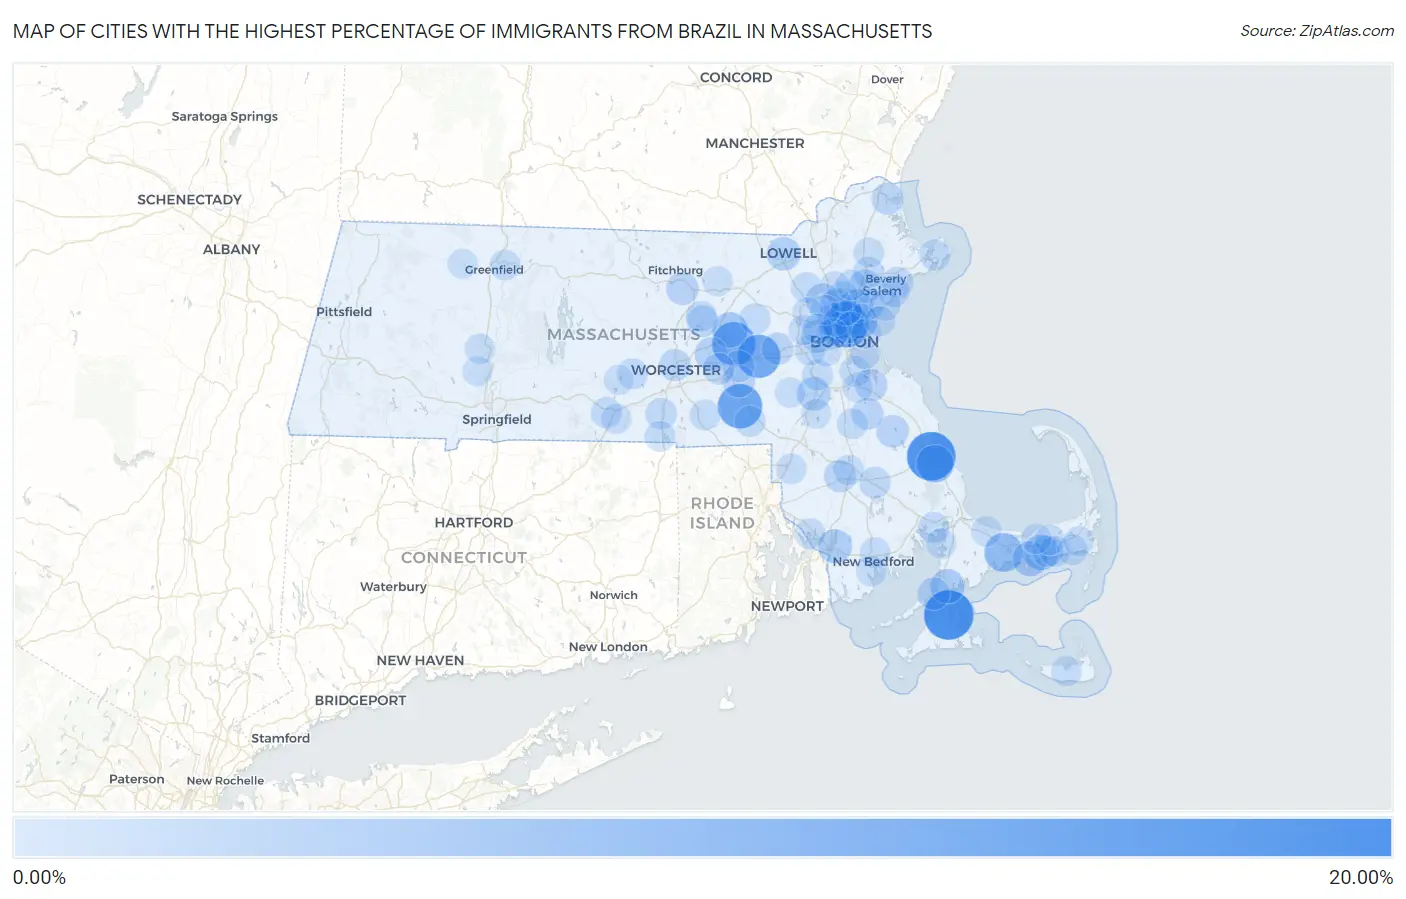
Cities with the Highest Percentage of Immigrants from Brazil in Massachusetts
| City | Brazil | vs State | vs National | |
| 1. | Vineyard Haven | 15.97% | 1.33%(+14.6)#-1 | 0.17%(+15.8)#0 |
| 2. | North Plymouth | 15.21% | 1.33%(+13.9)#0 | 0.17%(+15.0)#1 |
| 3. | Everett | 12.04% | 1.33%(+10.7)#3 | 0.17%(+11.9)#83 |
| 4. | Milford | 11.77% | 1.33%(+10.4)#15 | 0.17%(+11.6)#980 |
| 5. | Marlborough | 11.02% | 1.33%(+9.69)#60 | 0.17%(+10.9)#3,025 |
| 6. | Framingham | 10.80% | 1.33%(+9.47)#61 | 0.17%(+10.6)#3,026 |
| 7. | Barnstable Town | 7.09% | 1.33%(+5.76)#62 | 0.17%(+6.93)#3,027 |
| 8. | Plymouth | 6.13% | 1.33%(+4.80)#63 | 0.17%(+5.96)#3,028 |
| 9. | Malden | 5.62% | 1.33%(+4.29)#64 | 0.17%(+5.45)#3,029 |
| 10. | South Yarmouth | 4.68% | 1.33%(+3.34)#65 | 0.17%(+4.51)#3,030 |
| 11. | Hudson | 4.55% | 1.33%(+3.22)#66 | 0.17%(+4.38)#3,031 |
| 12. | West Yarmouth | 4.18% | 1.33%(+2.85)#67 | 0.17%(+4.01)#3,332 |
| 13. | Revere | 3.94% | 1.33%(+2.61)#68 | 0.17%(+3.77)#3,333 |
| 14. | Oak Bluffs | 3.88% | 1.33%(+2.55)#69 | 0.17%(+3.71)#3,334 |
| 15. | Falmouth | 3.63% | 1.33%(+2.30)#70 | 0.17%(+3.46)#3,335 |
| 16. | Fall River | 3.35% | 1.33%(+2.02)#71 | 0.17%(+3.19)#3,336 |
| 17. | Saugus | 3.20% | 1.33%(+1.87)#72 | 0.17%(+3.04)#3,337 |
| 18. | Norwood | 3.05% | 1.33%(+1.72)#73 | 0.17%(+2.88)#3,338 |
| 19. | Lowell | 3.00% | 1.33%(+1.67)#74 | 0.17%(+2.84)#3,339 |
| 20. | Somerville | 2.94% | 1.33%(+1.61)#75 | 0.17%(+2.78)#3,340 |
| 21. | Medford | 2.86% | 1.33%(+1.53)#76 | 0.17%(+2.69)#3,341 |
| 22. | Peabody | 2.75% | 1.33%(+1.42)#77 | 0.17%(+2.58)#3,342 |
| 23. | Woburn | 2.72% | 1.33%(+1.39)#78 | 0.17%(+2.55)#3,343 |
| 24. | Northborough | 2.59% | 1.33%(+1.26)#79 | 0.17%(+2.42)#3,344 |
| 25. | Stoneham | 2.38% | 1.33%(+1.05)#80 | 0.17%(+2.21)#3,345 |
| 26. | Watertown Town | 2.29% | 1.33%(+0.954)#81 | 0.17%(+2.12)#3,636 |
| 27. | Leominster | 2.16% | 1.33%(+0.826)#82 | 0.17%(+1.99)#3,637 |
| 28. | Hanson | 2.16% | 1.33%(+0.825)#83 | 0.17%(+1.99)#3,638 |
| 29. | Hopkinton | 2.15% | 1.33%(+0.822)#84 | 0.17%(+1.99)#3,639 |
| 30. | Woods Hole | 2.12% | 1.33%(+0.786)#85 | 0.17%(+1.95)#3,640 |
| 31. | Weymouth Town | 2.01% | 1.33%(+0.683)#86 | 0.17%(+1.85)#3,641 |
| 32. | Cochituate | 1.90% | 1.33%(+0.572)#87 | 0.17%(+1.74)#3,642 |
| 33. | Taunton | 1.88% | 1.33%(+0.553)#88 | 0.17%(+1.72)#3,643 |
| 34. | Worcester | 1.81% | 1.33%(+0.477)#89 | 0.17%(+1.64)#3,644 |
| 35. | Newburyport | 1.72% | 1.33%(+0.391)#90 | 0.17%(+1.55)#3,645 |
| 36. | Abington | 1.60% | 1.33%(+0.269)#91 | 0.17%(+1.43)#3,646 |
| 37. | Cordaville | 1.60% | 1.33%(+0.264)#92 | 0.17%(+1.43)#3,647 |
| 38. | Clinton | 1.59% | 1.33%(+0.258)#93 | 0.17%(+1.42)#3,648 |
| 39. | Westborough | 1.51% | 1.33%(+0.176)#94 | 0.17%(+1.34)#3,649 |
| 40. | Lynn | 1.43% | 1.33%(+0.099)#95 | 0.17%(+1.26)#3,650 |
| 41. | West Dennis | 1.39% | 1.33%(+0.060)#96 | 0.17%(+1.22)#3,651 |
| 42. | Middleborough Center | 1.33% | 1.33%(+0.001)#97 | 0.17%(+1.17)#3,652 |
| 43. | Beverly | 1.31% | 1.33%(-0.018)#98 | 0.17%(+1.15)#3,653 |
| 44. | Salem | 1.31% | 1.33%(-0.024)#99 | 0.17%(+1.14)#3,654 |
| 45. | Oxford | 1.26% | 1.33%(-0.074)#100 | 0.17%(+1.09)#3,655 |
| 46. | Swampscott | 1.26% | 1.33%(-0.075)#101 | 0.17%(+1.09)#3,656 |
| 47. | Chelsea | 1.23% | 1.33%(-0.105)#102 | 0.17%(+1.06)#3,657 |
| 48. | Amherst | 1.16% | 1.33%(-0.172)#103 | 0.17%(+0.992)#3,658 |
| 49. | Danvers | 1.15% | 1.33%(-0.181)#104 | 0.17%(+0.983)#3,659 |
| 50. | Melrose | 1.15% | 1.33%(-0.181)#105 | 0.17%(+0.983)#3,660 |
| 51. | Onset | 1.13% | 1.33%(-0.200)#106 | 0.17%(+0.964)#3,661 |
| 52. | Gloucester | 1.10% | 1.33%(-0.228)#107 | 0.17%(+0.936)#3,662 |
| 53. | Bellingham | 1.08% | 1.33%(-0.252)#108 | 0.17%(+0.912)#3,663 |
| 54. | Maynard | 1.01% | 1.33%(-0.319)#109 | 0.17%(+0.845)#3,664 |
| 55. | Dedham | 1.00% | 1.33%(-0.333)#110 | 0.17%(+0.831)#3,665 |
| 56. | Fiskdale | 0.99% | 1.33%(-0.341)#111 | 0.17%(+0.824)#3,666 |
| 57. | Quincy | 0.98% | 1.33%(-0.352)#112 | 0.17%(+0.813)#3,805 |
| 58. | Spencer | 0.96% | 1.33%(-0.373)#113 | 0.17%(+0.791)#3,806 |
| 59. | Newton | 0.92% | 1.33%(-0.413)#114 | 0.17%(+0.751)#3,807 |
| 60. | Ocean Grove | 0.89% | 1.33%(-0.439)#115 | 0.17%(+0.725)#3,808 |
| 61. | Dennis Port | 0.88% | 1.33%(-0.452)#116 | 0.17%(+0.712)#3,809 |
| 62. | South Lancaster | 0.85% | 1.33%(-0.478)#117 | 0.17%(+0.686)#3,810 |
| 63. | Brockton | 0.81% | 1.33%(-0.519)#118 | 0.17%(+0.645)#3,811 |
| 64. | Cambridge | 0.81% | 1.33%(-0.522)#119 | 0.17%(+0.642)#3,812 |
| 65. | Webster | 0.79% | 1.33%(-0.540)#120 | 0.17%(+0.624)#3,813 |
| 66. | Wakefield | 0.77% | 1.33%(-0.562)#121 | 0.17%(+0.602)#3,814 |
| 67. | New Bedford | 0.76% | 1.33%(-0.572)#122 | 0.17%(+0.592)#3,815 |
| 68. | Lynnfield | 0.76% | 1.33%(-0.573)#123 | 0.17%(+0.591)#3,816 |
| 69. | Whitinsville | 0.76% | 1.33%(-0.575)#124 | 0.17%(+0.589)#3,817 |
| 70. | Pinehurst | 0.72% | 1.33%(-0.615)#125 | 0.17%(+0.549)#3,818 |
| 71. | Raynham Center | 0.71% | 1.33%(-0.621)#126 | 0.17%(+0.543)#3,819 |
| 72. | Turners Falls | 0.68% | 1.33%(-0.654)#127 | 0.17%(+0.511)#3,820 |
| 73. | Brookline | 0.64% | 1.33%(-0.695)#128 | 0.17%(+0.470)#3,928 |
| 74. | Boston | 0.61% | 1.33%(-0.716)#129 | 0.17%(+0.448)#3,929 |
| 75. | Attleboro | 0.60% | 1.33%(-0.727)#130 | 0.17%(+0.437)#3,930 |
| 76. | East Sandwich | 0.58% | 1.33%(-0.750)#131 | 0.17%(+0.414)#3,931 |
| 77. | South Dennis | 0.58% | 1.33%(-0.751)#132 | 0.17%(+0.414)#3,932 |
| 78. | Bliss Corner | 0.57% | 1.33%(-0.759)#133 | 0.17%(+0.406)#3,933 |
| 79. | Topsfield | 0.57% | 1.33%(-0.759)#134 | 0.17%(+0.405)#3,934 |
| 80. | Lexington | 0.56% | 1.33%(-0.767)#135 | 0.17%(+0.397)#3,935 |
| 81. | Nantucket | 0.56% | 1.33%(-0.768)#136 | 0.17%(+0.396)#3,936 |
| 82. | Reading | 0.55% | 1.33%(-0.780)#137 | 0.17%(+0.384)#3,937 |
| 83. | Sturbridge | 0.54% | 1.33%(-0.791)#138 | 0.17%(+0.373)#3,938 |
| 84. | Devens | 0.51% | 1.33%(-0.820)#139 | 0.17%(+0.344)#3,939 |
| 85. | Harwich Port | 0.49% | 1.33%(-0.843)#140 | 0.17%(+0.322)#3,940 |
| 86. | Waltham | 0.46% | 1.33%(-0.874)#141 | 0.17%(+0.291)#3,941 |
| 87. | Winthrop Town | 0.44% | 1.33%(-0.895)#142 | 0.17%(+0.269)#3,942 |
| 88. | Northampton | 0.42% | 1.33%(-0.906)#143 | 0.17%(+0.258)#3,943 |
| 89. | East Harwich | 0.42% | 1.33%(-0.909)#144 | 0.17%(+0.255)#3,944 |
| 90. | Nahant | 0.42% | 1.33%(-0.911)#145 | 0.17%(+0.253)#3,945 |
| 91. | Pocasset | 0.42% | 1.33%(-0.912)#146 | 0.17%(+0.252)#3,946 |
| 92. | Yarmouth Port | 0.42% | 1.33%(-0.912)#147 | 0.17%(+0.252)#3,947 |
| 93. | Medfield | 0.41% | 1.33%(-0.919)#148 | 0.17%(+0.245)#3,948 |
| 94. | Braintree Town | 0.38% | 1.33%(-0.954)#149 | 0.17%(+0.210)#3,949 |
| 95. | East Brookfield | 0.37% | 1.33%(-0.959)#150 | 0.17%(+0.205)#3,950 |
| 96. | Winchester | 0.37% | 1.33%(-0.963)#151 | 0.17%(+0.201)#3,951 |
| 97. | Easthampton Town | 0.35% | 1.33%(-0.978)#152 | 0.17%(+0.186)#3,952 |
| 98. | Shelburne Falls | 0.35% | 1.33%(-0.978)#153 | 0.17%(+0.186)#3,953 |
| 99. | Belmont | 0.34% | 1.33%(-0.987)#154 | 0.17%(+0.178)#3,954 |
| 100. | Sharon | 0.33% | 1.33%(-0.997)#155 | 0.17%(+0.167)#3,955 |
Common Questions
What are the Top 10 Cities with the Highest Percentage of Immigrants from Brazil in Massachusetts?
Top 10 Cities with the Highest Percentage of Immigrants from Brazil in Massachusetts are:
#1
15.97%
#2
15.21%
#3
12.04%
#4
11.77%
#5
11.02%
#6
10.80%
#7
7.09%
#8
6.13%
#9
5.62%
#10
4.68%
What city has the Highest Percentage of Immigrants from Brazil in Massachusetts?
Vineyard Haven has the Highest Percentage of Immigrants from Brazil in Massachusetts with 15.97%.
What is the Percentage of Immigrants from Brazil in the State of Massachusetts?
Percentage of Immigrants from Brazil in Massachusetts is 1.33%.
What is the Percentage of Immigrants from Brazil in the United States?
Percentage of Immigrants from Brazil in the United States is 0.17%.