Cities with the Most Immigrants from Ethiopia in Massachusetts
RELATED REPORTS & OPTIONS
Ethiopia
Massachusetts
Compare Cities
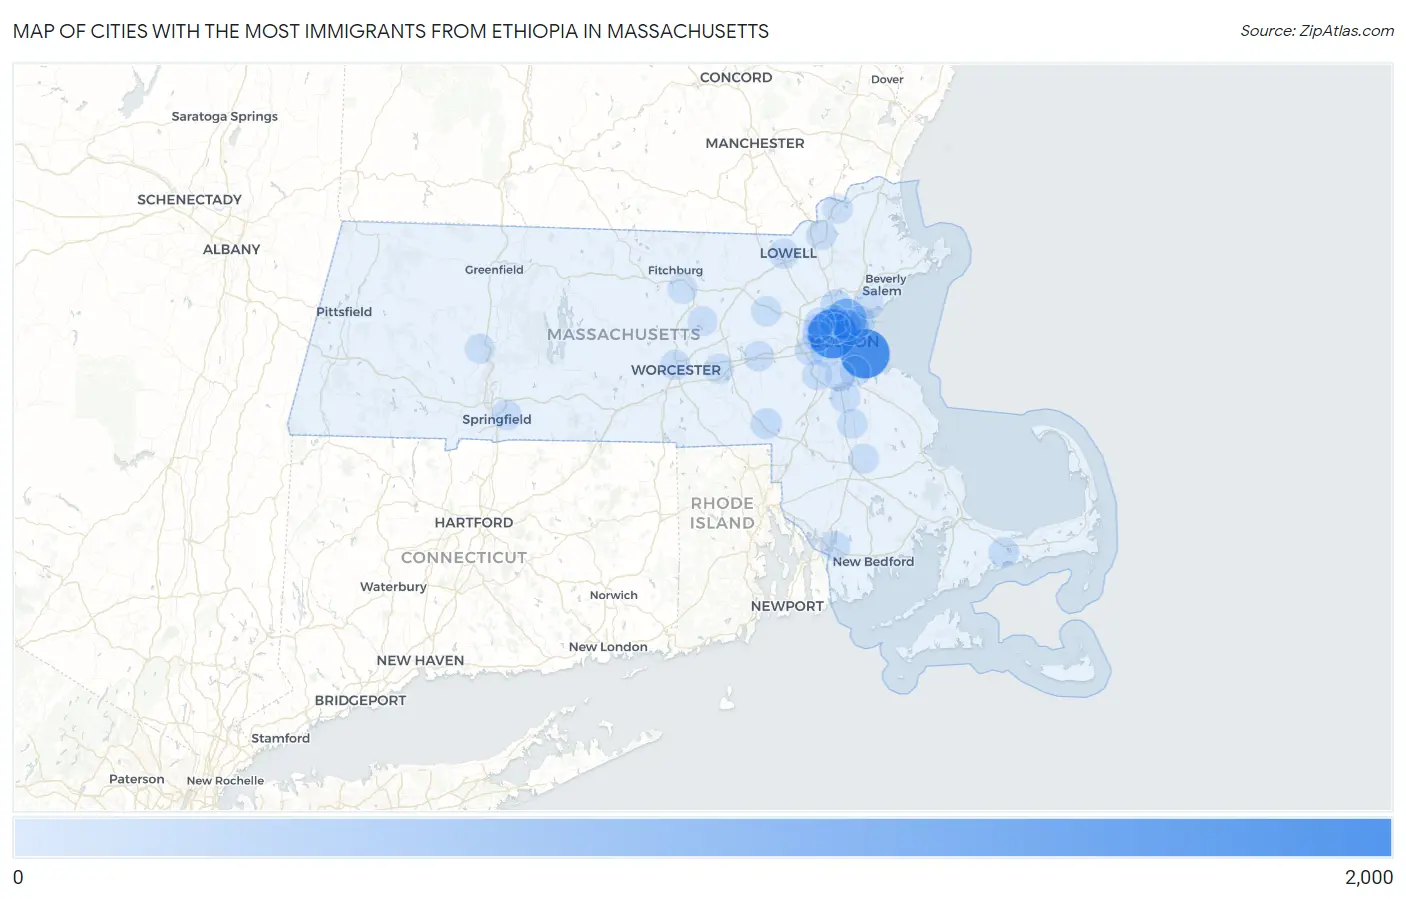
Map of Cities with the Most Immigrants from Ethiopia in Massachusetts
0
2,000
Cities with the Most Immigrants from Ethiopia in Massachusetts
| City | Ethiopia | vs State | vs National | |
| 1. | Boston | 1,520 | 5,467(27.80%)#1 | 275,476(0.55%)#31 |
| 2. | Cambridge | 1,490 | 5,467(27.25%)#2 | 275,476(0.54%)#32 |
| 3. | Malden | 774 | 5,467(14.16%)#3 | 275,476(0.28%)#64 |
| 4. | Chelsea | 398 | 5,467(7.28%)#4 | 275,476(0.14%)#122 |
| 5. | Everett | 131 | 5,467(2.40%)#5 | 275,476(0.05%)#304 |
| 6. | Brookline | 95 | 5,467(1.74%)#6 | 275,476(0.03%)#399 |
| 7. | Stoneham | 90 | 5,467(1.65%)#7 | 275,476(0.03%)#415 |
| 8. | Franklin Town | 76 | 5,467(1.39%)#8 | 275,476(0.03%)#451 |
| 9. | Medford | 58 | 5,467(1.06%)#9 | 275,476(0.02%)#538 |
| 10. | Revere | 56 | 5,467(1.02%)#10 | 275,476(0.02%)#556 |
| 11. | Barnstable Town | 51 | 5,467(0.93%)#11 | 275,476(0.02%)#589 |
| 12. | Somerville | 46 | 5,467(0.84%)#12 | 275,476(0.02%)#622 |
| 13. | Quincy | 43 | 5,467(0.79%)#13 | 275,476(0.02%)#645 |
| 14. | Newton | 39 | 5,467(0.71%)#14 | 275,476(0.01%)#681 |
| 15. | Watertown Town | 37 | 5,467(0.68%)#15 | 275,476(0.01%)#702 |
| 16. | Randolph Town | 35 | 5,467(0.64%)#16 | 275,476(0.01%)#729 |
| 17. | Worcester | 31 | 5,467(0.57%)#17 | 275,476(0.01%)#774 |
| 18. | Springfield | 29 | 5,467(0.53%)#18 | 275,476(0.01%)#800 |
| 19. | Framingham | 28 | 5,467(0.51%)#19 | 275,476(0.01%)#815 |
| 20. | Milton | 28 | 5,467(0.51%)#20 | 275,476(0.01%)#818 |
| 21. | Dedham | 23 | 5,467(0.42%)#21 | 275,476(0.01%)#896 |
| 22. | Fall River | 19 | 5,467(0.35%)#22 | 275,476(0.01%)#964 |
| 23. | Lowell | 17 | 5,467(0.31%)#23 | 275,476(0.01%)#999 |
| 24. | Amherst | 17 | 5,467(0.31%)#24 | 275,476(0.01%)#1,008 |
| 25. | West Concord | 17 | 5,467(0.31%)#25 | 275,476(0.01%)#1,015 |
| 26. | Arlington | 16 | 5,467(0.29%)#26 | 275,476(0.01%)#1,026 |
| 27. | Westborough | 15 | 5,467(0.27%)#27 | 275,476(0.01%)#1,058 |
| 28. | Brockton | 14 | 5,467(0.26%)#28 | 275,476(0.01%)#1,064 |
| 29. | Lawrence | 14 | 5,467(0.26%)#29 | 275,476(0.01%)#1,066 |
| 30. | Belmont | 12 | 5,467(0.22%)#30 | 275,476(0.00%)#1,129 |
| 31. | Leominster | 11 | 5,467(0.20%)#31 | 275,476(0.00%)#1,164 |
| 32. | Haverhill | 10 | 5,467(0.18%)#32 | 275,476(0.00%)#1,184 |
| 33. | Lynn | 9 | 5,467(0.16%)#33 | 275,476(0.00%)#1,204 |
| 34. | Bridgewater Town | 7 | 5,467(0.13%)#34 | 275,476(0.00%)#1,300 |
| 35. | Clinton | 4 | 5,467(0.07%)#35 | 275,476(0.00%)#1,398 |
| 36. | Northampton | 2 | 5,467(0.04%)#36 | 275,476(0.00%)#1,444 |
Common Questions
What are the Top 10 Cities with the Most Immigrants from Ethiopia in Massachusetts?
Top 10 Cities with the Most Immigrants from Ethiopia in Massachusetts are:
What city has the Most Immigrants from Ethiopia in Massachusetts?
Boston has the Most Immigrants from Ethiopia in Massachusetts with 1,520.
What is the Total Immigrants from Ethiopia in the State of Massachusetts?
Total Immigrants from Ethiopia in Massachusetts is 5,467.
What is the Total Immigrants from Ethiopia in the United States?
Total Immigrants from Ethiopia in the United States is 275,476.