Baldwinville, MA
Baldwinville Map
Baldwinville Overview
2,286
TOTAL POPULATION
1,396
MALE POPULATION
890
FEMALE POPULATION
156.85
MALES / 100 FEMALES
63.75
FEMALES / 100 MALES
32.8
MEDIAN AGE
3.3
AVG FAMILY SIZE
2.8
AVG HOUSEHOLD SIZE
$30,037
PER CAPITA INCOME
$90,865
AVG FAMILY INCOME
37.4%
WAGE / INCOME GAP [ % ]
62.6¢/ $1
WAGE / INCOME GAP [ $ ]
0.38
INEQUALITY / GINI INDEX
896
LABOR FORCE [ PEOPLE ]
58.1%
PERCENT IN LABOR FORCE
21.1%
UNEMPLOYMENT RATE
Baldwinville Zip Codes
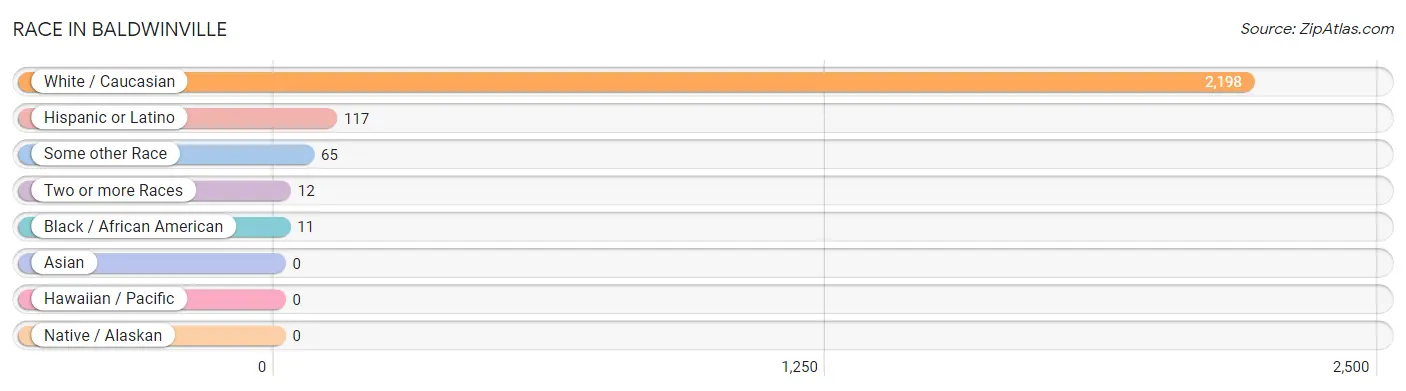
Race in Baldwinville
The most populous races in Baldwinville are White / Caucasian (2,198 | 96.2%), Hispanic or Latino (117 | 5.1%), and Some other Race (65 | 2.8%).
| Race | # Population | % Population |
| Asian | 0 | 0.0% |
| Black / African American | 11 | 0.5% |
| Hawaiian / Pacific | 0 | 0.0% |
| Hispanic or Latino | 117 | 5.1% |
| Native / Alaskan | 0 | 0.0% |
| White / Caucasian | 2,198 | 96.2% |
| Two or more Races | 12 | 0.5% |
| Some other Race | 65 | 2.8% |
| Total | 2,286 | 100.0% |
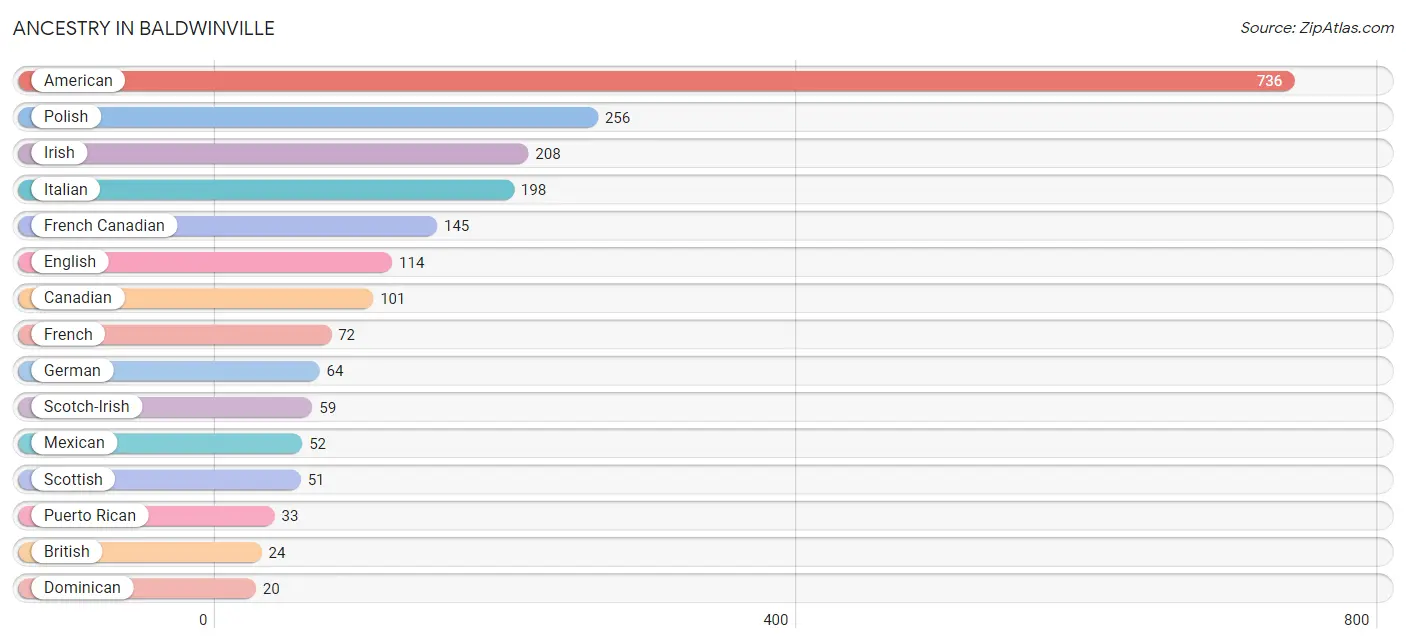
Ancestry in Baldwinville
The most populous ancestries reported in Baldwinville are American (736 | 32.2%), Polish (256 | 11.2%), Irish (208 | 9.1%), Italian (198 | 8.7%), and French Canadian (145 | 6.3%), together accounting for 67.5% of all Baldwinville residents.
| Ancestry | # Population | % Population |
| American | 736 | 32.2% |
| British | 24 | 1.1% |
| Canadian | 101 | 4.4% |
| Cape Verdean | 12 | 0.5% |
| Dominican | 20 | 0.9% |
| English | 114 | 5.0% |
| French | 72 | 3.2% |
| French Canadian | 145 | 6.3% |
| German | 64 | 2.8% |
| Irish | 208 | 9.1% |
| Italian | 198 | 8.7% |
| Mexican | 52 | 2.3% |
| Polish | 256 | 11.2% |
| Puerto Rican | 33 | 1.4% |
| Scotch-Irish | 59 | 2.6% |
| Scottish | 51 | 2.2% |
| South American | 12 | 0.5% |
| Subsaharan African | 12 | 0.5% |
| Swedish | 17 | 0.7% |
| Uruguayan | 12 | 0.5% | View All 20 Rows |
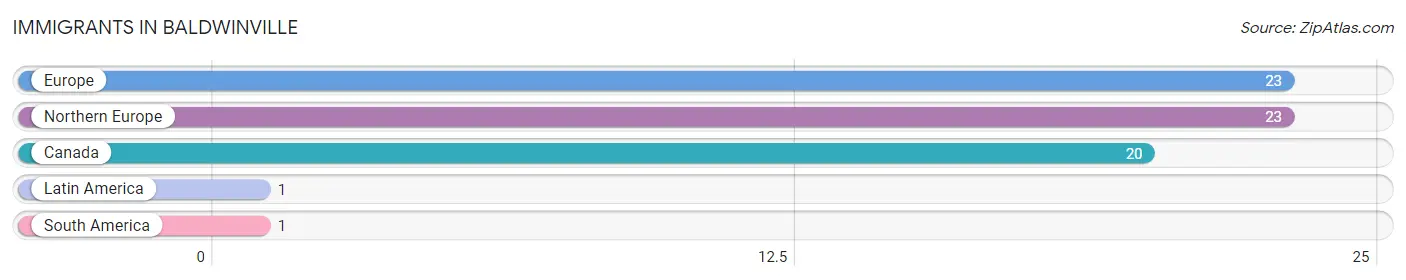
Immigrants in Baldwinville
The most numerous immigrant groups reported in Baldwinville came from Europe (23 | 1.0%), Northern Europe (23 | 1.0%), Canada (20 | 0.9%), Latin America (1 | 0.0%), and South America (1 | 0.0%), together accounting for 3.0% of all Baldwinville residents.
| Immigration Origin | # Population | % Population |
| Canada | 20 | 0.9% |
| Europe | 23 | 1.0% |
| Latin America | 1 | 0.0% |
| Northern Europe | 23 | 1.0% |
| South America | 1 | 0.0% | View All 5 Rows |
Sex and Age in Baldwinville
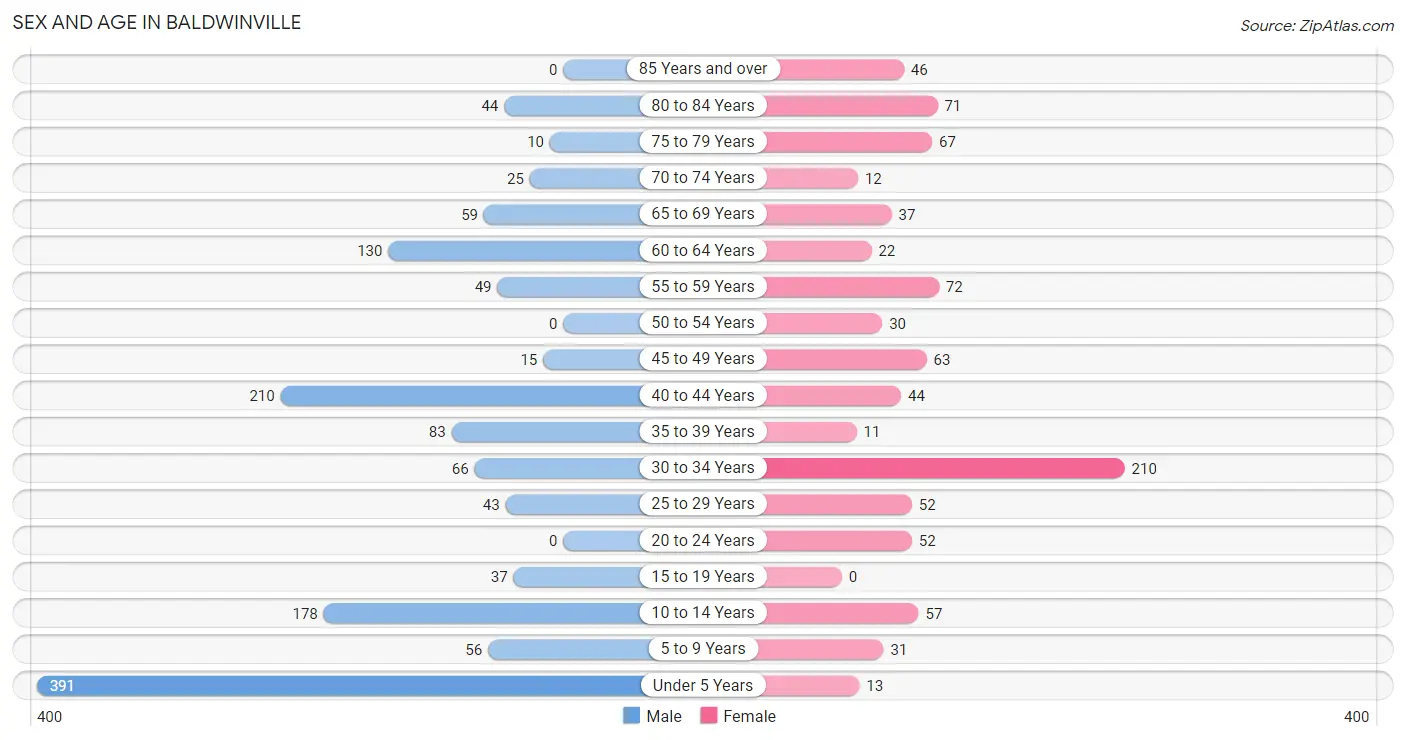
Sex and Age in Baldwinville
The most populous age groups in Baldwinville are Under 5 Years (391 | 28.0%) for men and 30 to 34 Years (210 | 23.6%) for women.
| Age Bracket | Male | Female |
| Under 5 Years | 391 (28.0%) | 13 (1.5%) |
| 5 to 9 Years | 56 (4.0%) | 31 (3.5%) |
| 10 to 14 Years | 178 (12.8%) | 57 (6.4%) |
| 15 to 19 Years | 37 (2.6%) | 0 (0.0%) |
| 20 to 24 Years | 0 (0.0%) | 52 (5.8%) |
| 25 to 29 Years | 43 (3.1%) | 52 (5.8%) |
| 30 to 34 Years | 66 (4.7%) | 210 (23.6%) |
| 35 to 39 Years | 83 (5.9%) | 11 (1.2%) |
| 40 to 44 Years | 210 (15.0%) | 44 (4.9%) |
| 45 to 49 Years | 15 (1.1%) | 63 (7.1%) |
| 50 to 54 Years | 0 (0.0%) | 30 (3.4%) |
| 55 to 59 Years | 49 (3.5%) | 72 (8.1%) |
| 60 to 64 Years | 130 (9.3%) | 22 (2.5%) |
| 65 to 69 Years | 59 (4.2%) | 37 (4.2%) |
| 70 to 74 Years | 25 (1.8%) | 12 (1.3%) |
| 75 to 79 Years | 10 (0.7%) | 67 (7.5%) |
| 80 to 84 Years | 44 (3.2%) | 71 (8.0%) |
| 85 Years and over | 0 (0.0%) | 46 (5.2%) |
| Total | 1,396 (100.0%) | 890 (100.0%) |
Families and Households in Baldwinville
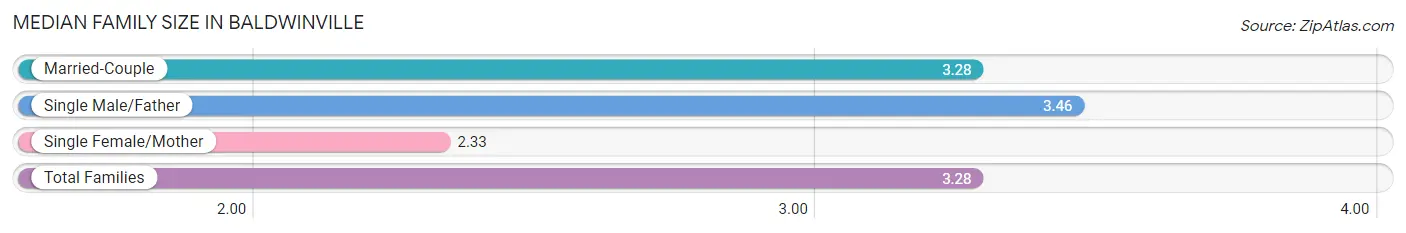
Median Family Size in Baldwinville
The median family size in Baldwinville is 3.28 persons per family, with single male/father families (169 | 33.2%) accounting for the largest median family size of 3.46 persons per family. On the other hand, single female/mother families (36 | 7.1%) represent the smallest median family size with 2.33 persons per family.
| Family Type | # Families | Family Size |
| Married-Couple | 304 (59.7%) | 3.28 |
| Single Male/Father | 169 (33.2%) | 3.46 |
| Single Female/Mother | 36 (7.1%) | 2.33 |
| Total Families | 509 (100.0%) | 3.28 |
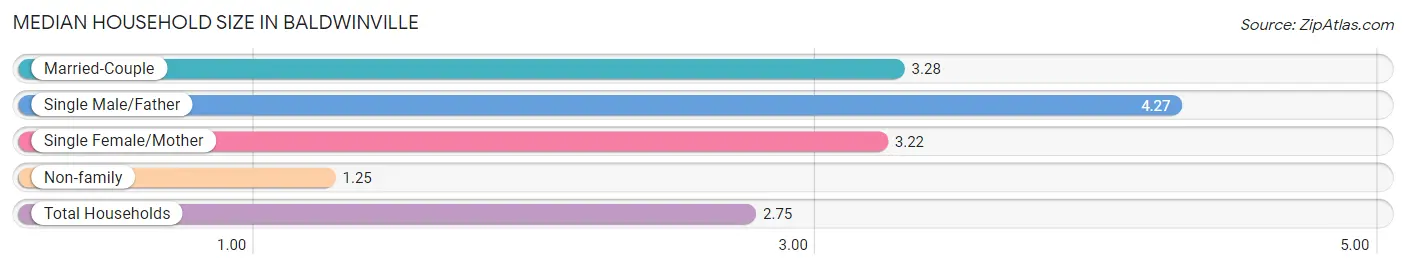
Median Household Size in Baldwinville
The median household size in Baldwinville is 2.75 persons per household, with single male/father households (169 | 21.1%) accounting for the largest median household size of 4.27 persons per household. non-family households (292 | 36.4%) represent the smallest median household size with 1.25 persons per household.
| Household Type | # Households | Household Size |
| Married-Couple | 304 (38.0%) | 3.28 |
| Single Male/Father | 169 (21.1%) | 4.27 |
| Single Female/Mother | 36 (4.5%) | 3.22 |
| Non-family | 292 (36.4%) | 1.25 |
| Total Households | 801 (100.0%) | 2.75 |
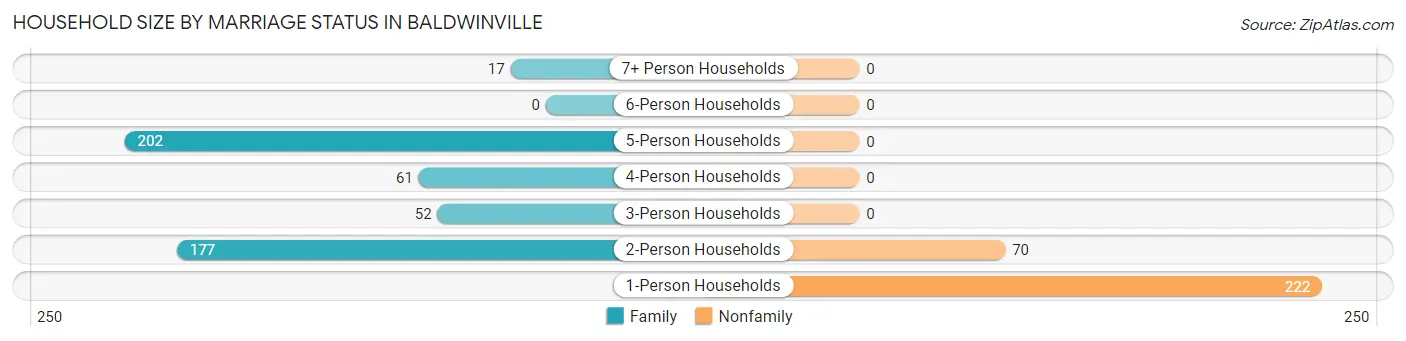
Household Size by Marriage Status in Baldwinville
Out of a total of 801 households in Baldwinville, 509 (63.5%) are family households, while 292 (36.4%) are nonfamily households. The most numerous type of family households are 5-person households, comprising 202, and the most common type of nonfamily households are 1-person households, comprising 222.
| Household Size | Family Households | Nonfamily Households |
| 1-Person Households | - | 222 (27.7%) |
| 2-Person Households | 177 (22.1%) | 70 (8.7%) |
| 3-Person Households | 52 (6.5%) | 0 (0.0%) |
| 4-Person Households | 61 (7.6%) | 0 (0.0%) |
| 5-Person Households | 202 (25.2%) | 0 (0.0%) |
| 6-Person Households | 0 (0.0%) | 0 (0.0%) |
| 7+ Person Households | 17 (2.1%) | 0 (0.0%) |
| Total | 509 (63.5%) | 292 (36.4%) |
Female Fertility in Baldwinville
Fertility by Age in Baldwinville
Average fertility rate in Baldwinville is 339.0 births per 1,000 women. Women in the age bracket of 20 to 34 years have the highest fertility rate with 484.0 births per 1,000 women. Women in the age bracket of 20 to 34 years acount for 100.0% of all women with births.
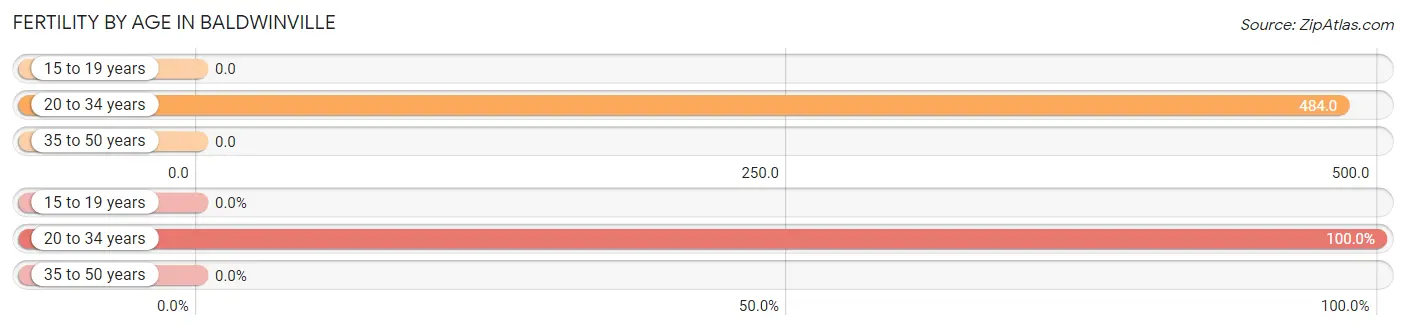
| Age Bracket | Women with Births | Births / 1,000 Women |
| 15 to 19 years | 0 (0.0%) | 0.0 |
| 20 to 34 years | 152 (100.0%) | 484.0 |
| 35 to 50 years | 0 (0.0%) | 0.0 |
| Total | 152 (100.0%) | 339.0 |
Fertility by Age by Marriage Status in Baldwinville
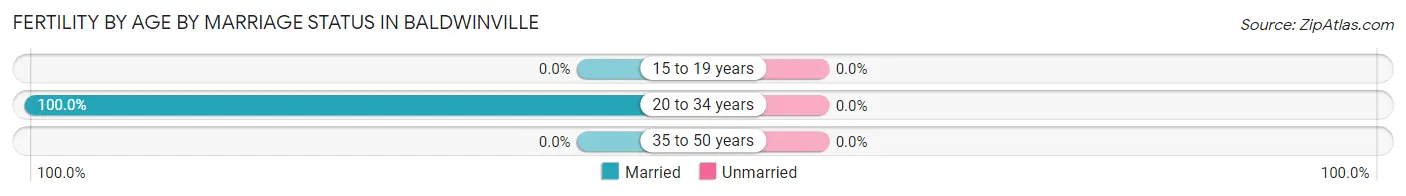
| Age Bracket | Married | Unmarried |
| 15 to 19 years | 0 (0.0%) | 0 (0.0%) |
| 20 to 34 years | 152 (100.0%) | 0 (0.0%) |
| 35 to 50 years | 0 (0.0%) | 0 (0.0%) |
| Total | 152 (100.0%) | 0 (0.0%) |
Fertility by Education in Baldwinville
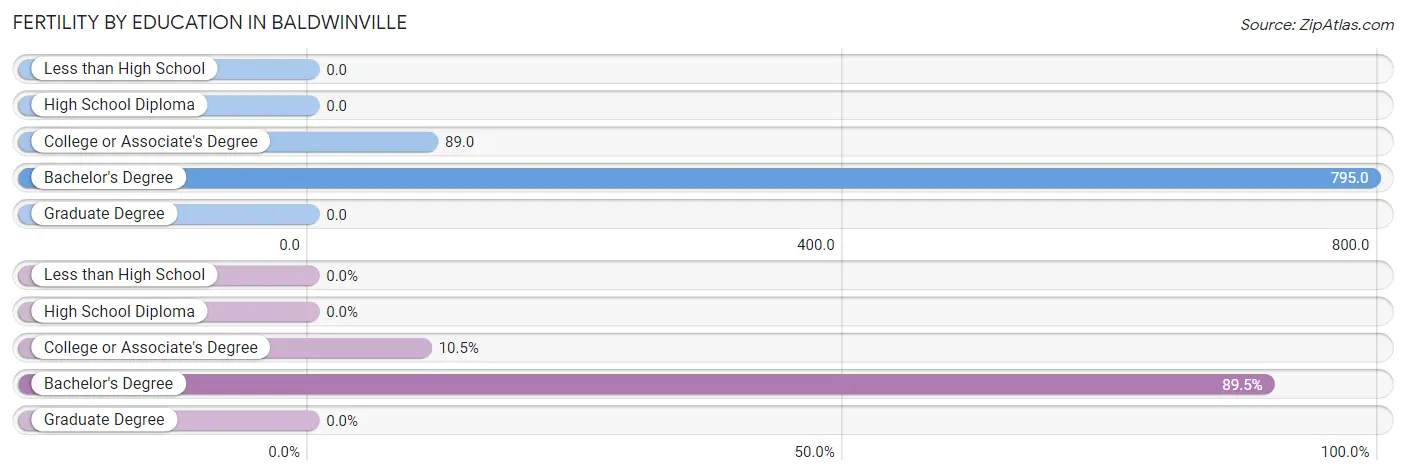
| Educational Attainment | Women with Births | Births / 1,000 Women |
| Less than High School | 0 (0.0%) | 0.0 |
| High School Diploma | 0 (0.0%) | 0.0 |
| College or Associate's Degree | 16 (10.5%) | 89.0 |
| Bachelor's Degree | 136 (89.5%) | 795.0 |
| Graduate Degree | 0 (0.0%) | 0.0 |
| Total | 152 (100.0%) | 339.0 |
Fertility by Education by Marriage Status in Baldwinville
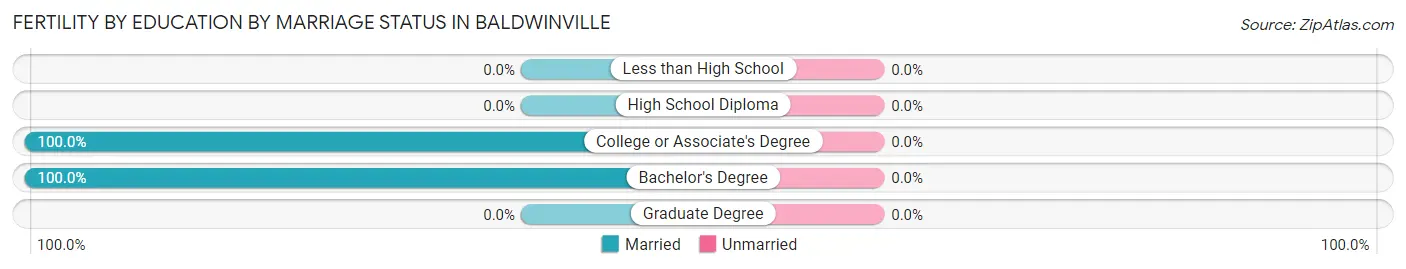
| Educational Attainment | Married | Unmarried |
| Less than High School | 0 (0.0%) | 0 (0.0%) |
| High School Diploma | 0 (0.0%) | 0 (0.0%) |
| College or Associate's Degree | 16 (100.0%) | 0 (0.0%) |
| Bachelor's Degree | 136 (100.0%) | 0 (0.0%) |
| Graduate Degree | 0 (0.0%) | 0 (0.0%) |
| Total | 152 (100.0%) | 0 (0.0%) |
Income in Baldwinville
Income Overview in Baldwinville
| Characteristic | Number | Measure |
| Per Capita Income | 2,286 | $30,037 |
| Median Family Income | 509 | $90,865 |
| Mean Family Income | 509 | $99,062 |
| Median Household Income | 801 | $0 |
| Mean Household Income | 801 | $82,575 |
| Income Deficit | 509 | $0 |
| Wage / Income Gap (%) | 2,286 | 37.39% |
| Wage / Income Gap ($) | 2,286 | 62.61¢ per $1 |
| Gini / Inequality Index | 2,286 | 0.38 |
Earnings by Sex in Baldwinville
Average Earnings in Baldwinville are $47,260, $63,438 for men and $39,717 for women, a difference of 37.4%.
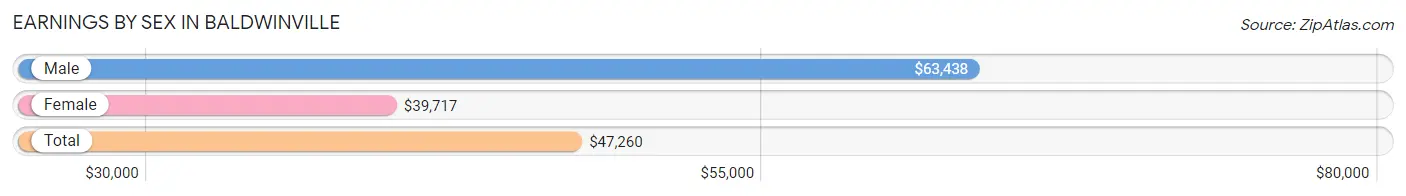
| Sex | Number | Average Earnings |
| Male | 554 (60.2%) | $63,438 |
| Female | 367 (39.9%) | $39,717 |
| Total | 921 (100.0%) | $47,260 |
Earnings by Sex by Income Bracket in Baldwinville
The most common earnings brackets in Baldwinville are $75,000 to $99,999 for men (157 | 28.3%) and $35,000 to $39,999 for women (100 | 27.3%).
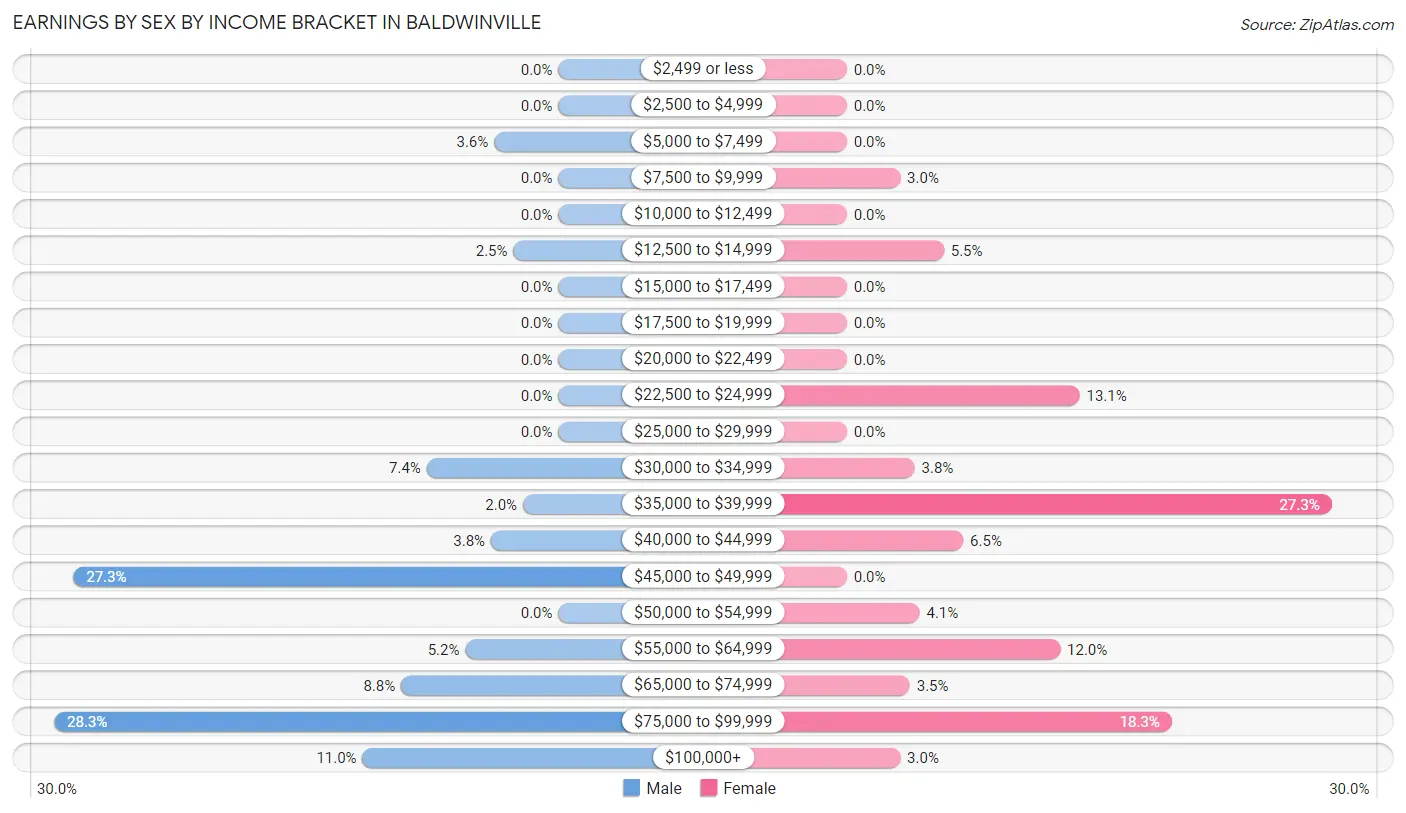
| Income | Male | Female |
| $2,499 or less | 0 (0.0%) | 0 (0.0%) |
| $2,500 to $4,999 | 0 (0.0%) | 0 (0.0%) |
| $5,000 to $7,499 | 20 (3.6%) | 0 (0.0%) |
| $7,500 to $9,999 | 0 (0.0%) | 11 (3.0%) |
| $10,000 to $12,499 | 0 (0.0%) | 0 (0.0%) |
| $12,500 to $14,999 | 14 (2.5%) | 20 (5.4%) |
| $15,000 to $17,499 | 0 (0.0%) | 0 (0.0%) |
| $17,500 to $19,999 | 0 (0.0%) | 0 (0.0%) |
| $20,000 to $22,499 | 0 (0.0%) | 0 (0.0%) |
| $22,500 to $24,999 | 0 (0.0%) | 48 (13.1%) |
| $25,000 to $29,999 | 0 (0.0%) | 0 (0.0%) |
| $30,000 to $34,999 | 41 (7.4%) | 14 (3.8%) |
| $35,000 to $39,999 | 11 (2.0%) | 100 (27.3%) |
| $40,000 to $44,999 | 21 (3.8%) | 24 (6.5%) |
| $45,000 to $49,999 | 151 (27.3%) | 0 (0.0%) |
| $50,000 to $54,999 | 0 (0.0%) | 15 (4.1%) |
| $55,000 to $64,999 | 29 (5.2%) | 44 (12.0%) |
| $65,000 to $74,999 | 49 (8.8%) | 13 (3.5%) |
| $75,000 to $99,999 | 157 (28.3%) | 67 (18.3%) |
| $100,000+ | 61 (11.0%) | 11 (3.0%) |
| Total | 554 (100.0%) | 367 (100.0%) |
Earnings by Sex by Educational Attainment in Baldwinville
Average earnings in Baldwinville are $65,000 for men and $39,758 for women, a difference of 38.8%. Men with an educational attainment of bachelor's degree enjoy the highest average annual earnings of $87,583, while those with less than high school education earn the least with $46,358. Women with an educational attainment of graduate degree earn the most with the average annual earnings of $78,676, while those with high school diploma education have the smallest earnings of $32,589.
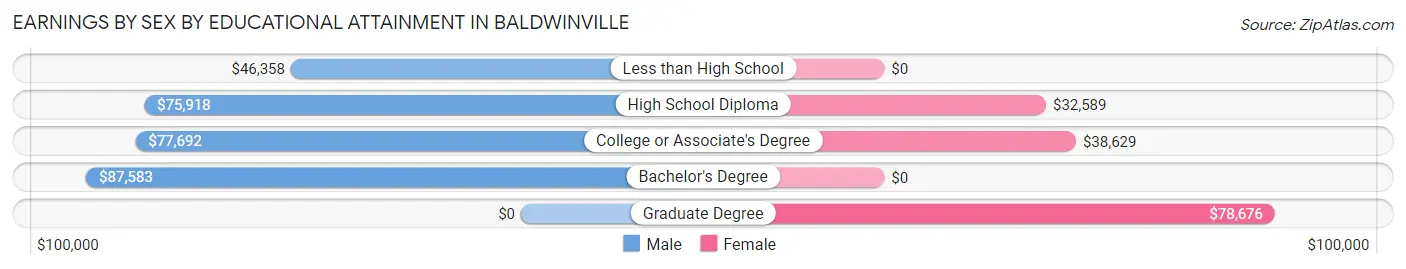
| Educational Attainment | Male Income | Female Income |
| Less than High School | $46,358 | $0 |
| High School Diploma | $75,918 | $32,589 |
| College or Associate's Degree | $77,692 | $38,629 |
| Bachelor's Degree | $87,583 | $0 |
| Graduate Degree | - | - |
| Total | $65,000 | $39,758 |
Family Income in Baldwinville
Family Income Brackets in Baldwinville
According to the Baldwinville family income data, there are 189 families falling into the $35,000 to $49,999 income range, which is the most common income bracket and makes up 37.1% of all families.
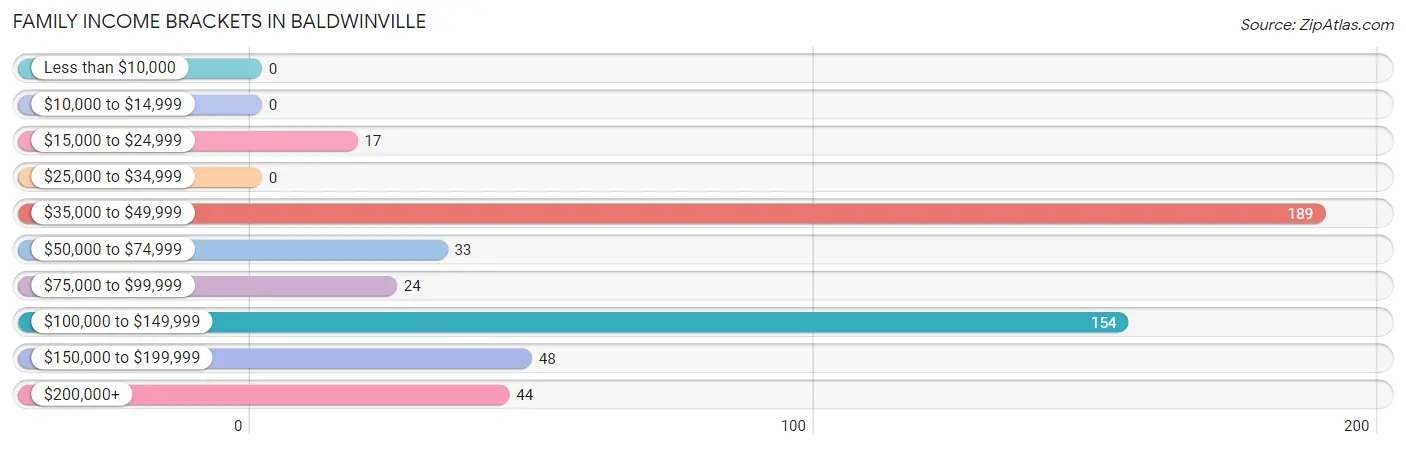
| Income Bracket | # Families | % Families |
| Less than $10,000 | 0 | 0.0% |
| $10,000 to $14,999 | 0 | 0.0% |
| $15,000 to $24,999 | 17 | 3.3% |
| $25,000 to $34,999 | 0 | 0.0% |
| $35,000 to $49,999 | 189 | 37.1% |
| $50,000 to $74,999 | 33 | 6.5% |
| $75,000 to $99,999 | 24 | 4.7% |
| $100,000 to $149,999 | 154 | 30.3% |
| $150,000 to $199,999 | 48 | 9.4% |
| $200,000+ | 44 | 8.6% |
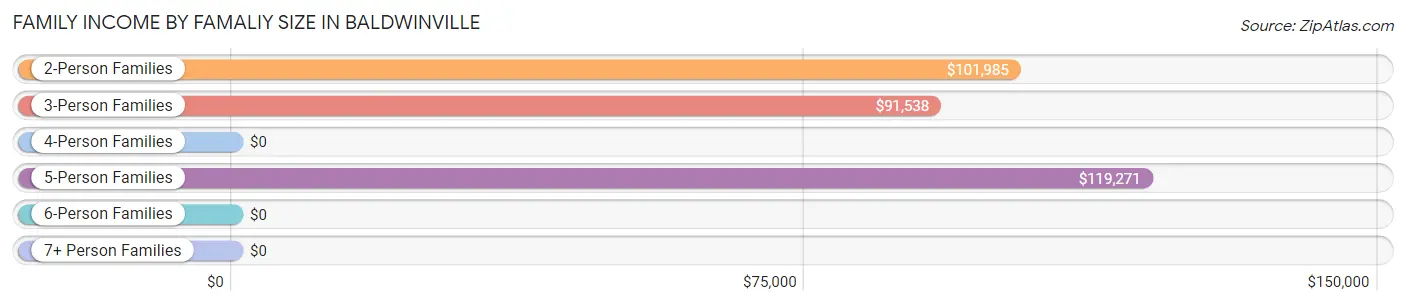
Family Income by Famaliy Size in Baldwinville
5-person families (51 | 10.0%) account for the highest median family income in Baldwinville with $119,271 per family, while 2-person families (201 | 39.5%) have the highest median income of $50,992 per family member.
| Income Bracket | # Families | Median Income |
| 2-Person Families | 201 (39.5%) | $101,985 |
| 3-Person Families | 40 (7.9%) | $91,538 |
| 4-Person Families | 200 (39.3%) | $0 |
| 5-Person Families | 51 (10.0%) | $119,271 |
| 6-Person Families | 0 (0.0%) | $0 |
| 7+ Person Families | 17 (3.3%) | $0 |
| Total | 509 (100.0%) | $90,865 |
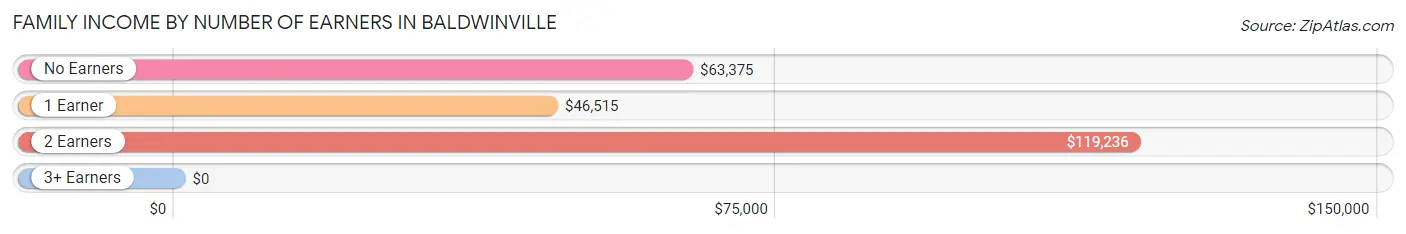
Family Income by Number of Earners in Baldwinville
| Number of Earners | # Families | Median Income |
| No Earners | 69 (13.6%) | $63,375 |
| 1 Earner | 231 (45.4%) | $46,515 |
| 2 Earners | 176 (34.6%) | $119,236 |
| 3+ Earners | 33 (6.5%) | $0 |
| Total | 509 (100.0%) | $90,865 |
Household Income in Baldwinville
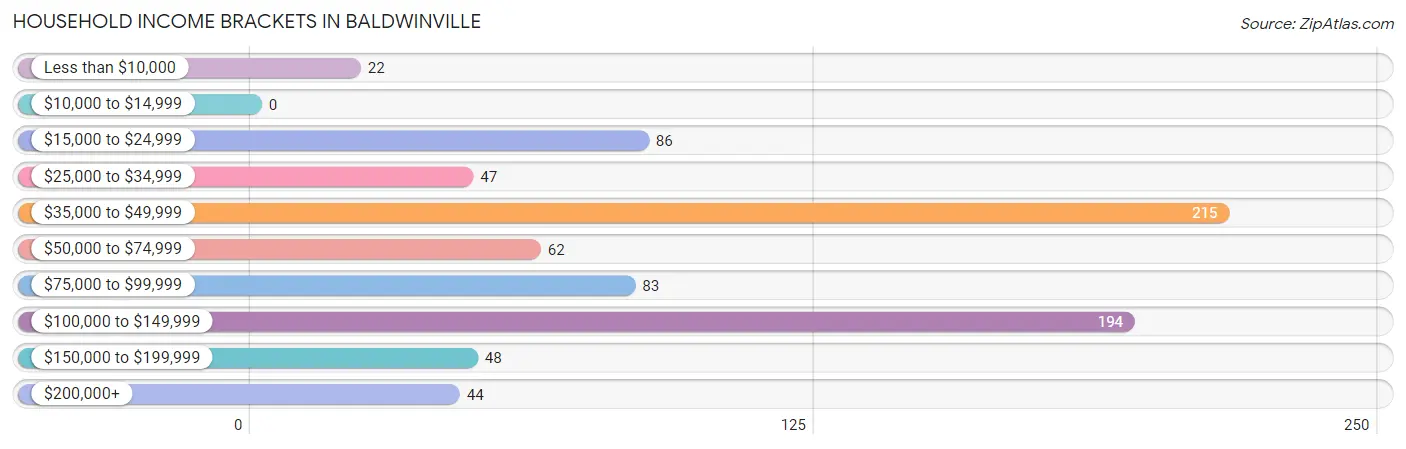
Household Income Brackets in Baldwinville
With 215 households falling in the category, the $35,000 to $49,999 income range is the most frequent in Baldwinville, accounting for 26.8% of all households.
| Income Bracket | # Households | % Households |
| Less than $10,000 | 22 | 2.7% |
| $10,000 to $14,999 | 0 | 0.0% |
| $15,000 to $24,999 | 86 | 10.7% |
| $25,000 to $34,999 | 47 | 5.9% |
| $35,000 to $49,999 | 215 | 26.8% |
| $50,000 to $74,999 | 62 | 7.7% |
| $75,000 to $99,999 | 83 | 10.4% |
| $100,000 to $149,999 | 194 | 24.2% |
| $150,000 to $199,999 | 48 | 6.0% |
| $200,000+ | 44 | 5.5% |
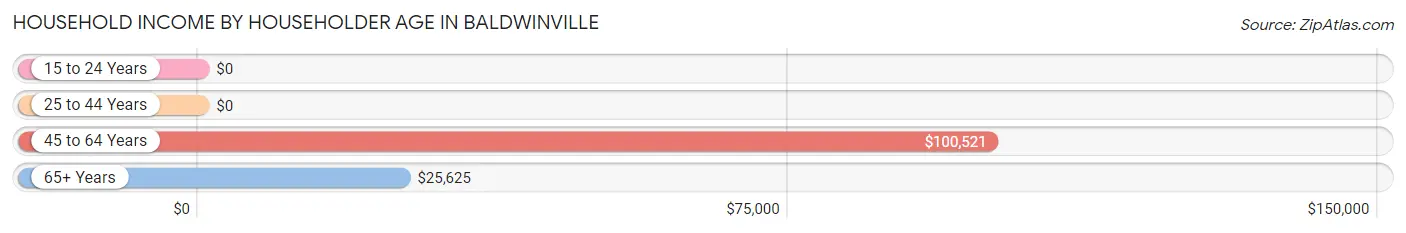
Household Income by Householder Age in Baldwinville
The median household income in Baldwinville is $0, with the highest median household income of $100,521 found in the 45 to 64 years age bracket for the primary householder. A total of 217 households (27.1%) fall into this category. Meanwhile, the 15 to 24 years age bracket for the primary householder has the lowest median household income of $0, with 15 households (1.9%) in this group.
| Income Bracket | # Households | Median Income |
| 15 to 24 Years | 15 (1.9%) | $0 |
| 25 to 44 Years | 349 (43.6%) | $0 |
| 45 to 64 Years | 217 (27.1%) | $100,521 |
| 65+ Years | 220 (27.5%) | $25,625 |
| Total | 801 (100.0%) | $0 |
Poverty in Baldwinville
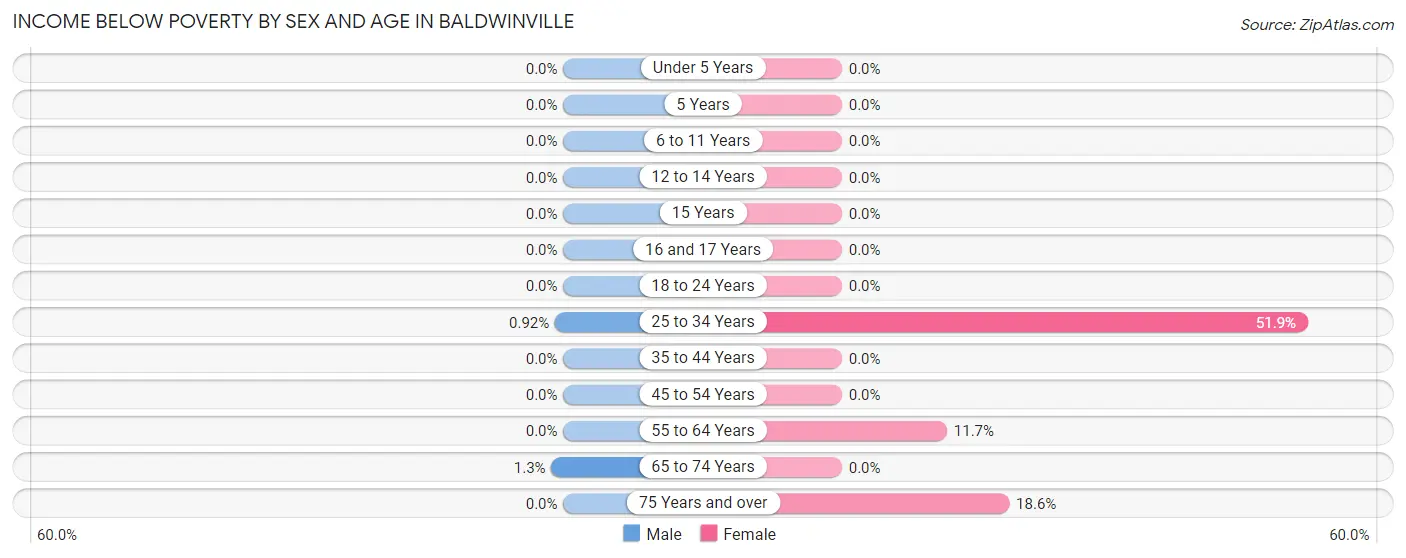
Income Below Poverty by Sex and Age in Baldwinville
With 0.2% poverty level for males and 20.5% for females among the residents of Baldwinville, 65 to 74 year old males and 25 to 34 year old females are the most vulnerable to poverty, with 1 males (1.3%) and 136 females (51.9%) in their respective age groups living below the poverty level.
| Age Bracket | Male | Female |
| Under 5 Years | 0 (0.0%) | 0 (0.0%) |
| 5 Years | 0 (0.0%) | 0 (0.0%) |
| 6 to 11 Years | 0 (0.0%) | 0 (0.0%) |
| 12 to 14 Years | 0 (0.0%) | 0 (0.0%) |
| 15 Years | 0 (0.0%) | 0 (0.0%) |
| 16 and 17 Years | 0 (0.0%) | 0 (0.0%) |
| 18 to 24 Years | 0 (0.0%) | 0 (0.0%) |
| 25 to 34 Years | 1 (0.9%) | 136 (51.9%) |
| 35 to 44 Years | 0 (0.0%) | 0 (0.0%) |
| 45 to 54 Years | 0 (0.0%) | 0 (0.0%) |
| 55 to 64 Years | 0 (0.0%) | 11 (11.7%) |
| 65 to 74 Years | 1 (1.3%) | 0 (0.0%) |
| 75 Years and over | 0 (0.0%) | 22 (18.6%) |
| Total | 2 (0.2%) | 169 (20.5%) |
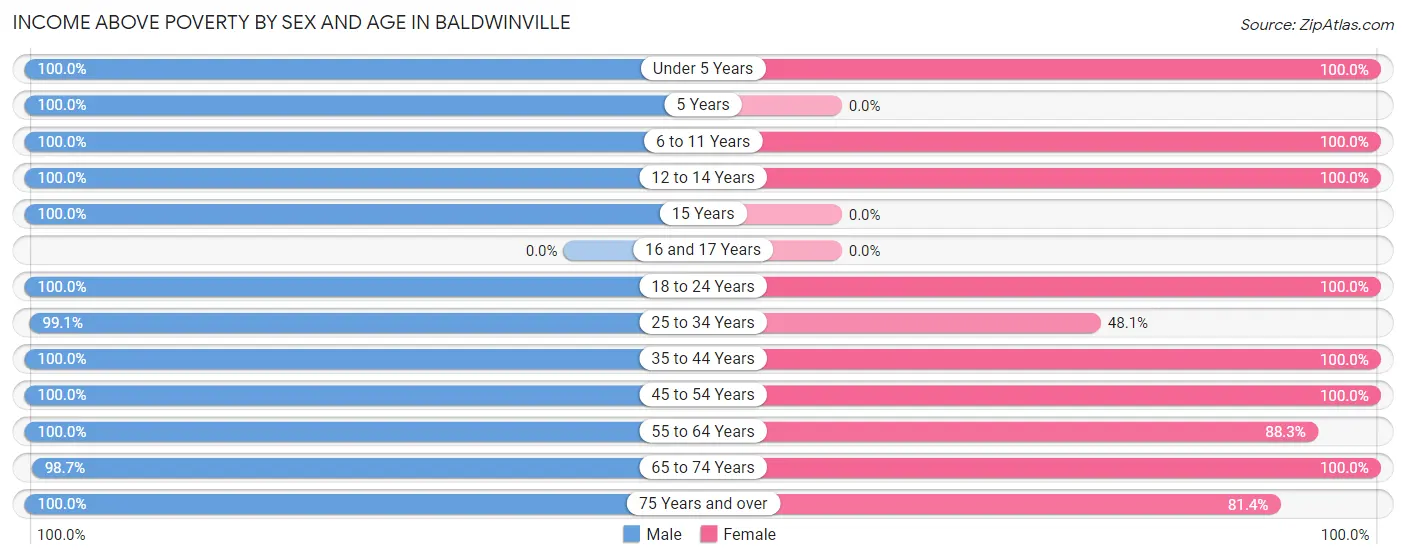
Income Above Poverty by Sex and Age in Baldwinville
According to the poverty statistics in Baldwinville, males aged under 5 years and females aged under 5 years are the age groups that are most secure financially, with 100.0% of males and 100.0% of females in these age groups living above the poverty line.
| Age Bracket | Male | Female |
| Under 5 Years | 391 (100.0%) | 13 (100.0%) |
| 5 Years | 16 (100.0%) | 0 (0.0%) |
| 6 to 11 Years | 40 (100.0%) | 48 (100.0%) |
| 12 to 14 Years | 178 (100.0%) | 40 (100.0%) |
| 15 Years | 17 (100.0%) | 0 (0.0%) |
| 16 and 17 Years | 0 (0.0%) | 0 (0.0%) |
| 18 to 24 Years | 20 (100.0%) | 52 (100.0%) |
| 25 to 34 Years | 108 (99.1%) | 126 (48.1%) |
| 35 to 44 Years | 293 (100.0%) | 55 (100.0%) |
| 45 to 54 Years | 15 (100.0%) | 93 (100.0%) |
| 55 to 64 Years | 169 (100.0%) | 83 (88.3%) |
| 65 to 74 Years | 74 (98.7%) | 49 (100.0%) |
| 75 Years and over | 54 (100.0%) | 96 (81.4%) |
| Total | 1,375 (99.9%) | 655 (79.5%) |
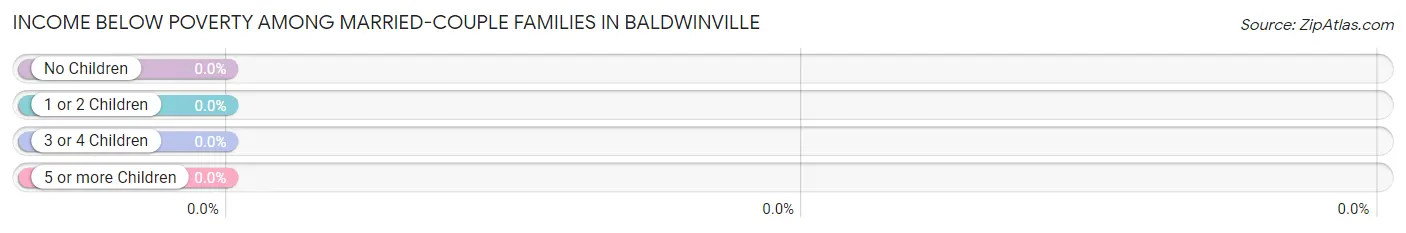
Income Below Poverty Among Married-Couple Families in Baldwinville
| Children | Above Poverty | Below Poverty |
| No Children | 190 (100.0%) | 0 (0.0%) |
| 1 or 2 Children | 46 (100.0%) | 0 (0.0%) |
| 3 or 4 Children | 68 (100.0%) | 0 (0.0%) |
| 5 or more Children | 0 (0.0%) | 0 (0.0%) |
| Total | 304 (100.0%) | 0 (0.0%) |
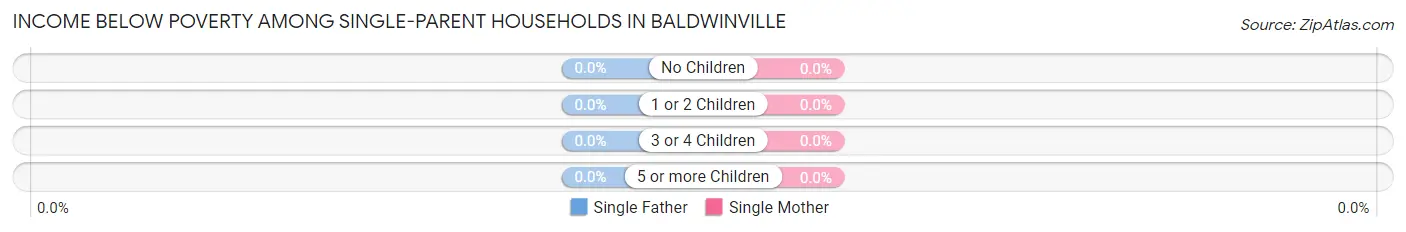
Income Below Poverty Among Single-Parent Households in Baldwinville
| Children | Single Father | Single Mother |
| No Children | 0 (0.0%) | 0 (0.0%) |
| 1 or 2 Children | 0 (0.0%) | 0 (0.0%) |
| 3 or 4 Children | 0 (0.0%) | 0 (0.0%) |
| 5 or more Children | 0 (0.0%) | 0 (0.0%) |
| Total | 0 (0.0%) | 0 (0.0%) |
Income Below Poverty Among Married-Couple vs Single-Parent Households in Baldwinville
| Children | Married-Couple Families | Single-Parent Households |
| No Children | 0 (0.0%) | 0 (0.0%) |
| 1 or 2 Children | 0 (0.0%) | 0 (0.0%) |
| 3 or 4 Children | 0 (0.0%) | 0 (0.0%) |
| 5 or more Children | 0 (0.0%) | 0 (0.0%) |
| Total | 0 (0.0%) | 0 (0.0%) |
Employment Characteristics in Baldwinville
Employment by Class of Employer in Baldwinville
Among the 707 employed individuals in Baldwinville, private company employees (436 | 61.7%), not-for-profit organizations (67 | 9.5%), and self-employed (not incorporated) (61 | 8.6%) make up the most common classes of employment.
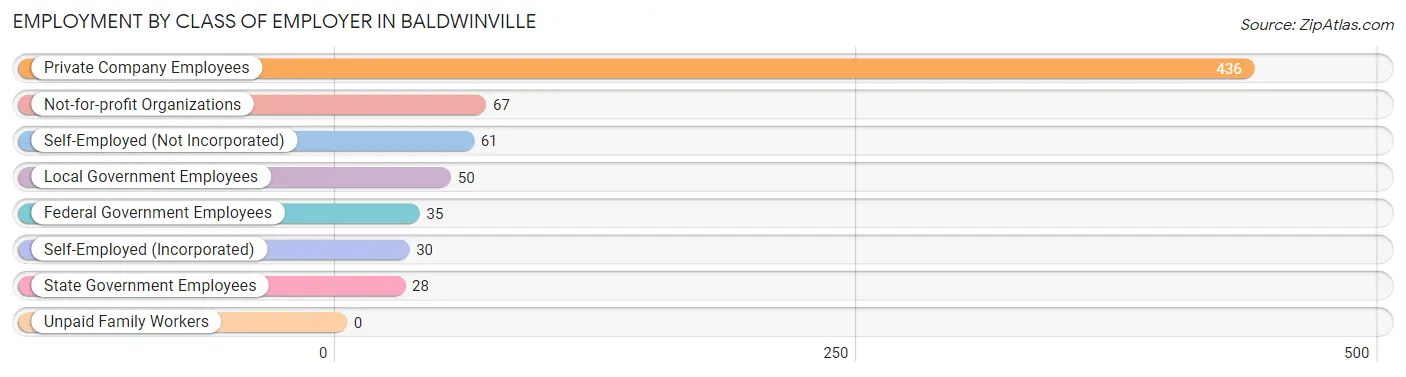
| Employer Class | # Employees | % Employees |
| Private Company Employees | 436 | 61.7% |
| Self-Employed (Incorporated) | 30 | 4.2% |
| Self-Employed (Not Incorporated) | 61 | 8.6% |
| Not-for-profit Organizations | 67 | 9.5% |
| Local Government Employees | 50 | 7.1% |
| State Government Employees | 28 | 4.0% |
| Federal Government Employees | 35 | 5.0% |
| Unpaid Family Workers | 0 | 0.0% |
| Total | 707 | 100.0% |
Employment Status by Age in Baldwinville
According to the labor force statistics for Baldwinville, out of the total population over 16 years of age (1,543), 58.1% or 896 individuals are in the labor force, with 21.1% or 189 of them unemployed. The age group with the highest labor force participation rate is 16 to 19 years, with 100.0% or 20 individuals in the labor force. Within the labor force, the 65 to 74 years age range has the highest percentage of unemployed individuals, with 100.0% or 18 of them being unemployed.
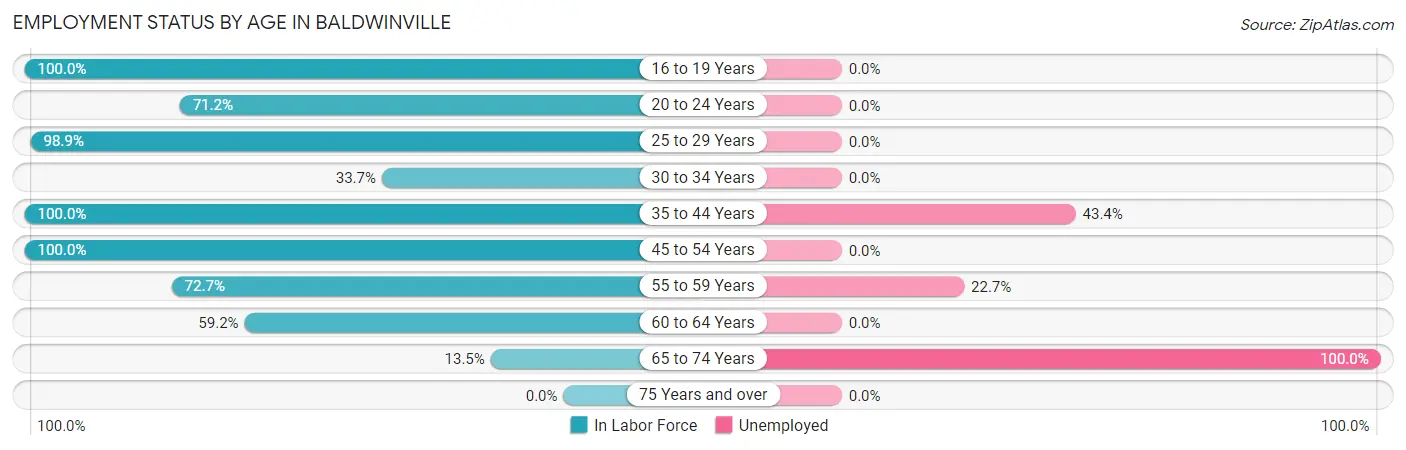
| Age Bracket | In Labor Force | Unemployed |
| 16 to 19 Years | 20 (100.0%) | 0 (0.0%) |
| 20 to 24 Years | 37 (71.2%) | 0 (0.0%) |
| 25 to 29 Years | 94 (98.9%) | 0 (0.0%) |
| 30 to 34 Years | 93 (33.7%) | 0 (0.0%) |
| 35 to 44 Years | 348 (100.0%) | 151 (43.4%) |
| 45 to 54 Years | 108 (100.0%) | 0 (0.0%) |
| 55 to 59 Years | 88 (72.7%) | 20 (22.7%) |
| 60 to 64 Years | 90 (59.2%) | 0 (0.0%) |
| 65 to 74 Years | 18 (13.5%) | 18 (100.0%) |
| 75 Years and over | 0 (0.0%) | 0 (0.0%) |
| Total | 896 (58.1%) | 189 (21.1%) |
Employment Status by Educational Attainment in Baldwinville
According to labor force statistics for Baldwinville, 74.6% of individuals (821) out of the total population between 25 and 64 years of age (1,100) are in the labor force, with 20.8% or 171 of them being unemployed. The group with the highest labor force participation rate are those with the educational attainment of less than high school, with 94.7% or 197 individuals in the labor force. Within the labor force, individuals with less than high school education have the highest percentage of unemployment, with 76.6% or 151 of them being unemployed.
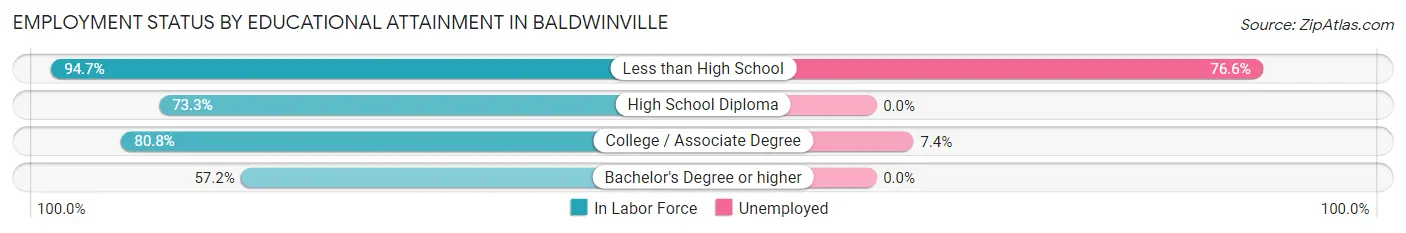
| Educational Attainment | In Labor Force | Unemployed |
| Less than High School | 197 (94.7%) | 159 (76.6%) |
| High School Diploma | 159 (73.3%) | 0 (0.0%) |
| College / Associate Degree | 270 (80.8%) | 25 (7.4%) |
| Bachelor's Degree or higher | 195 (57.2%) | 0 (0.0%) |
| Total | 821 (74.6%) | 229 (20.8%) |
Employment Occupations by Sex in Baldwinville
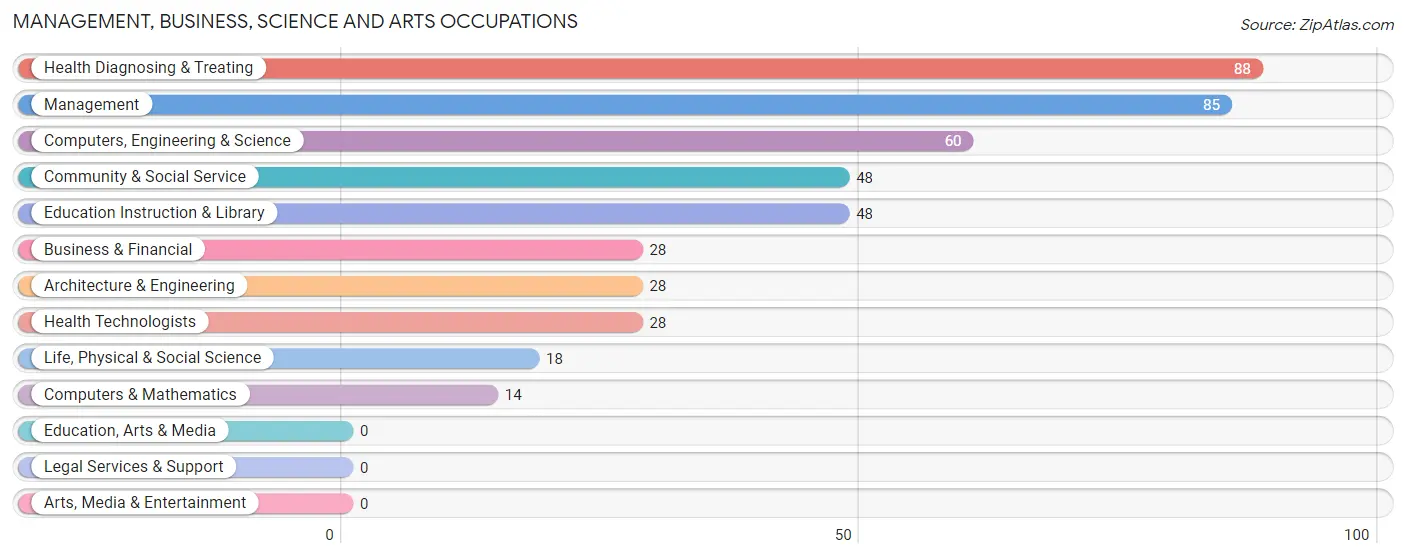
Management, Business, Science and Arts Occupations
The most common Management, Business, Science and Arts occupations in Baldwinville are Health Diagnosing & Treating (88 | 12.4%), Management (85 | 12.0%), Computers, Engineering & Science (60 | 8.5%), Community & Social Service (48 | 6.8%), and Education Instruction & Library (48 | 6.8%).
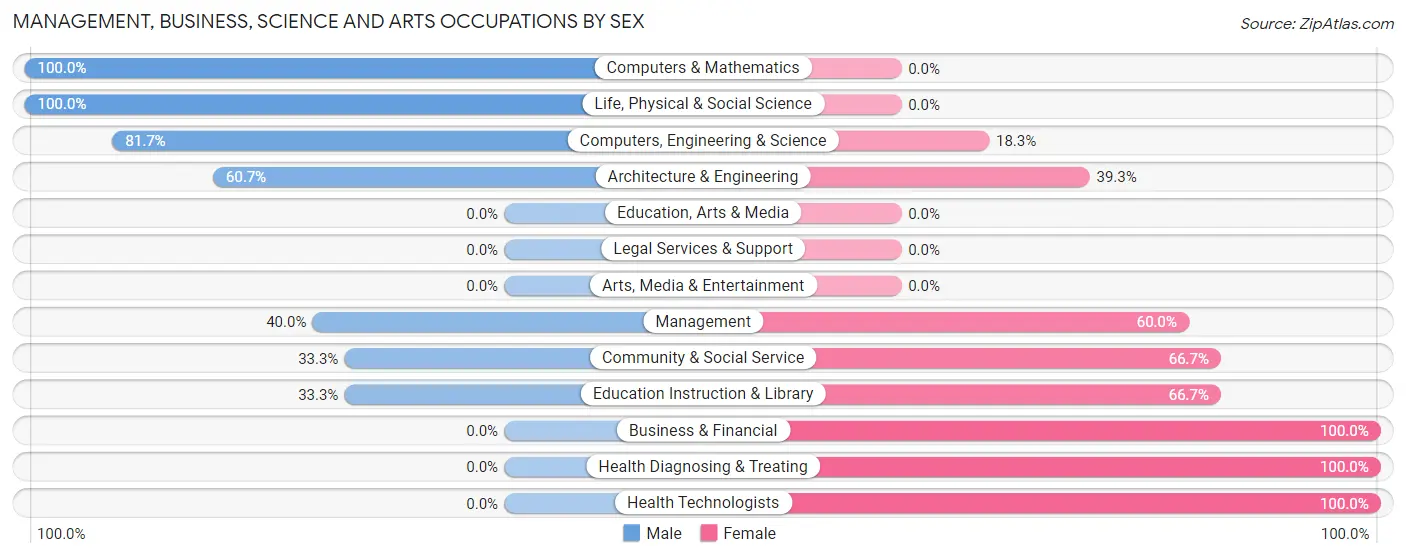
Management, Business, Science and Arts Occupations by Sex
Within the Management, Business, Science and Arts occupations in Baldwinville, the most male-oriented occupations are Computers & Mathematics (100.0%), Life, Physical & Social Science (100.0%), and Computers, Engineering & Science (81.7%), while the most female-oriented occupations are Business & Financial (100.0%), Health Diagnosing & Treating (100.0%), and Health Technologists (100.0%).
| Occupation | Male | Female |
| Management | 34 (40.0%) | 51 (60.0%) |
| Business & Financial | 0 (0.0%) | 28 (100.0%) |
| Computers, Engineering & Science | 49 (81.7%) | 11 (18.3%) |
| Computers & Mathematics | 14 (100.0%) | 0 (0.0%) |
| Architecture & Engineering | 17 (60.7%) | 11 (39.3%) |
| Life, Physical & Social Science | 18 (100.0%) | 0 (0.0%) |
| Community & Social Service | 16 (33.3%) | 32 (66.7%) |
| Education, Arts & Media | 0 (0.0%) | 0 (0.0%) |
| Legal Services & Support | 0 (0.0%) | 0 (0.0%) |
| Education Instruction & Library | 16 (33.3%) | 32 (66.7%) |
| Arts, Media & Entertainment | 0 (0.0%) | 0 (0.0%) |
| Health Diagnosing & Treating | 0 (0.0%) | 88 (100.0%) |
| Health Technologists | 0 (0.0%) | 28 (100.0%) |
| Total (Category) | 99 (32.0%) | 210 (68.0%) |
| Total (Overall) | 360 (50.9%) | 347 (49.1%) |
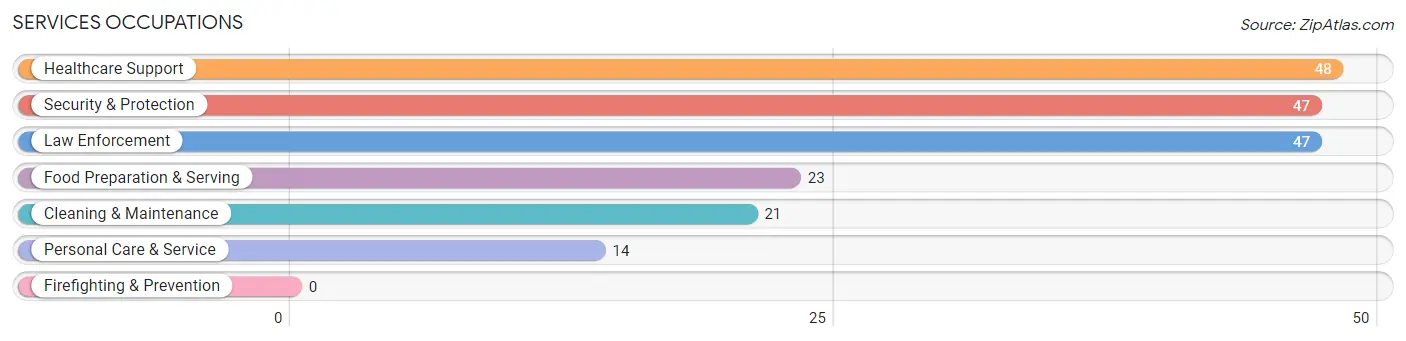
Services Occupations
The most common Services occupations in Baldwinville are Healthcare Support (48 | 6.8%), Security & Protection (47 | 6.7%), Law Enforcement (47 | 6.7%), Food Preparation & Serving (23 | 3.3%), and Cleaning & Maintenance (21 | 3.0%).
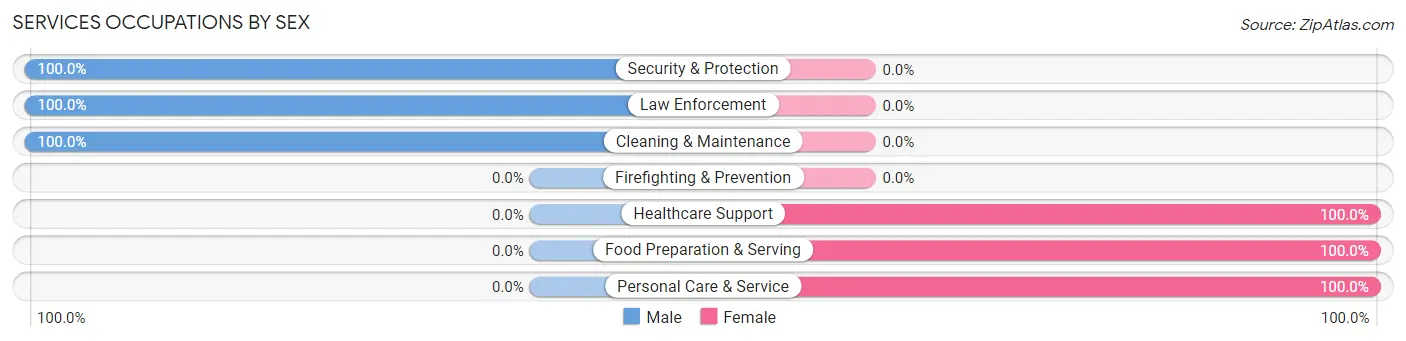
Services Occupations by Sex
Within the Services occupations in Baldwinville, the most male-oriented occupations are Security & Protection (100.0%), Law Enforcement (100.0%), and Cleaning & Maintenance (100.0%), while the most female-oriented occupations are Healthcare Support (100.0%), Food Preparation & Serving (100.0%), and Personal Care & Service (100.0%).
| Occupation | Male | Female |
| Healthcare Support | 0 (0.0%) | 48 (100.0%) |
| Security & Protection | 47 (100.0%) | 0 (0.0%) |
| Firefighting & Prevention | 0 (0.0%) | 0 (0.0%) |
| Law Enforcement | 47 (100.0%) | 0 (0.0%) |
| Food Preparation & Serving | 0 (0.0%) | 23 (100.0%) |
| Cleaning & Maintenance | 21 (100.0%) | 0 (0.0%) |
| Personal Care & Service | 0 (0.0%) | 14 (100.0%) |
| Total (Category) | 68 (44.4%) | 85 (55.6%) |
| Total (Overall) | 360 (50.9%) | 347 (49.1%) |
Sales and Office Occupations
The most common Sales and Office occupations in Baldwinville are Sales & Related (80 | 11.3%), and Office & Administration (63 | 8.9%).
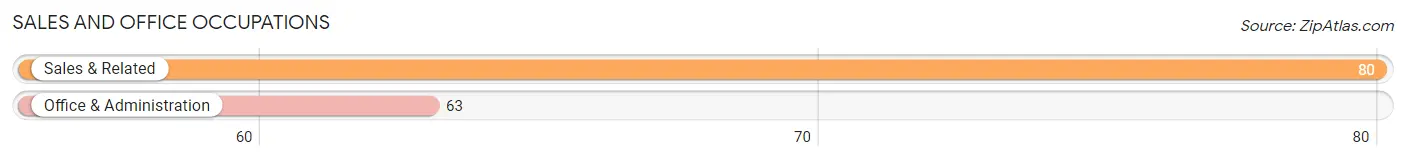
Sales and Office Occupations by Sex

| Occupation | Male | Female |
| Sales & Related | 80 (100.0%) | 0 (0.0%) |
| Office & Administration | 11 (17.5%) | 52 (82.5%) |
| Total (Category) | 91 (63.6%) | 52 (36.4%) |
| Total (Overall) | 360 (50.9%) | 347 (49.1%) |
Natural Resources, Construction and Maintenance Occupations
The most common Natural Resources, Construction and Maintenance occupations in Baldwinville are Construction & Extraction (38 | 5.4%), and Installation, Maintenance & Repair (36 | 5.1%).
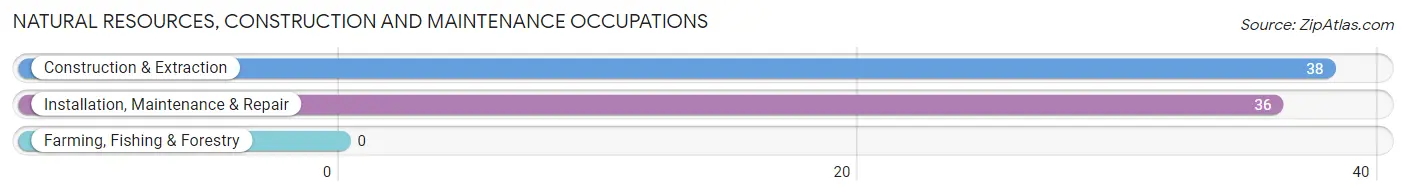
Natural Resources, Construction and Maintenance Occupations by Sex

| Occupation | Male | Female |
| Farming, Fishing & Forestry | 0 (0.0%) | 0 (0.0%) |
| Construction & Extraction | 38 (100.0%) | 0 (0.0%) |
| Installation, Maintenance & Repair | 36 (100.0%) | 0 (0.0%) |
| Total (Category) | 74 (100.0%) | 0 (0.0%) |
| Total (Overall) | 360 (50.9%) | 347 (49.1%) |
Production, Transportation and Moving Occupations
The most common Production, Transportation and Moving occupations in Baldwinville are Production (16 | 2.3%), and Transportation (12 | 1.7%).
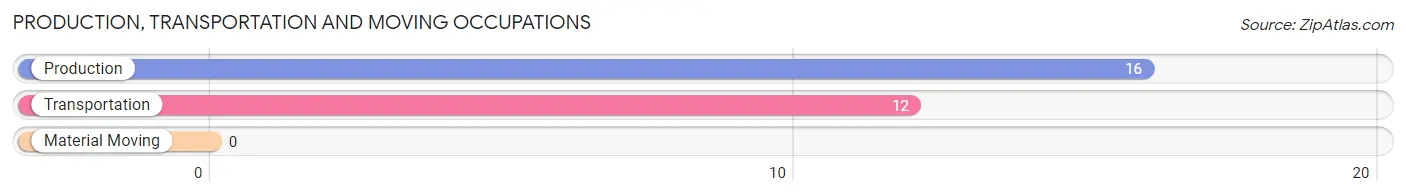
Production, Transportation and Moving Occupations by Sex
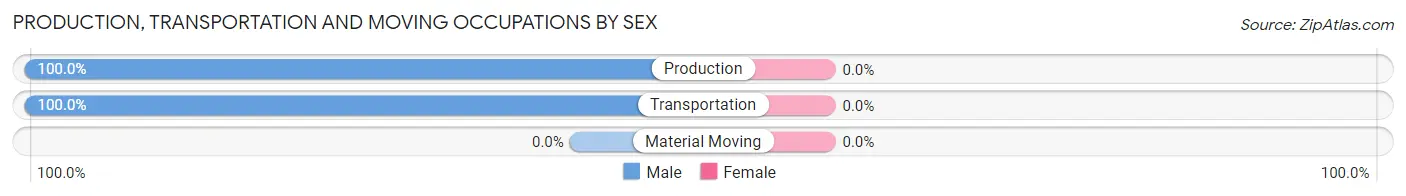
| Occupation | Male | Female |
| Production | 16 (100.0%) | 0 (0.0%) |
| Transportation | 12 (100.0%) | 0 (0.0%) |
| Material Moving | 0 (0.0%) | 0 (0.0%) |
| Total (Category) | 28 (100.0%) | 0 (0.0%) |
| Total (Overall) | 360 (50.9%) | 347 (49.1%) |
Employment Industries by Sex in Baldwinville
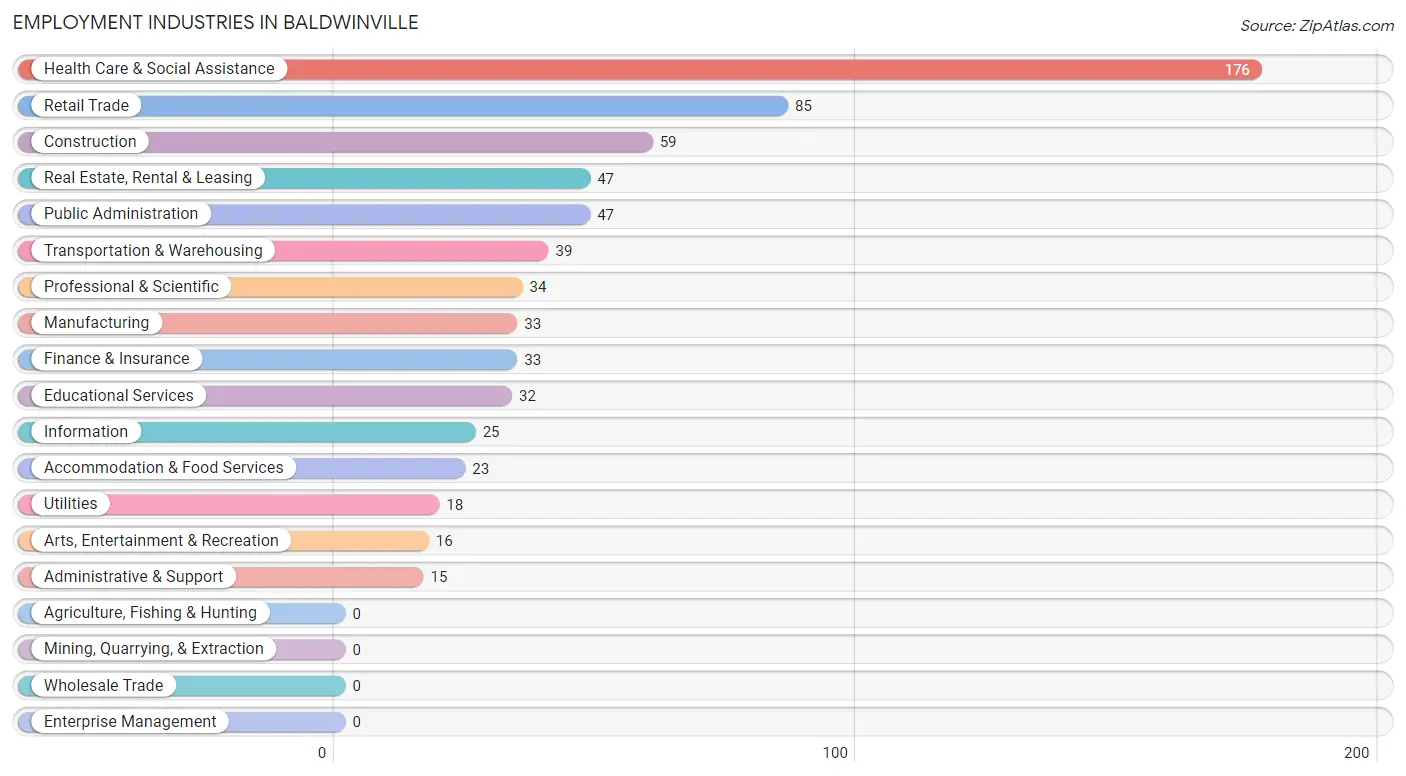
Employment Industries in Baldwinville
The major employment industries in Baldwinville include Health Care & Social Assistance (176 | 24.9%), Retail Trade (85 | 12.0%), Construction (59 | 8.4%), Real Estate, Rental & Leasing (47 | 6.7%), and Public Administration (47 | 6.7%).
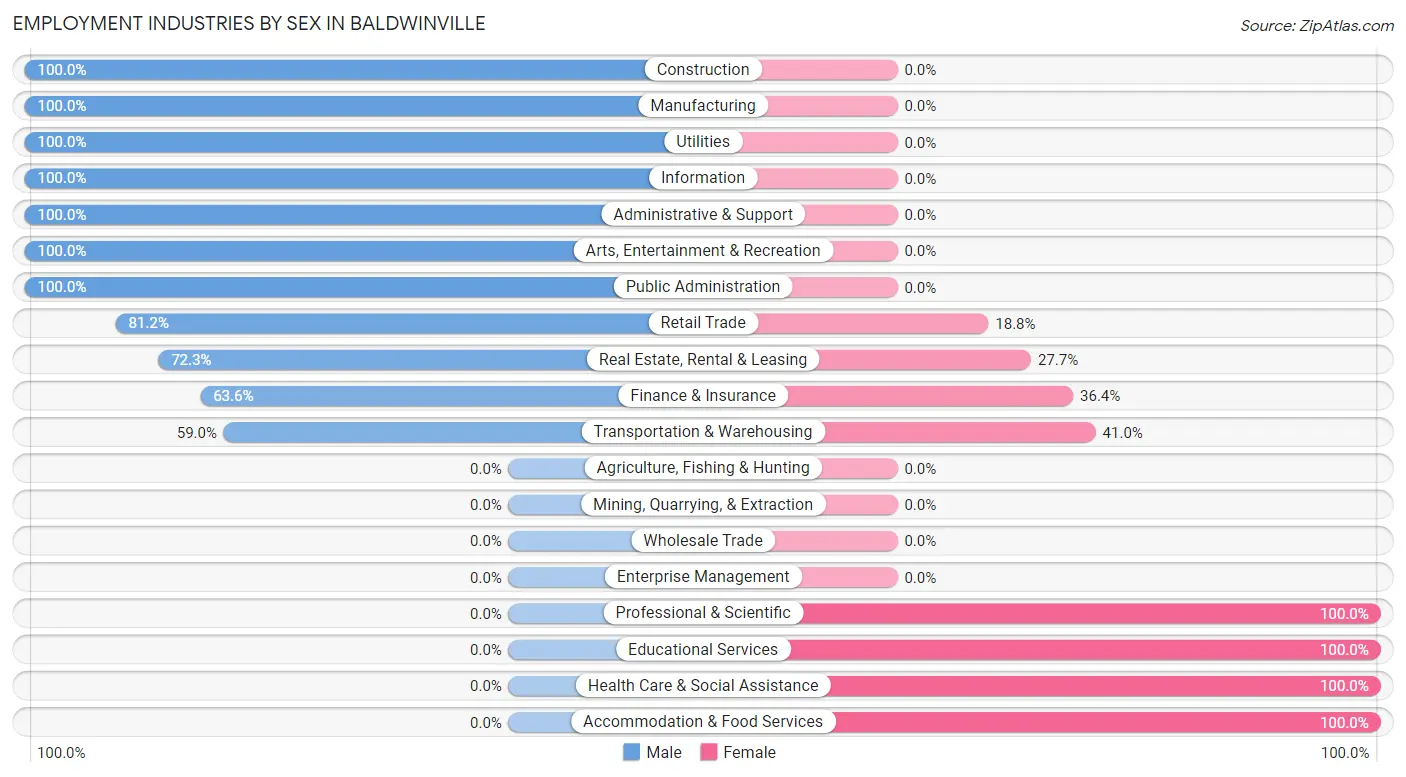
Employment Industries by Sex in Baldwinville
The Baldwinville industries that see more men than women are Construction (100.0%), Manufacturing (100.0%), and Utilities (100.0%), whereas the industries that tend to have a higher number of women are Professional & Scientific (100.0%), Educational Services (100.0%), and Health Care & Social Assistance (100.0%).
| Industry | Male | Female |
| Agriculture, Fishing & Hunting | 0 (0.0%) | 0 (0.0%) |
| Mining, Quarrying, & Extraction | 0 (0.0%) | 0 (0.0%) |
| Construction | 59 (100.0%) | 0 (0.0%) |
| Manufacturing | 33 (100.0%) | 0 (0.0%) |
| Wholesale Trade | 0 (0.0%) | 0 (0.0%) |
| Retail Trade | 69 (81.2%) | 16 (18.8%) |
| Transportation & Warehousing | 23 (59.0%) | 16 (41.0%) |
| Utilities | 18 (100.0%) | 0 (0.0%) |
| Information | 25 (100.0%) | 0 (0.0%) |
| Finance & Insurance | 21 (63.6%) | 12 (36.4%) |
| Real Estate, Rental & Leasing | 34 (72.3%) | 13 (27.7%) |
| Professional & Scientific | 0 (0.0%) | 34 (100.0%) |
| Enterprise Management | 0 (0.0%) | 0 (0.0%) |
| Administrative & Support | 15 (100.0%) | 0 (0.0%) |
| Educational Services | 0 (0.0%) | 32 (100.0%) |
| Health Care & Social Assistance | 0 (0.0%) | 176 (100.0%) |
| Arts, Entertainment & Recreation | 16 (100.0%) | 0 (0.0%) |
| Accommodation & Food Services | 0 (0.0%) | 23 (100.0%) |
| Public Administration | 47 (100.0%) | 0 (0.0%) |
| Total | 360 (50.9%) | 347 (49.1%) |
Education in Baldwinville
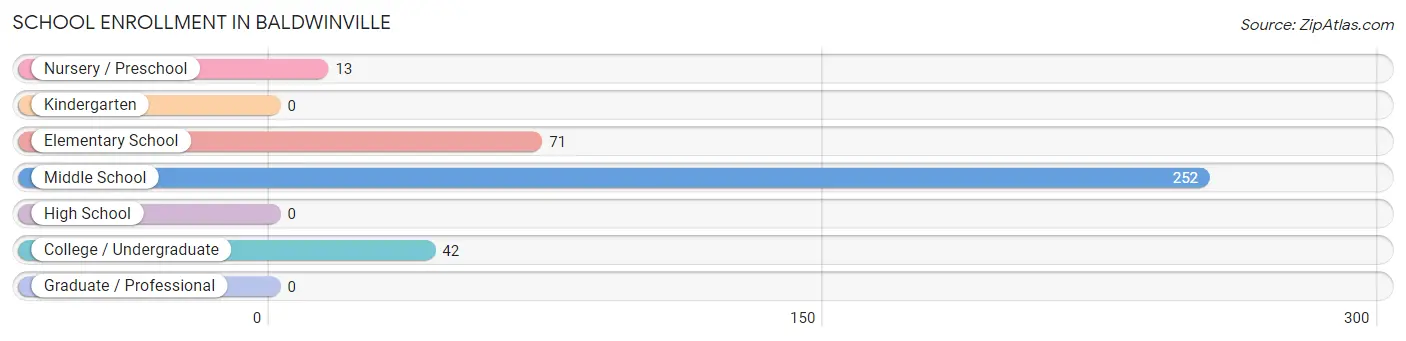
School Enrollment in Baldwinville
The most common levels of schooling among the 378 students in Baldwinville are middle school (252 | 66.7%), elementary school (71 | 18.8%), and college / undergraduate (42 | 11.1%).
| School Level | # Students | % Students |
| Nursery / Preschool | 13 | 3.4% |
| Kindergarten | 0 | 0.0% |
| Elementary School | 71 | 18.8% |
| Middle School | 252 | 66.7% |
| High School | 0 | 0.0% |
| College / Undergraduate | 42 | 11.1% |
| Graduate / Professional | 0 | 0.0% |
| Total | 378 | 100.0% |
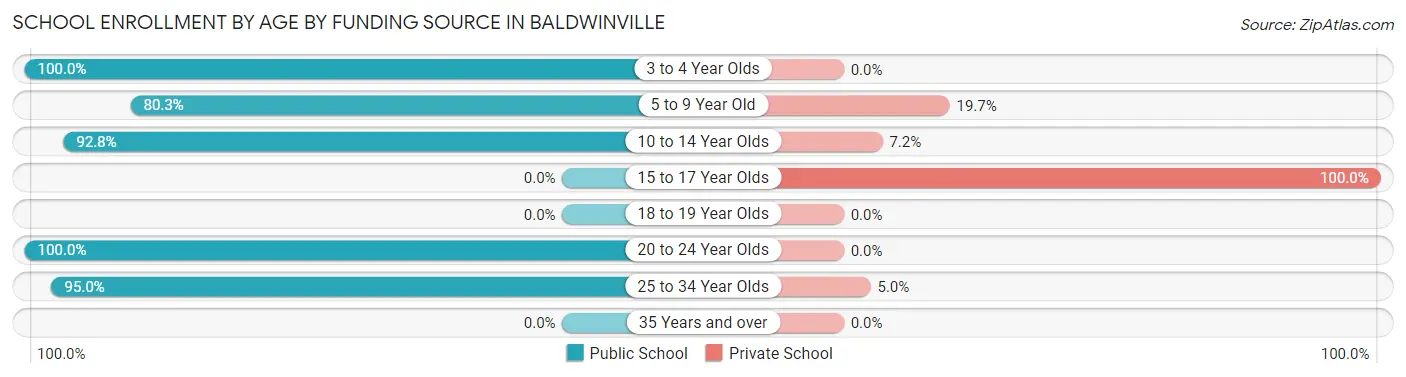
School Enrollment by Age by Funding Source in Baldwinville
Out of a total of 378 students who are enrolled in schools in Baldwinville, 49 (13.0%) attend a private institution, while the remaining 329 (87.0%) are enrolled in public schools. The age group of 15 to 17 year olds has the highest likelihood of being enrolled in private schools, with 17 (100.0% in the age bracket) enrolled. Conversely, the age group of 3 to 4 year olds has the lowest likelihood of being enrolled in a private school, with 13 (100.0% in the age bracket) attending a public institution.
| Age Bracket | Public School | Private School |
| 3 to 4 Year Olds | 13 (100.0%) | 0 (0.0%) |
| 5 to 9 Year Old | 57 (80.3%) | 14 (19.7%) |
| 10 to 14 Year Olds | 218 (92.8%) | 17 (7.2%) |
| 15 to 17 Year Olds | 0 (0.0%) | 17 (100.0%) |
| 18 to 19 Year Olds | 0 (0.0%) | 0 (0.0%) |
| 20 to 24 Year Olds | 22 (100.0%) | 0 (0.0%) |
| 25 to 34 Year Olds | 19 (95.0%) | 1 (5.0%) |
| 35 Years and over | 0 (0.0%) | 0 (0.0%) |
| Total | 329 (87.0%) | 49 (13.0%) |
Educational Attainment by Field of Study in Baldwinville
Literature & languages (136 | 31.4%), education (79 | 18.2%), arts & humanities (77 | 17.8%), visual & performing arts (43 | 9.9%), and science & technology (41 | 9.5%) are the most common fields of study among 433 individuals in Baldwinville who have obtained a bachelor's degree or higher.
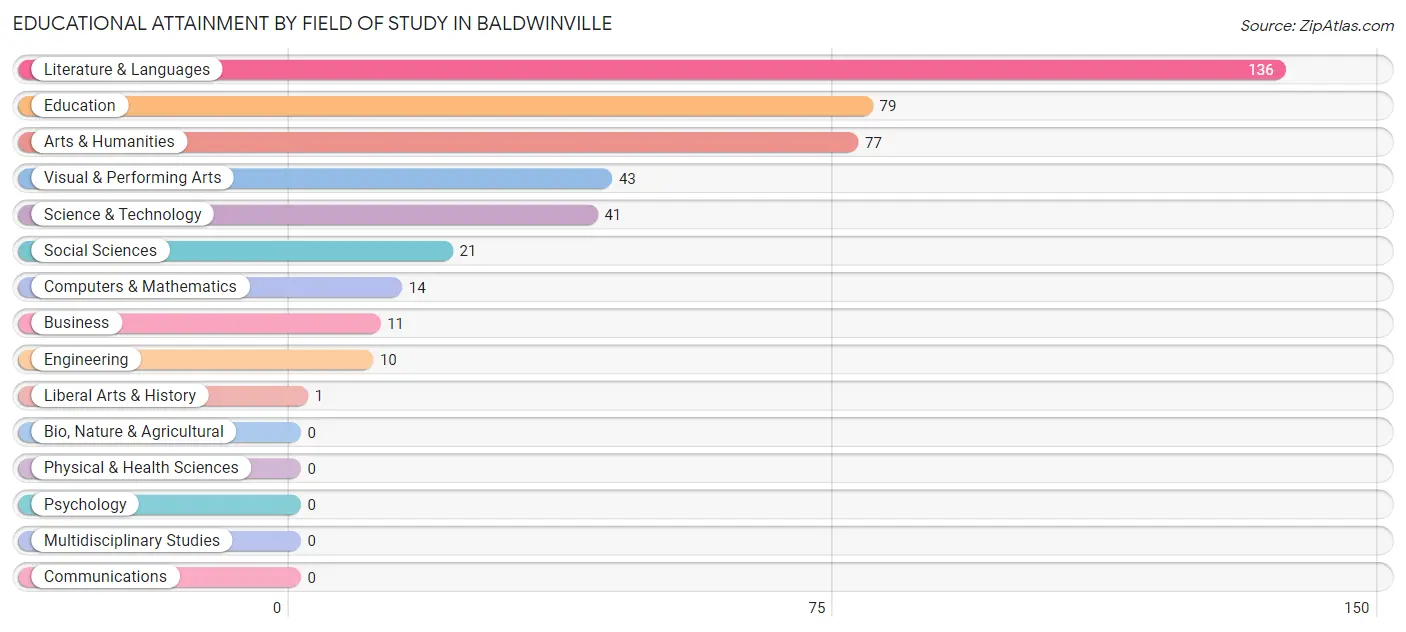
| Field of Study | # Graduates | % Graduates |
| Computers & Mathematics | 14 | 3.2% |
| Bio, Nature & Agricultural | 0 | 0.0% |
| Physical & Health Sciences | 0 | 0.0% |
| Psychology | 0 | 0.0% |
| Social Sciences | 21 | 4.9% |
| Engineering | 10 | 2.3% |
| Multidisciplinary Studies | 0 | 0.0% |
| Science & Technology | 41 | 9.5% |
| Business | 11 | 2.5% |
| Education | 79 | 18.2% |
| Literature & Languages | 136 | 31.4% |
| Liberal Arts & History | 1 | 0.2% |
| Visual & Performing Arts | 43 | 9.9% |
| Communications | 0 | 0.0% |
| Arts & Humanities | 77 | 17.8% |
| Total | 433 | 100.0% |
Transportation & Commute in Baldwinville
Vehicle Availability by Sex in Baldwinville
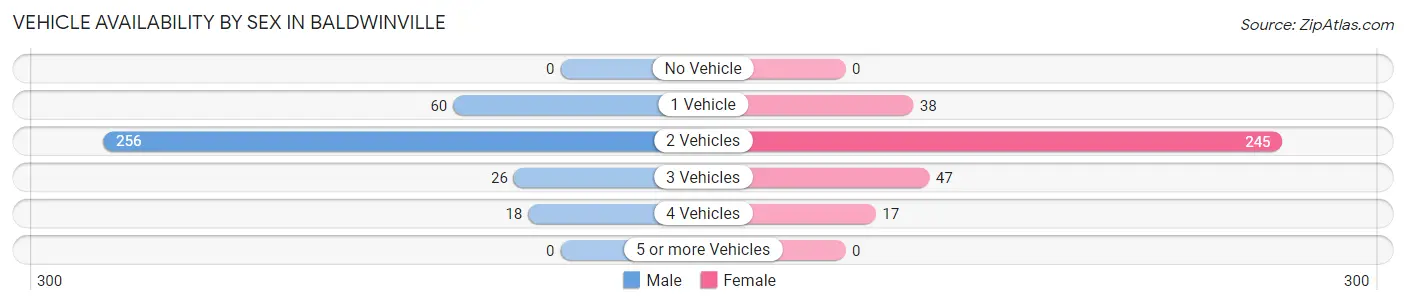
The most prevalent vehicle ownership categories in Baldwinville are males with 2 vehicles (256, accounting for 71.1%) and females with 2 vehicles (245, making up 73.8%).
| Vehicles Available | Male | Female |
| No Vehicle | 0 (0.0%) | 0 (0.0%) |
| 1 Vehicle | 60 (16.7%) | 38 (11.0%) |
| 2 Vehicles | 256 (71.1%) | 245 (70.6%) |
| 3 Vehicles | 26 (7.2%) | 47 (13.5%) |
| 4 Vehicles | 18 (5.0%) | 17 (4.9%) |
| 5 or more Vehicles | 0 (0.0%) | 0 (0.0%) |
| Total | 360 (100.0%) | 347 (100.0%) |
Commute Time in Baldwinville
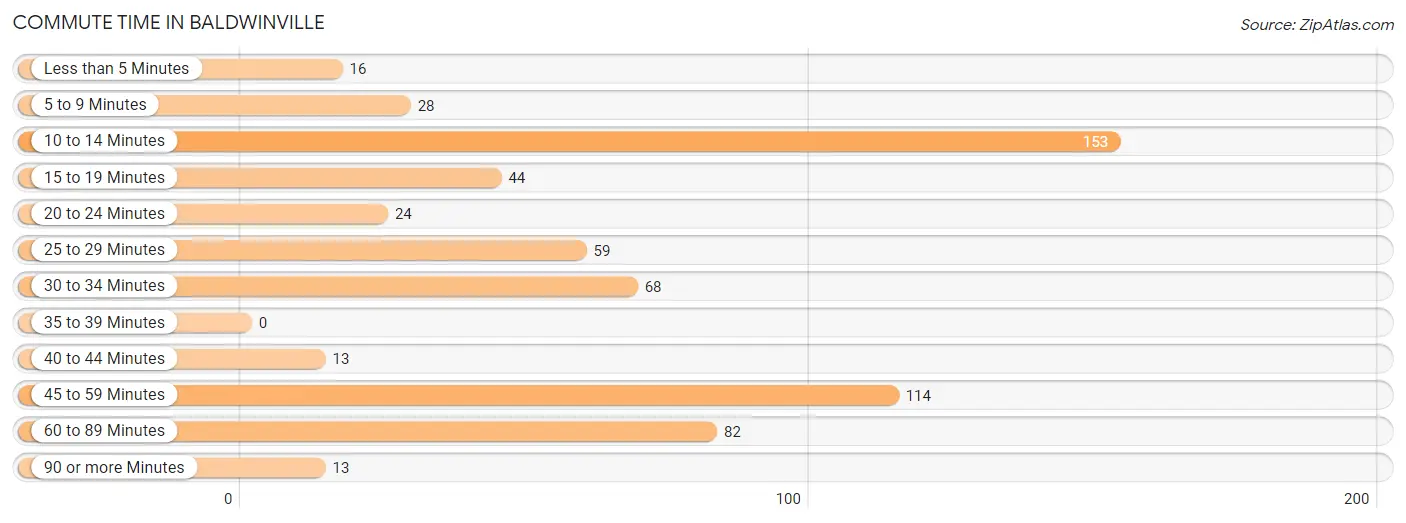
The most frequently occuring commute durations in Baldwinville are 10 to 14 minutes (153 commuters, 24.9%), 45 to 59 minutes (114 commuters, 18.6%), and 60 to 89 minutes (82 commuters, 13.4%).
| Commute Time | # Commuters | % Commuters |
| Less than 5 Minutes | 16 | 2.6% |
| 5 to 9 Minutes | 28 | 4.6% |
| 10 to 14 Minutes | 153 | 24.9% |
| 15 to 19 Minutes | 44 | 7.2% |
| 20 to 24 Minutes | 24 | 3.9% |
| 25 to 29 Minutes | 59 | 9.6% |
| 30 to 34 Minutes | 68 | 11.1% |
| 35 to 39 Minutes | 0 | 0.0% |
| 40 to 44 Minutes | 13 | 2.1% |
| 45 to 59 Minutes | 114 | 18.6% |
| 60 to 89 Minutes | 82 | 13.4% |
| 90 or more Minutes | 13 | 2.1% |
Commute Time by Sex in Baldwinville
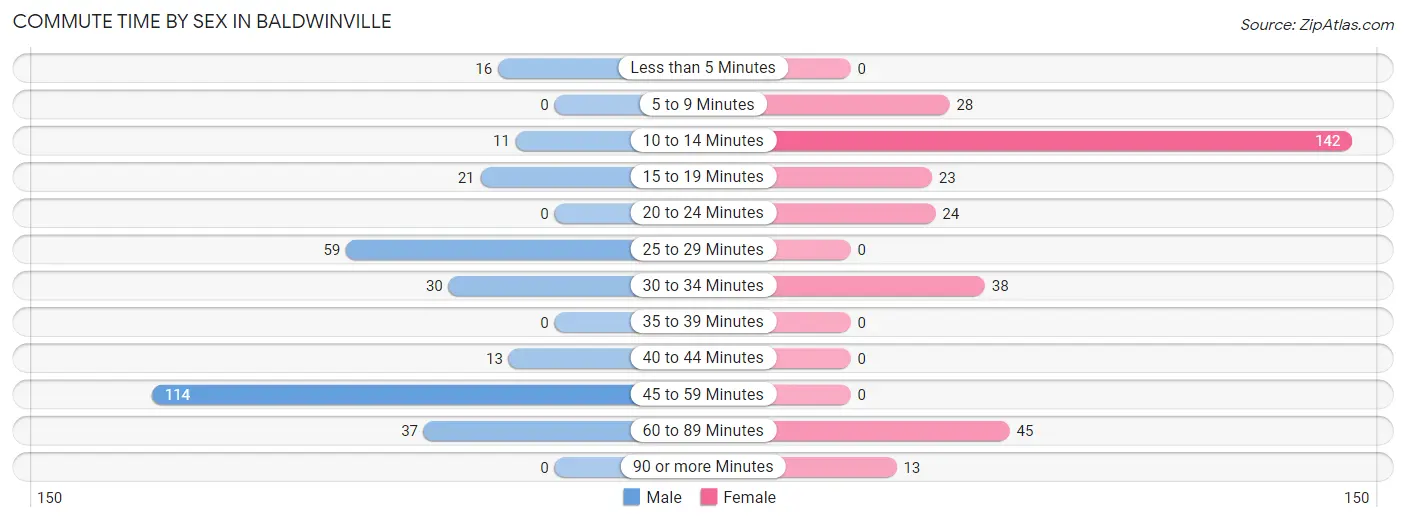
The most common commute times in Baldwinville are 45 to 59 minutes (114 commuters, 37.9%) for males and 10 to 14 minutes (142 commuters, 45.4%) for females.
| Commute Time | Male | Female |
| Less than 5 Minutes | 16 (5.3%) | 0 (0.0%) |
| 5 to 9 Minutes | 0 (0.0%) | 28 (8.9%) |
| 10 to 14 Minutes | 11 (3.6%) | 142 (45.4%) |
| 15 to 19 Minutes | 21 (7.0%) | 23 (7.3%) |
| 20 to 24 Minutes | 0 (0.0%) | 24 (7.7%) |
| 25 to 29 Minutes | 59 (19.6%) | 0 (0.0%) |
| 30 to 34 Minutes | 30 (10.0%) | 38 (12.1%) |
| 35 to 39 Minutes | 0 (0.0%) | 0 (0.0%) |
| 40 to 44 Minutes | 13 (4.3%) | 0 (0.0%) |
| 45 to 59 Minutes | 114 (37.9%) | 0 (0.0%) |
| 60 to 89 Minutes | 37 (12.3%) | 45 (14.4%) |
| 90 or more Minutes | 0 (0.0%) | 13 (4.2%) |
Time of Departure to Work by Sex in Baldwinville
The most frequent times of departure to work in Baldwinville are 6:00 AM to 6:29 AM (138, 45.9%) for males and 7:00 AM to 7:29 AM (103, 32.9%) for females.
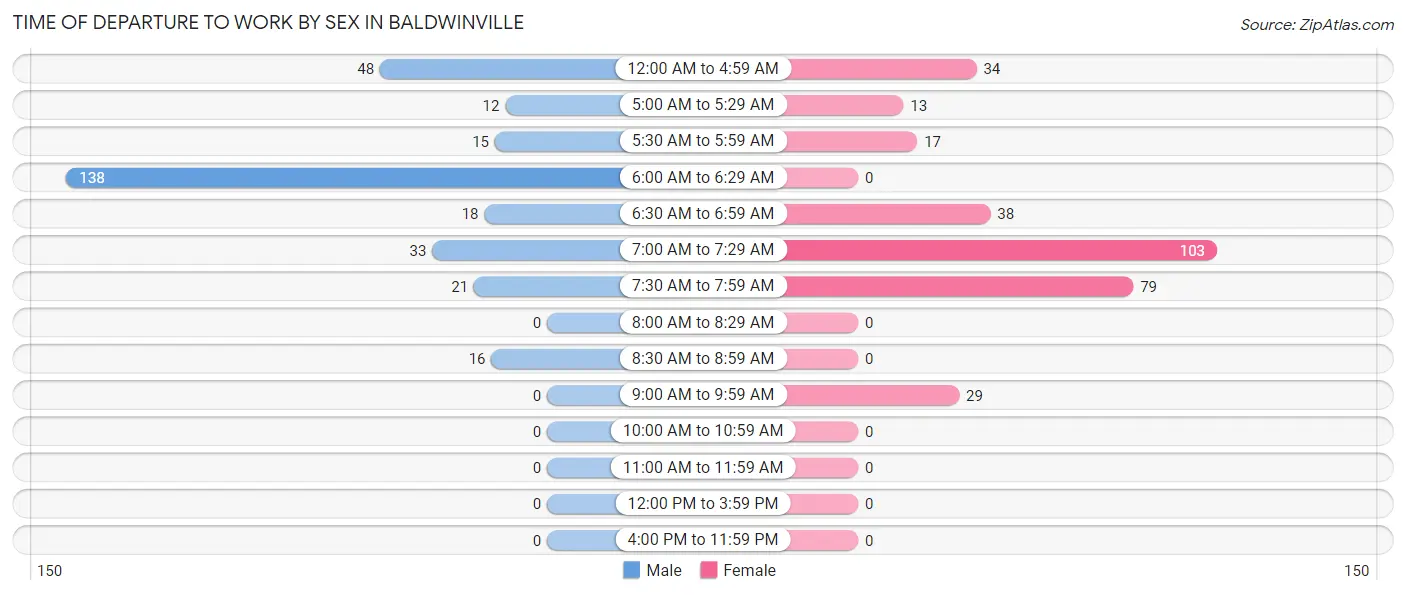
| Time of Departure | Male | Female |
| 12:00 AM to 4:59 AM | 48 (16.0%) | 34 (10.9%) |
| 5:00 AM to 5:29 AM | 12 (4.0%) | 13 (4.2%) |
| 5:30 AM to 5:59 AM | 15 (5.0%) | 17 (5.4%) |
| 6:00 AM to 6:29 AM | 138 (45.9%) | 0 (0.0%) |
| 6:30 AM to 6:59 AM | 18 (6.0%) | 38 (12.1%) |
| 7:00 AM to 7:29 AM | 33 (11.0%) | 103 (32.9%) |
| 7:30 AM to 7:59 AM | 21 (7.0%) | 79 (25.2%) |
| 8:00 AM to 8:29 AM | 0 (0.0%) | 0 (0.0%) |
| 8:30 AM to 8:59 AM | 16 (5.3%) | 0 (0.0%) |
| 9:00 AM to 9:59 AM | 0 (0.0%) | 29 (9.3%) |
| 10:00 AM to 10:59 AM | 0 (0.0%) | 0 (0.0%) |
| 11:00 AM to 11:59 AM | 0 (0.0%) | 0 (0.0%) |
| 12:00 PM to 3:59 PM | 0 (0.0%) | 0 (0.0%) |
| 4:00 PM to 11:59 PM | 0 (0.0%) | 0 (0.0%) |
| Total | 301 (100.0%) | 313 (100.0%) |
Housing Occupancy in Baldwinville
Occupancy by Ownership in Baldwinville
Of the total 801 dwellings in Baldwinville, owner-occupied units account for 699 (87.3%), while renter-occupied units make up 102 (12.7%).
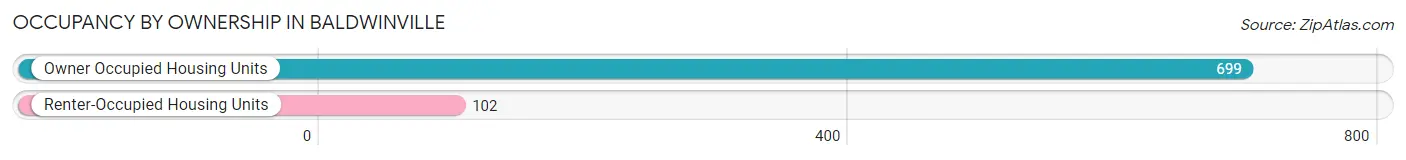
| Occupancy | # Housing Units | % Housing Units |
| Owner Occupied Housing Units | 699 | 87.3% |
| Renter-Occupied Housing Units | 102 | 12.7% |
| Total Occupied Housing Units | 801 | 100.0% |
Occupancy by Household Size in Baldwinville
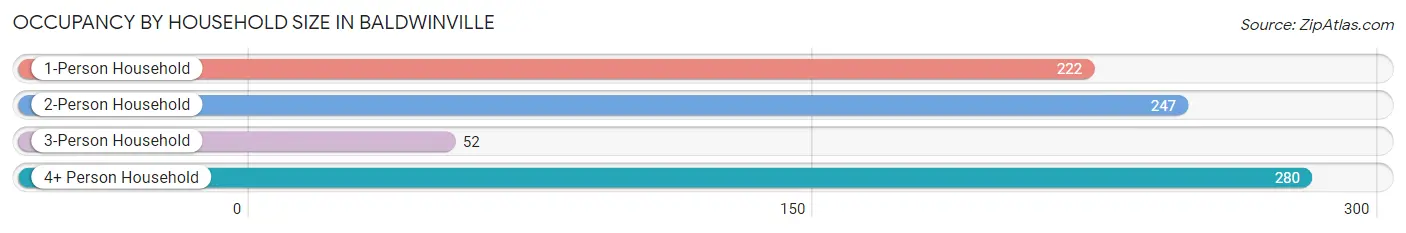
| Household Size | # Housing Units | % Housing Units |
| 1-Person Household | 222 | 27.7% |
| 2-Person Household | 247 | 30.8% |
| 3-Person Household | 52 | 6.5% |
| 4+ Person Household | 280 | 35.0% |
| Total Housing Units | 801 | 100.0% |
Occupancy by Ownership by Household Size in Baldwinville
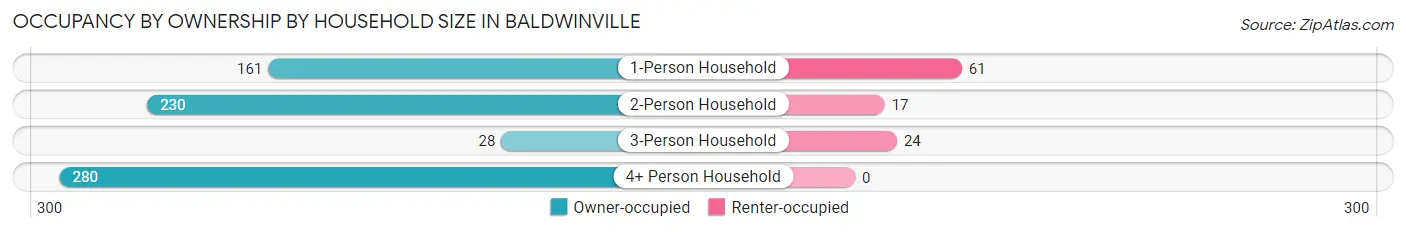
| Household Size | Owner-occupied | Renter-occupied |
| 1-Person Household | 161 (72.5%) | 61 (27.5%) |
| 2-Person Household | 230 (93.1%) | 17 (6.9%) |
| 3-Person Household | 28 (53.8%) | 24 (46.2%) |
| 4+ Person Household | 280 (100.0%) | 0 (0.0%) |
| Total Housing Units | 699 (87.3%) | 102 (12.7%) |
Occupancy by Educational Attainment in Baldwinville
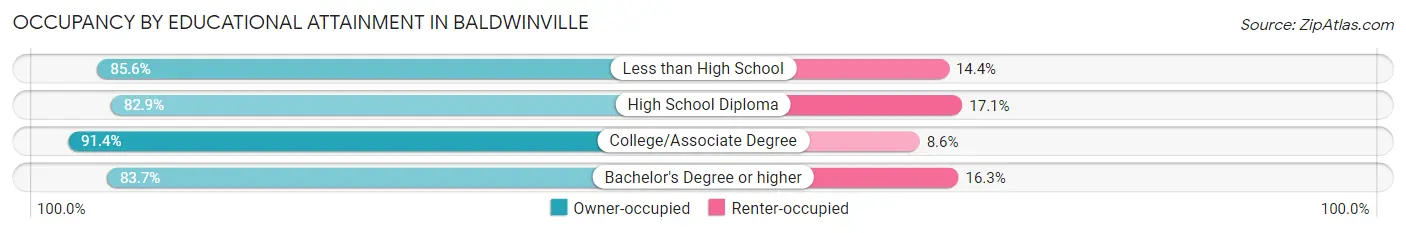
| Household Size | Owner-occupied | Renter-occupied |
| Less than High School | 172 (85.6%) | 29 (14.4%) |
| High School Diploma | 97 (82.9%) | 20 (17.1%) |
| College/Associate Degree | 307 (91.4%) | 29 (8.6%) |
| Bachelor's Degree or higher | 123 (83.7%) | 24 (16.3%) |
Occupancy by Age of Householder in Baldwinville
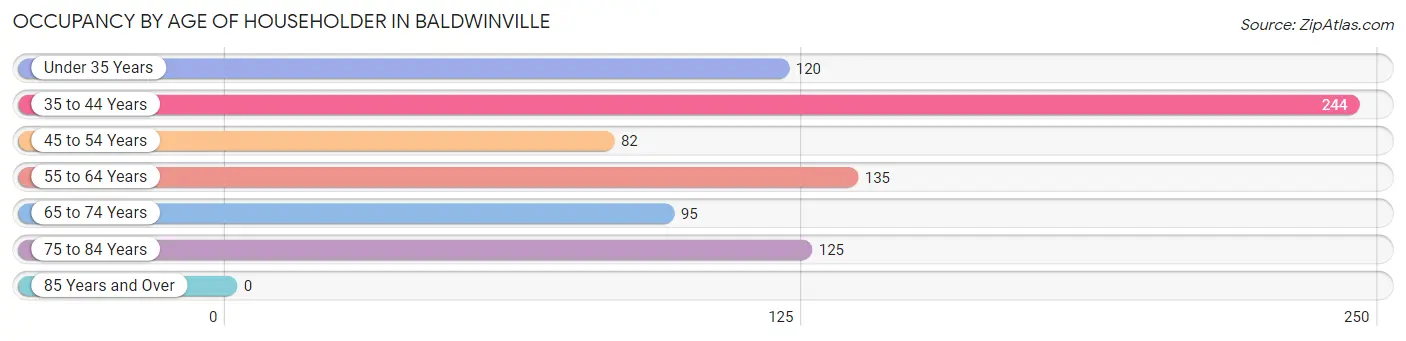
| Age Bracket | # Households | % Households |
| Under 35 Years | 120 | 15.0% |
| 35 to 44 Years | 244 | 30.5% |
| 45 to 54 Years | 82 | 10.2% |
| 55 to 64 Years | 135 | 16.9% |
| 65 to 74 Years | 95 | 11.9% |
| 75 to 84 Years | 125 | 15.6% |
| 85 Years and Over | 0 | 0.0% |
| Total | 801 | 100.0% |
Housing Finances in Baldwinville
Median Income by Occupancy in Baldwinville
| Occupancy Type | # Households | Median Income |
| Owner-Occupied | 699 (87.3%) | $0 |
| Renter-Occupied | 102 (12.7%) | $0 |
| Average | 801 (100.0%) | $0 |
Occupancy by Householder Income Bracket in Baldwinville
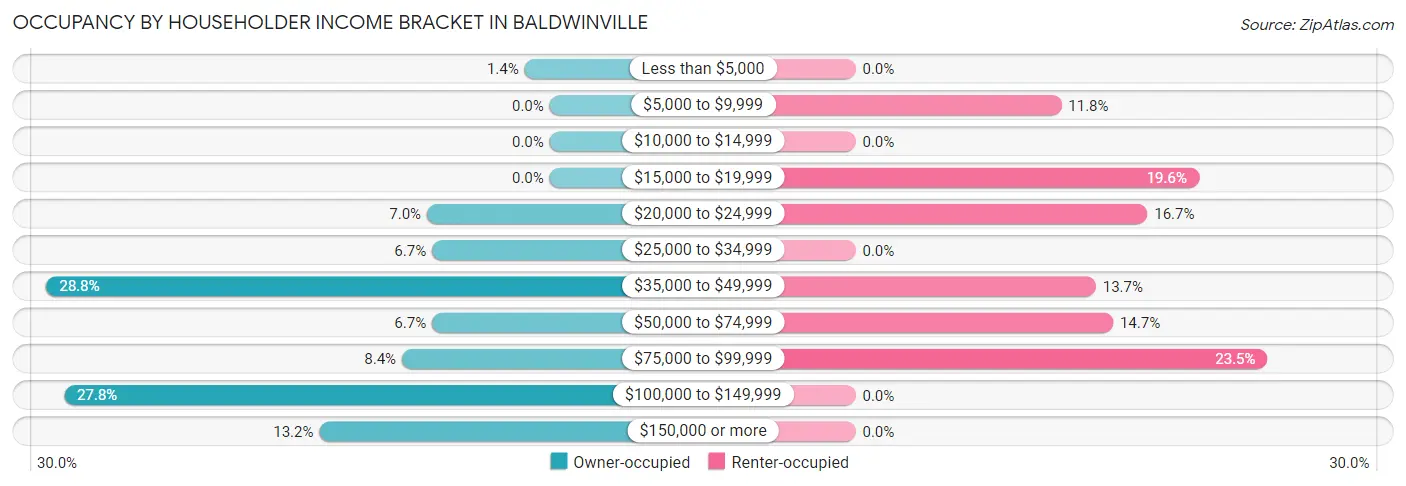
| Income Bracket | Owner-occupied | Renter-occupied |
| Less than $5,000 | 10 (1.4%) | 0 (0.0%) |
| $5,000 to $9,999 | 0 (0.0%) | 12 (11.8%) |
| $10,000 to $14,999 | 0 (0.0%) | 0 (0.0%) |
| $15,000 to $19,999 | 0 (0.0%) | 20 (19.6%) |
| $20,000 to $24,999 | 49 (7.0%) | 17 (16.7%) |
| $25,000 to $34,999 | 47 (6.7%) | 0 (0.0%) |
| $35,000 to $49,999 | 201 (28.8%) | 14 (13.7%) |
| $50,000 to $74,999 | 47 (6.7%) | 15 (14.7%) |
| $75,000 to $99,999 | 59 (8.4%) | 24 (23.5%) |
| $100,000 to $149,999 | 194 (27.8%) | 0 (0.0%) |
| $150,000 or more | 92 (13.2%) | 0 (0.0%) |
| Total | 699 (100.0%) | 102 (100.0%) |
Monthly Housing Cost Tiers in Baldwinville
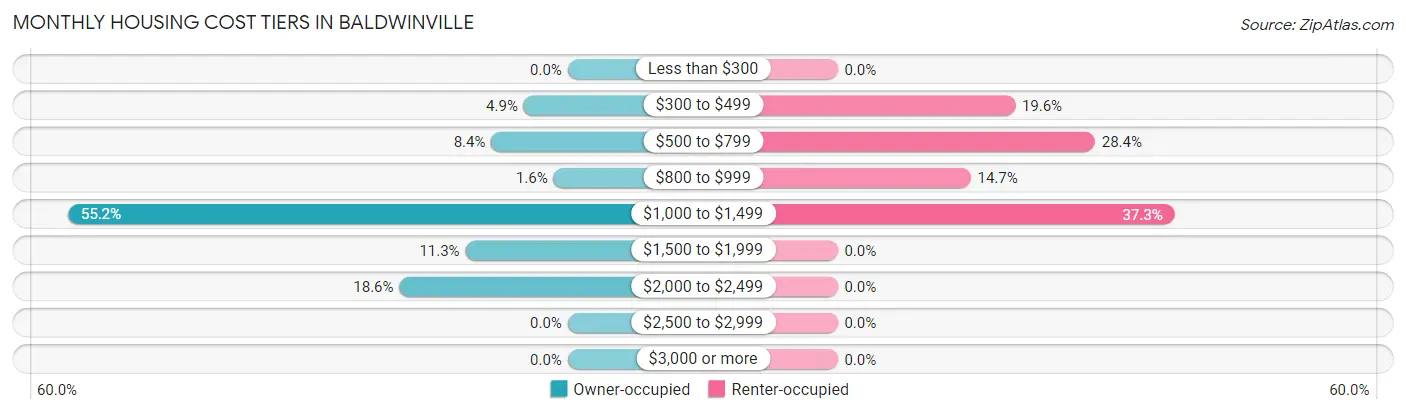
| Monthly Cost | Owner-occupied | Renter-occupied |
| Less than $300 | 0 (0.0%) | 0 (0.0%) |
| $300 to $499 | 34 (4.9%) | 20 (19.6%) |
| $500 to $799 | 59 (8.4%) | 29 (28.4%) |
| $800 to $999 | 11 (1.6%) | 15 (14.7%) |
| $1,000 to $1,499 | 386 (55.2%) | 38 (37.2%) |
| $1,500 to $1,999 | 79 (11.3%) | 0 (0.0%) |
| $2,000 to $2,499 | 130 (18.6%) | 0 (0.0%) |
| $2,500 to $2,999 | 0 (0.0%) | 0 (0.0%) |
| $3,000 or more | 0 (0.0%) | 0 (0.0%) |
| Total | 699 (100.0%) | 102 (100.0%) |
Physical Housing Characteristics in Baldwinville
Housing Structures in Baldwinville
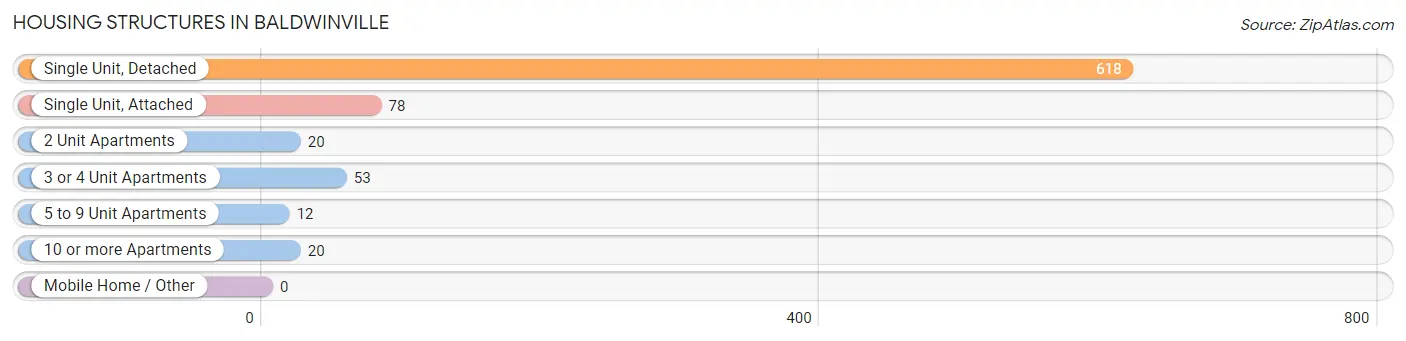
| Structure Type | # Housing Units | % Housing Units |
| Single Unit, Detached | 618 | 77.1% |
| Single Unit, Attached | 78 | 9.7% |
| 2 Unit Apartments | 20 | 2.5% |
| 3 or 4 Unit Apartments | 53 | 6.6% |
| 5 to 9 Unit Apartments | 12 | 1.5% |
| 10 or more Apartments | 20 | 2.5% |
| Mobile Home / Other | 0 | 0.0% |
| Total | 801 | 100.0% |
Housing Structures by Occupancy in Baldwinville
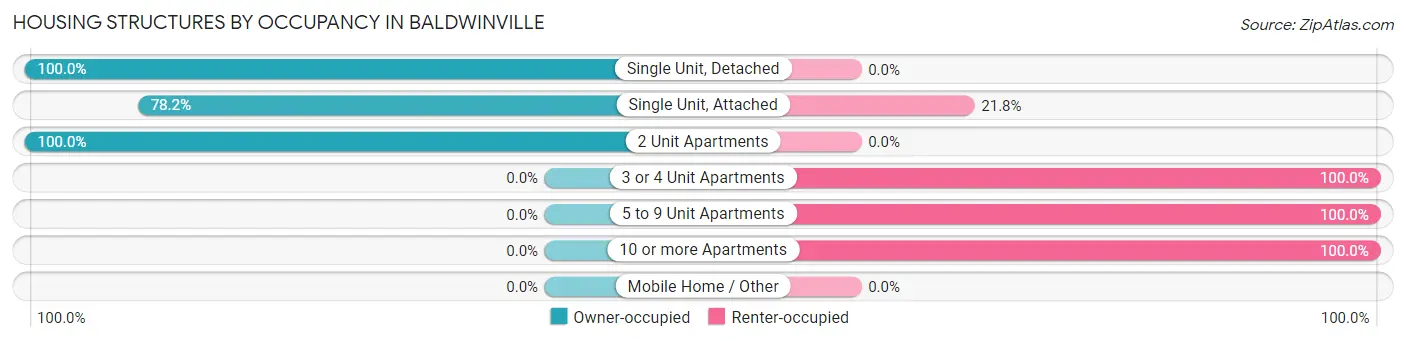
| Structure Type | Owner-occupied | Renter-occupied |
| Single Unit, Detached | 618 (100.0%) | 0 (0.0%) |
| Single Unit, Attached | 61 (78.2%) | 17 (21.8%) |
| 2 Unit Apartments | 20 (100.0%) | 0 (0.0%) |
| 3 or 4 Unit Apartments | 0 (0.0%) | 53 (100.0%) |
| 5 to 9 Unit Apartments | 0 (0.0%) | 12 (100.0%) |
| 10 or more Apartments | 0 (0.0%) | 20 (100.0%) |
| Mobile Home / Other | 0 (0.0%) | 0 (0.0%) |
| Total | 699 (87.3%) | 102 (12.7%) |
Housing Structures by Number of Rooms in Baldwinville
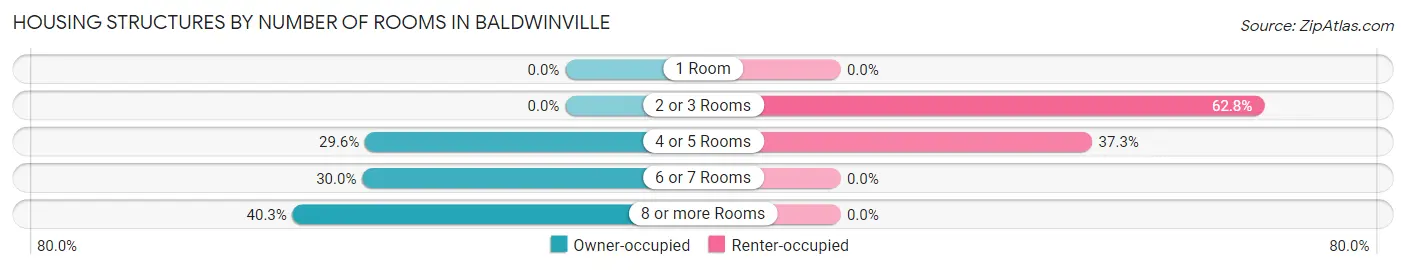
| Number of Rooms | Owner-occupied | Renter-occupied |
| 1 Room | 0 (0.0%) | 0 (0.0%) |
| 2 or 3 Rooms | 0 (0.0%) | 64 (62.7%) |
| 4 or 5 Rooms | 207 (29.6%) | 38 (37.2%) |
| 6 or 7 Rooms | 210 (30.0%) | 0 (0.0%) |
| 8 or more Rooms | 282 (40.3%) | 0 (0.0%) |
| Total | 699 (100.0%) | 102 (100.0%) |
Housing Structure by Heating Type in Baldwinville
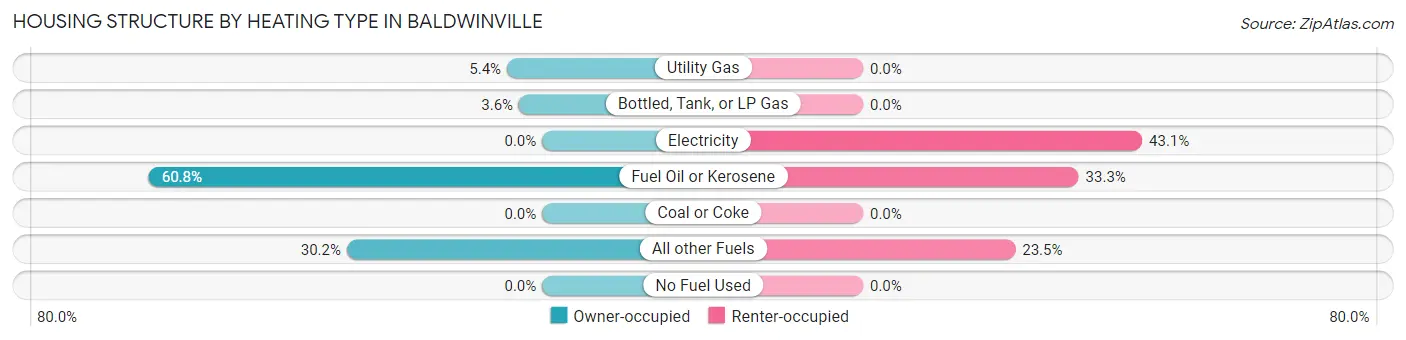
| Heating Type | Owner-occupied | Renter-occupied |
| Utility Gas | 38 (5.4%) | 0 (0.0%) |
| Bottled, Tank, or LP Gas | 25 (3.6%) | 0 (0.0%) |
| Electricity | 0 (0.0%) | 44 (43.1%) |
| Fuel Oil or Kerosene | 425 (60.8%) | 34 (33.3%) |
| Coal or Coke | 0 (0.0%) | 0 (0.0%) |
| All other Fuels | 211 (30.2%) | 24 (23.5%) |
| No Fuel Used | 0 (0.0%) | 0 (0.0%) |
| Total | 699 (100.0%) | 102 (100.0%) |
Household Vehicle Usage in Baldwinville
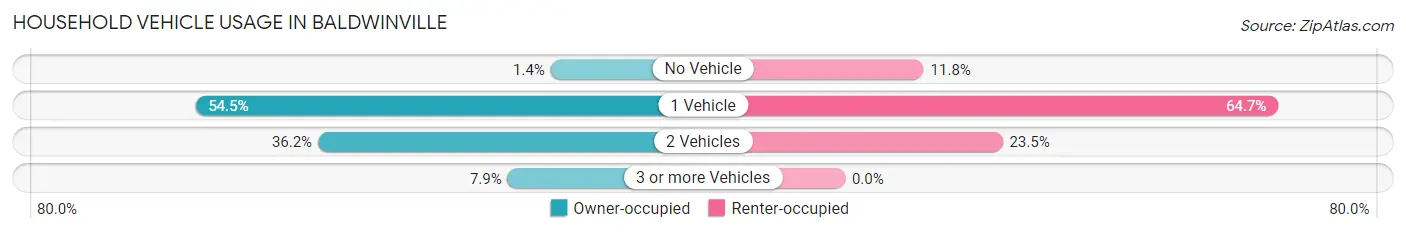
| Vehicles per Household | Owner-occupied | Renter-occupied |
| No Vehicle | 10 (1.4%) | 12 (11.8%) |
| 1 Vehicle | 381 (54.5%) | 66 (64.7%) |
| 2 Vehicles | 253 (36.2%) | 24 (23.5%) |
| 3 or more Vehicles | 55 (7.9%) | 0 (0.0%) |
| Total | 699 (100.0%) | 102 (100.0%) |
Real Estate & Mortgages in Baldwinville
Real Estate and Mortgage Overview in Baldwinville
| Characteristic | Without Mortgage | With Mortgage |
| Housing Units | 142 | 557 |
| Median Property Value | $262,500 | $270,400 |
| Median Household Income | $92,917 | $77 |
| Monthly Housing Costs | $748 | $0 |
| Real Estate Taxes | $3,667 | $0 |
Property Value by Mortgage Status in Baldwinville
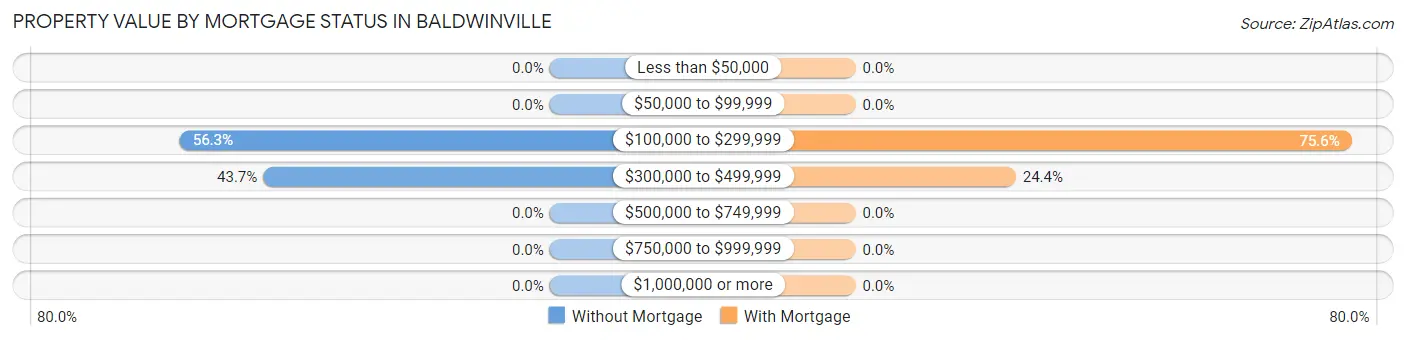
| Property Value | Without Mortgage | With Mortgage |
| Less than $50,000 | 0 (0.0%) | 0 (0.0%) |
| $50,000 to $99,999 | 0 (0.0%) | 0 (0.0%) |
| $100,000 to $299,999 | 80 (56.3%) | 421 (75.6%) |
| $300,000 to $499,999 | 62 (43.7%) | 136 (24.4%) |
| $500,000 to $749,999 | 0 (0.0%) | 0 (0.0%) |
| $750,000 to $999,999 | 0 (0.0%) | 0 (0.0%) |
| $1,000,000 or more | 0 (0.0%) | 0 (0.0%) |
| Total | 142 (100.0%) | 557 (100.0%) |
Household Income by Mortgage Status in Baldwinville
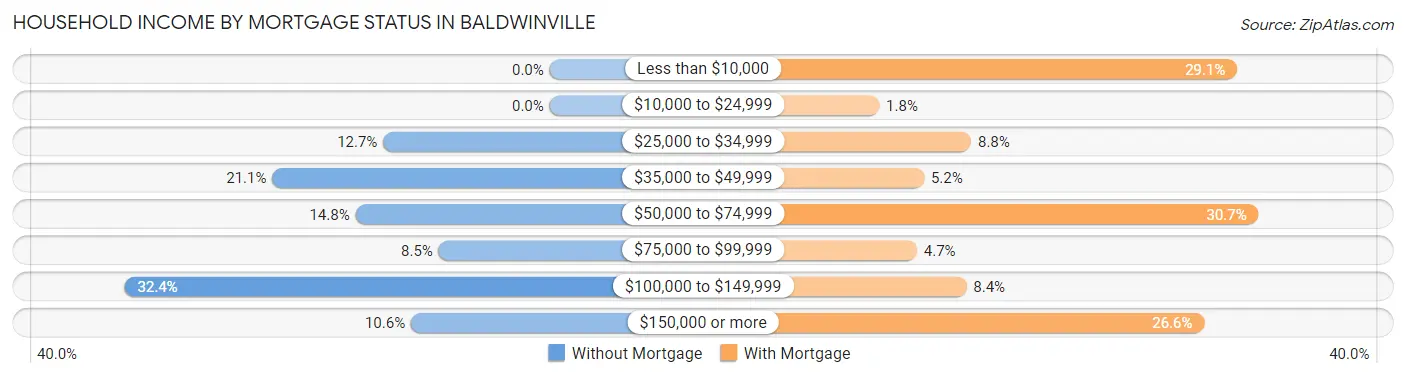
| Household Income | Without Mortgage | With Mortgage |
| Less than $10,000 | 0 (0.0%) | 162 (29.1%) |
| $10,000 to $24,999 | 0 (0.0%) | 10 (1.8%) |
| $25,000 to $34,999 | 18 (12.7%) | 49 (8.8%) |
| $35,000 to $49,999 | 30 (21.1%) | 29 (5.2%) |
| $50,000 to $74,999 | 21 (14.8%) | 171 (30.7%) |
| $75,000 to $99,999 | 12 (8.5%) | 26 (4.7%) |
| $100,000 to $149,999 | 46 (32.4%) | 47 (8.4%) |
| $150,000 or more | 15 (10.6%) | 148 (26.6%) |
| Total | 142 (100.0%) | 557 (100.0%) |
Property Value to Household Income Ratio in Baldwinville
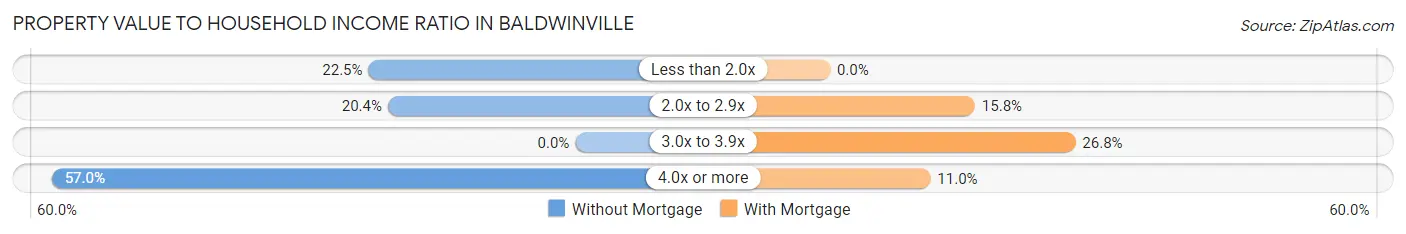
| Value-to-Income Ratio | Without Mortgage | With Mortgage |
| Less than 2.0x | 32 (22.5%) | 0 (0.0%) |
| 2.0x to 2.9x | 29 (20.4%) | 88 (15.8%) |
| 3.0x to 3.9x | 0 (0.0%) | 149 (26.8%) |
| 4.0x or more | 81 (57.0%) | 61 (11.0%) |
| Total | 142 (100.0%) | 557 (100.0%) |
Real Estate Taxes by Mortgage Status in Baldwinville
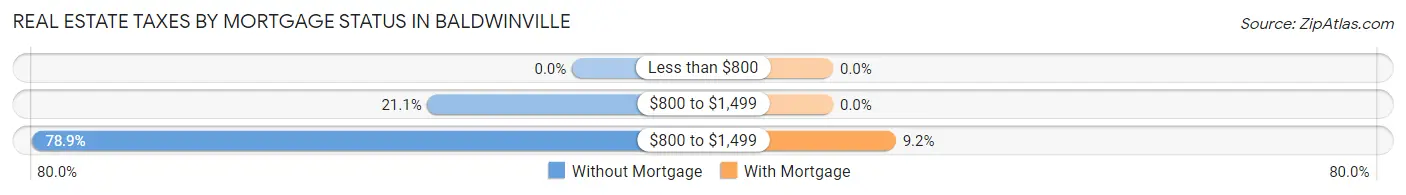
| Property Taxes | Without Mortgage | With Mortgage |
| Less than $800 | 0 (0.0%) | 0 (0.0%) |
| $800 to $1,499 | 30 (21.1%) | 0 (0.0%) |
| $800 to $1,499 | 112 (78.9%) | 51 (9.2%) |
| Total | 142 (100.0%) | 557 (100.0%) |
Health & Disability in Baldwinville
Health Insurance Coverage by Age in Baldwinville
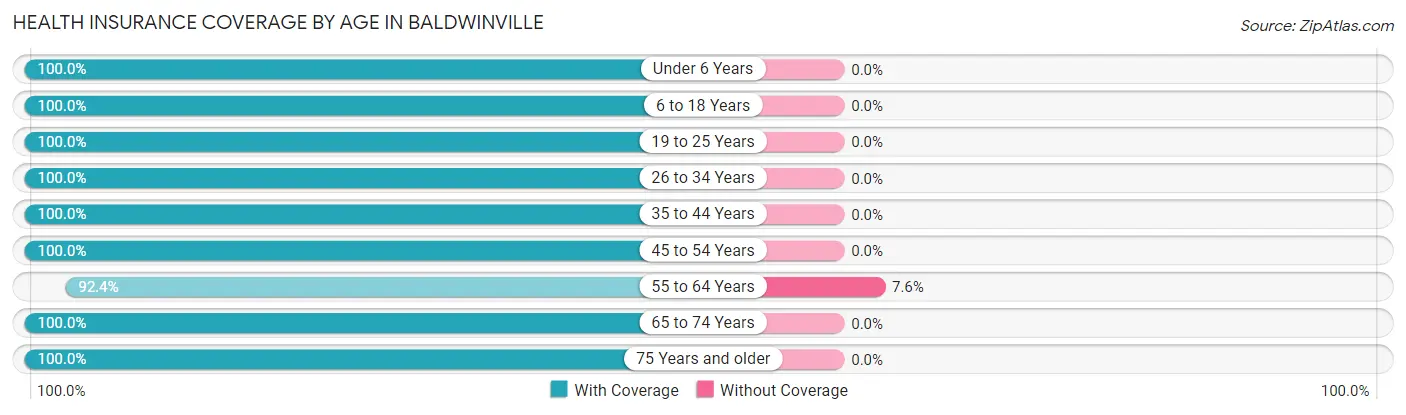
| Age Bracket | With Coverage | Without Coverage |
| Under 6 Years | 420 (100.0%) | 0 (0.0%) |
| 6 to 18 Years | 323 (100.0%) | 0 (0.0%) |
| 19 to 25 Years | 117 (100.0%) | 0 (0.0%) |
| 26 to 34 Years | 326 (100.0%) | 0 (0.0%) |
| 35 to 44 Years | 348 (100.0%) | 0 (0.0%) |
| 45 to 54 Years | 108 (100.0%) | 0 (0.0%) |
| 55 to 64 Years | 243 (92.4%) | 20 (7.6%) |
| 65 to 74 Years | 124 (100.0%) | 0 (0.0%) |
| 75 Years and older | 172 (100.0%) | 0 (0.0%) |
| Total | 2,181 (99.1%) | 20 (0.9%) |
Health Insurance Coverage by Citizenship Status in Baldwinville

| Citizenship Status | With Coverage | Without Coverage |
| Native Born | 420 (100.0%) | 0 (0.0%) |
| Foreign Born, Citizen | 323 (100.0%) | 0 (0.0%) |
| Foreign Born, not a Citizen | 117 (100.0%) | 0 (0.0%) |
Health Insurance Coverage by Household Income in Baldwinville
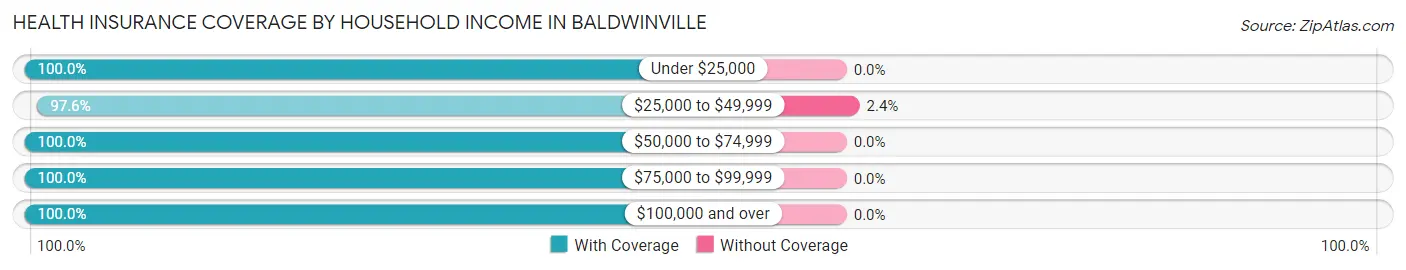
| Household Income | With Coverage | Without Coverage |
| Under $25,000 | 126 (100.0%) | 0 (0.0%) |
| $25,000 to $49,999 | 813 (97.6%) | 20 (2.4%) |
| $50,000 to $74,999 | 99 (100.0%) | 0 (0.0%) |
| $75,000 to $99,999 | 178 (100.0%) | 0 (0.0%) |
| $100,000 and over | 963 (100.0%) | 0 (0.0%) |
Public vs Private Health Insurance Coverage by Age in Baldwinville
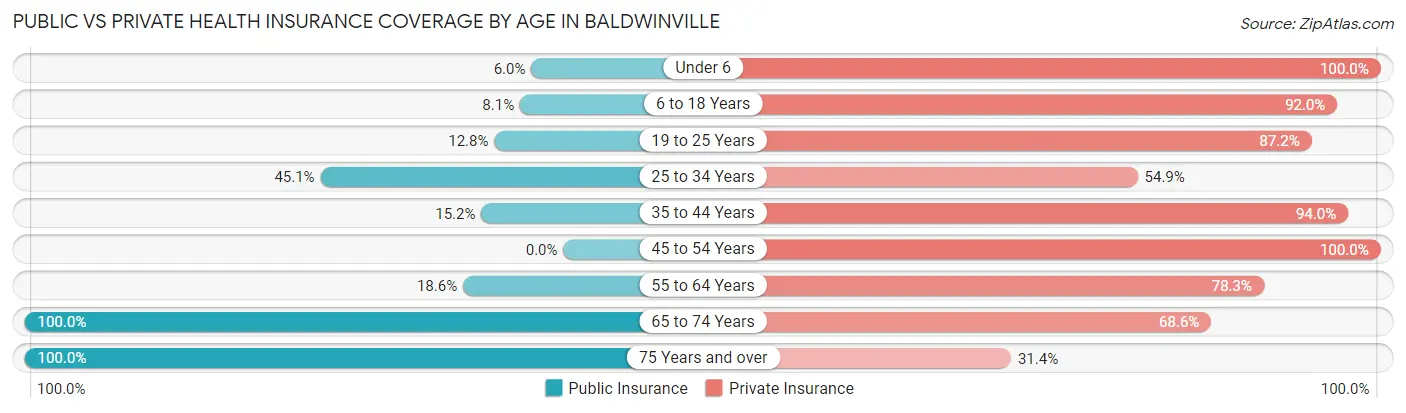
| Age Bracket | Public Insurance | Private Insurance |
| Under 6 | 25 (5.9%) | 420 (100.0%) |
| 6 to 18 Years | 26 (8.1%) | 297 (91.9%) |
| 19 to 25 Years | 15 (12.8%) | 102 (87.2%) |
| 25 to 34 Years | 147 (45.1%) | 179 (54.9%) |
| 35 to 44 Years | 53 (15.2%) | 327 (94.0%) |
| 45 to 54 Years | 0 (0.0%) | 108 (100.0%) |
| 55 to 64 Years | 49 (18.6%) | 206 (78.3%) |
| 65 to 74 Years | 124 (100.0%) | 85 (68.5%) |
| 75 Years and over | 172 (100.0%) | 54 (31.4%) |
| Total | 611 (27.8%) | 1,778 (80.8%) |
Disability Status by Sex by Age in Baldwinville
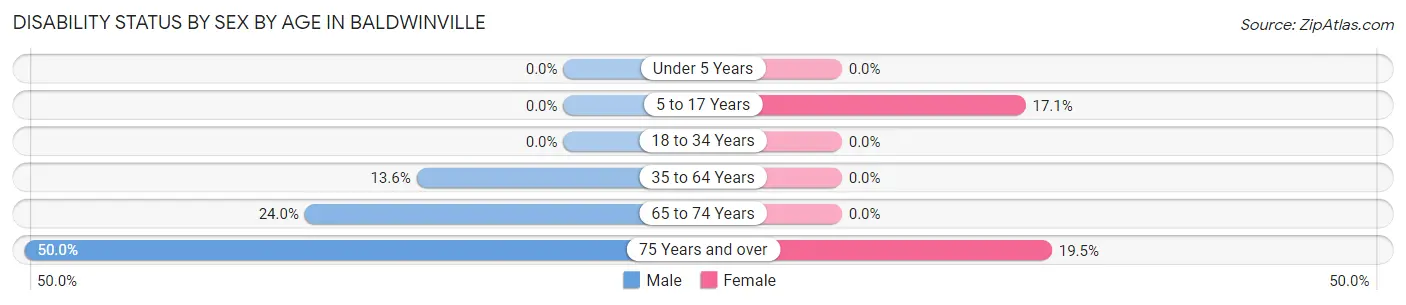
| Age Bracket | Male | Female |
| Under 5 Years | 0 (0.0%) | 0 (0.0%) |
| 5 to 17 Years | 0 (0.0%) | 15 (17.1%) |
| 18 to 34 Years | 0 (0.0%) | 0 (0.0%) |
| 35 to 64 Years | 65 (13.6%) | 0 (0.0%) |
| 65 to 74 Years | 18 (24.0%) | 0 (0.0%) |
| 75 Years and over | 27 (50.0%) | 23 (19.5%) |
Disability Class by Sex by Age in Baldwinville
Disability Class: Hearing Difficulty
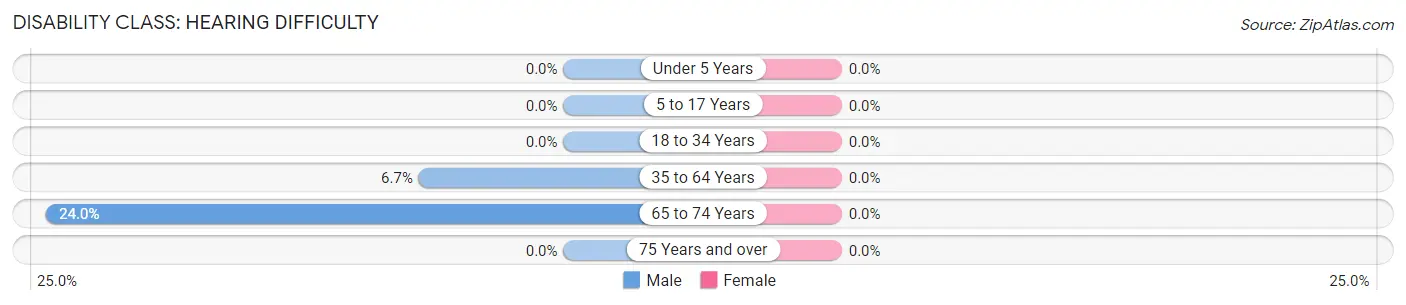
| Age Bracket | Male | Female |
| Under 5 Years | 0 (0.0%) | 0 (0.0%) |
| 5 to 17 Years | 0 (0.0%) | 0 (0.0%) |
| 18 to 34 Years | 0 (0.0%) | 0 (0.0%) |
| 35 to 64 Years | 32 (6.7%) | 0 (0.0%) |
| 65 to 74 Years | 18 (24.0%) | 0 (0.0%) |
| 75 Years and over | 0 (0.0%) | 0 (0.0%) |
Disability Class: Vision Difficulty
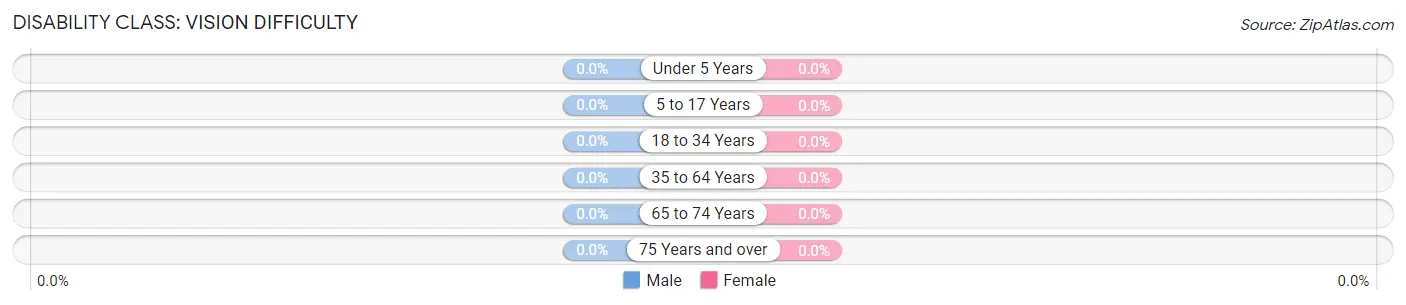
| Age Bracket | Male | Female |
| Under 5 Years | 0 (0.0%) | 0 (0.0%) |
| 5 to 17 Years | 0 (0.0%) | 0 (0.0%) |
| 18 to 34 Years | 0 (0.0%) | 0 (0.0%) |
| 35 to 64 Years | 0 (0.0%) | 0 (0.0%) |
| 65 to 74 Years | 0 (0.0%) | 0 (0.0%) |
| 75 Years and over | 0 (0.0%) | 0 (0.0%) |
Disability Class: Cognitive Difficulty
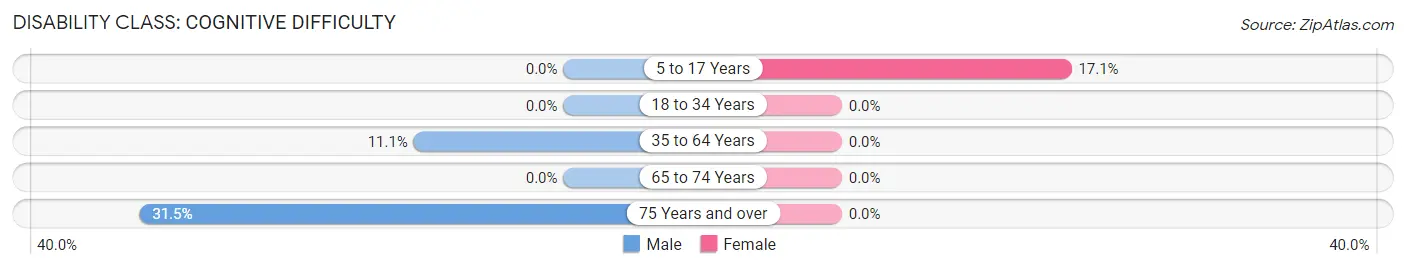
| Age Bracket | Male | Female |
| 5 to 17 Years | 0 (0.0%) | 15 (17.1%) |
| 18 to 34 Years | 0 (0.0%) | 0 (0.0%) |
| 35 to 64 Years | 53 (11.1%) | 0 (0.0%) |
| 65 to 74 Years | 0 (0.0%) | 0 (0.0%) |
| 75 Years and over | 17 (31.5%) | 0 (0.0%) |
Disability Class: Ambulatory Difficulty
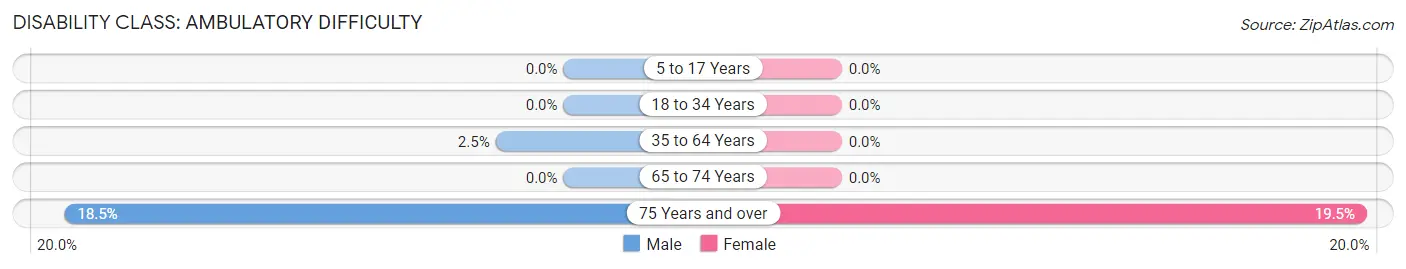
| Age Bracket | Male | Female |
| 5 to 17 Years | 0 (0.0%) | 0 (0.0%) |
| 18 to 34 Years | 0 (0.0%) | 0 (0.0%) |
| 35 to 64 Years | 12 (2.5%) | 0 (0.0%) |
| 65 to 74 Years | 0 (0.0%) | 0 (0.0%) |
| 75 Years and over | 10 (18.5%) | 23 (19.5%) |
Disability Class: Self-Care Difficulty
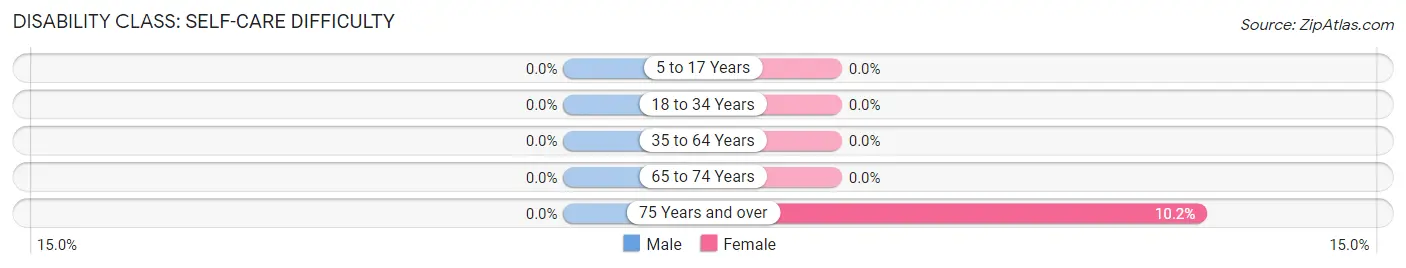
| Age Bracket | Male | Female |
| 5 to 17 Years | 0 (0.0%) | 0 (0.0%) |
| 18 to 34 Years | 0 (0.0%) | 0 (0.0%) |
| 35 to 64 Years | 0 (0.0%) | 0 (0.0%) |
| 65 to 74 Years | 0 (0.0%) | 0 (0.0%) |
| 75 Years and over | 0 (0.0%) | 12 (10.2%) |
Technology Access in Baldwinville
Computing Device Access in Baldwinville
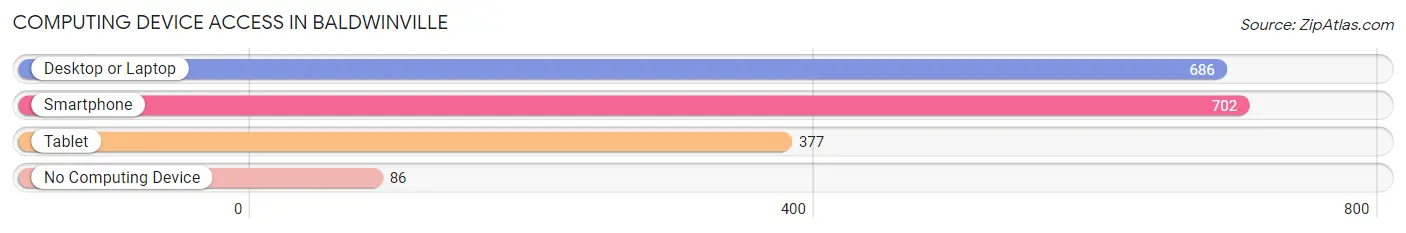
| Device Type | # Households | % Households |
| Desktop or Laptop | 686 | 85.6% |
| Smartphone | 702 | 87.6% |
| Tablet | 377 | 47.1% |
| No Computing Device | 86 | 10.7% |
| Total | 801 | 100.0% |
Internet Access in Baldwinville
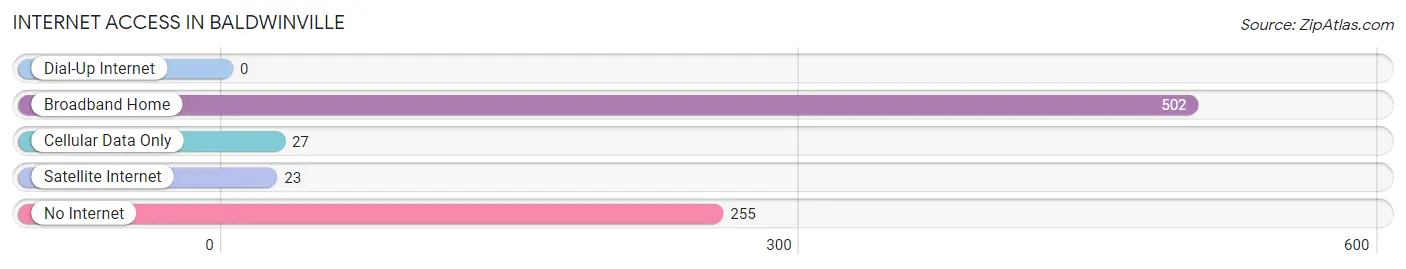
| Internet Type | # Households | % Households |
| Dial-Up Internet | 0 | 0.0% |
| Broadband Home | 502 | 62.7% |
| Cellular Data Only | 27 | 3.4% |
| Satellite Internet | 23 | 2.9% |
| No Internet | 255 | 31.8% |
| Total | 801 | 100.0% |
Baldwinville Summary
Baldwinville is a small village located in the town of Templeton, Massachusetts, in the United States. It is situated in the north-central part of the state, about 25 miles northwest of Worcester and 40 miles west of Boston. The village is located on the banks of the Quaboag River, which flows through the center of town.
History
The area that is now Baldwinville was first settled in 1735 by a group of settlers from nearby Lancaster. The village was originally known as “Baldwin’s Mills” after the first settler, John Baldwin. The village was incorporated in 1810 and was named after the Baldwin family.
In the 19th century, Baldwinville was a thriving industrial center, with several mills and factories located along the Quaboag River. The most prominent of these was the Baldwinville Paper Mill, which was established in 1845 and operated until the early 20th century. The mill was a major employer in the area, and its products were shipped all over the world.
In the late 19th century, Baldwinville was also home to a number of other industries, including a tannery, a shoe factory, a sawmill, and a gristmill. The village also had a number of stores, including a general store, a drug store, and a post office.
Geography
Baldwinville is located in north-central Massachusetts, about 25 miles northwest of Worcester and 40 miles west of Boston. The village is situated on the banks of the Quaboag River, which flows through the center of town. The village is surrounded by rolling hills and woodlands, and is located in the Quaboag Valley.
The village is located in the Quaboag River watershed, which is part of the larger Connecticut River watershed. The Quaboag River is a tributary of the Connecticut River, and is the largest river in the state of Massachusetts.
Economy
Baldwinville’s economy is largely based on agriculture and tourism. The village is home to several farms, which produce a variety of crops, including corn, hay, and apples. The village is also home to several wineries, which produce a variety of wines.
The village is also home to several small businesses, including a hardware store, a grocery store, and a restaurant. The village is also home to a number of bed and breakfasts, which attract tourists from all over the world.
Demographics
As of the 2010 census, the population of Baldwinville was 1,845. The racial makeup of the village was 97.3% White, 0.7% African American, 0.2% Native American, 0.3% Asian, 0.1% Pacific Islander, 0.3% from other races, and 1.2% from two or more races. Hispanic or Latino of any race were 1.2% of the population.
The median household income in Baldwinville was $50,938, and the median family income was $60,938. The per capita income for the village was $25,938. About 5.3% of families and 6.7% of the population were below the poverty line, including 8.3% of those under age 18 and 4.3% of those age 65 or over.
Common Questions
What is the Total Population of Baldwinville?
Total Population of Baldwinville is 2,286.
What is the Total Male Population of Baldwinville?
Total Male Population of Baldwinville is 1,396.
What is the Total Female Population of Baldwinville?
Total Female Population of Baldwinville is 890.
What is the Ratio of Males per 100 Females in Baldwinville?
There are 156.85 Males per 100 Females in Baldwinville.
What is the Ratio of Females per 100 Males in Baldwinville?
There are 63.75 Females per 100 Males in Baldwinville.
What is the Median Population Age in Baldwinville?
Median Population Age in Baldwinville is 32.8 Years.
What is the Average Family Size in Baldwinville
Average Family Size in Baldwinville is 3.3 People.
What is the Average Household Size in Baldwinville
Average Household Size in Baldwinville is 2.8 People.
What is Per Capita Income in Baldwinville?
Per Capita income in Baldwinville is $30,037.
What is the Median Family Income in Baldwinville?
Median Family Income in Baldwinville is $90,865.
What is Income or Wage Gap in Baldwinville?
Income or Wage Gap in Baldwinville is 37.4%.
Women in Baldwinville earn 62.6 cents for every dollar earned by a man.
What is Inequality or Gini Index in Baldwinville?
Inequality or Gini Index in Baldwinville is 0.38.
How Large is the Labor Force in Baldwinville?
There are 896 People in the Labor Forcein in Baldwinville.
What is the Percentage of People in the Labor Force in Baldwinville?
58.1% of People are in the Labor Force in Baldwinville.
What is the Unemployment Rate in Baldwinville?
Unemployment Rate in Baldwinville is 21.1%.