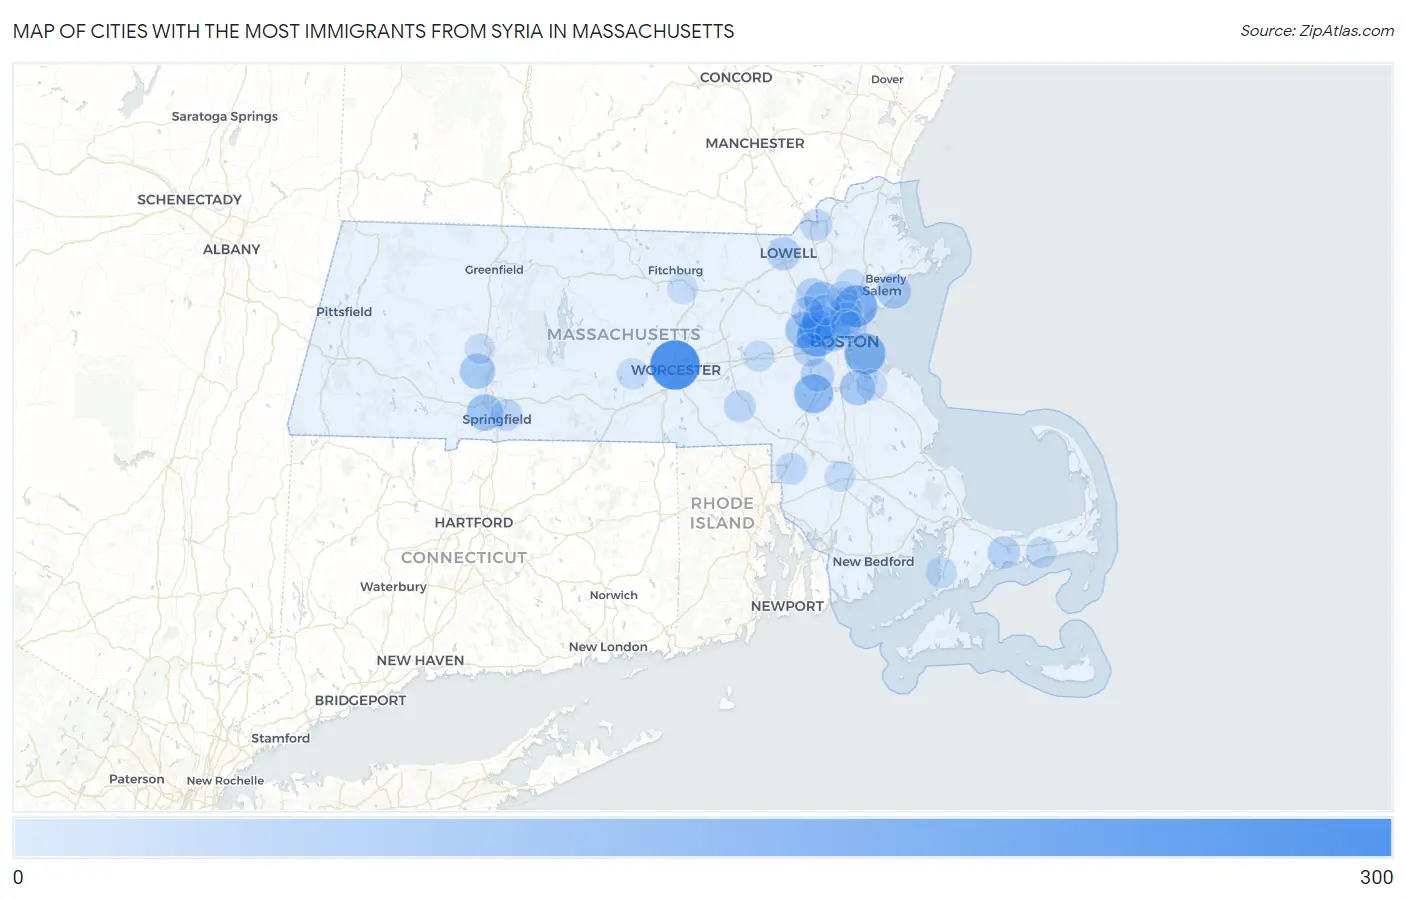
Cities with the Most Immigrants from Syria in Massachusetts
RELATED REPORTS & OPTIONS
Syria
Massachusetts
Compare Cities
Map of Cities with the Most Immigrants from Syria in Massachusetts
0
300
Cities with the Most Immigrants from Syria in Massachusetts
| City | Syria | vs State | vs National | |
| 1. | Worcester | 283 | 2,918(9.70%)#1 | 108,470(0.26%)#67 |
| 2. | Saugus | 168 | 2,918(5.76%)#2 | 108,470(0.15%)#127 |
| 3. | Boston | 156 | 2,918(5.35%)#3 | 108,470(0.14%)#141 |
| 4. | Watertown Town | 152 | 2,918(5.21%)#4 | 108,470(0.14%)#148 |
| 5. | Norwood | 127 | 2,918(4.35%)#5 | 108,470(0.12%)#173 |
| 6. | Belmont | 94 | 2,918(3.22%)#6 | 108,470(0.09%)#223 |
| 7. | Waltham | 91 | 2,918(3.12%)#7 | 108,470(0.08%)#229 |
| 8. | Woburn | 90 | 2,918(3.08%)#8 | 108,470(0.08%)#234 |
| 9. | West Springfield Town | 89 | 2,918(3.05%)#9 | 108,470(0.08%)#235 |
| 10. | Arlington | 84 | 2,918(2.88%)#10 | 108,470(0.08%)#245 |
| 11. | Braintree Town | 74 | 2,918(2.54%)#11 | 108,470(0.07%)#285 |
| 12. | Easthampton Town | 73 | 2,918(2.50%)#12 | 108,470(0.07%)#290 |
| 13. | Cambridge | 70 | 2,918(2.40%)#13 | 108,470(0.06%)#298 |
| 14. | Salem | 65 | 2,918(2.23%)#14 | 108,470(0.06%)#318 |
| 15. | North Attleborough | 49 | 2,918(1.68%)#15 | 108,470(0.05%)#376 |
| 16. | Burlington | 49 | 2,918(1.68%)#16 | 108,470(0.05%)#377 |
| 17. | Newton | 48 | 2,918(1.64%)#17 | 108,470(0.04%)#378 |
| 18. | Dedham | 46 | 2,918(1.58%)#18 | 108,470(0.04%)#394 |
| 19. | Lowell | 45 | 2,918(1.54%)#19 | 108,470(0.04%)#396 |
| 20. | Melrose | 37 | 2,918(1.27%)#20 | 108,470(0.03%)#459 |
| 21. | Barnstable Town | 36 | 2,918(1.23%)#21 | 108,470(0.03%)#468 |
| 22. | Malden | 35 | 2,918(1.20%)#22 | 108,470(0.03%)#479 |
| 23. | Lexington | 33 | 2,918(1.13%)#23 | 108,470(0.03%)#500 |
| 24. | Springfield | 27 | 2,918(0.93%)#24 | 108,470(0.02%)#553 |
| 25. | Milford | 27 | 2,918(0.93%)#25 | 108,470(0.02%)#556 |
| 26. | Methuen Town | 26 | 2,918(0.89%)#26 | 108,470(0.02%)#567 |
| 27. | Attleboro | 22 | 2,918(0.75%)#27 | 108,470(0.02%)#631 |
| 28. | Chelsea | 21 | 2,918(0.72%)#28 | 108,470(0.02%)#655 |
| 29. | Lynnfield | 21 | 2,918(0.72%)#29 | 108,470(0.02%)#659 |
| 30. | Spencer | 18 | 2,918(0.62%)#30 | 108,470(0.02%)#713 |
| 31. | West Falmouth | 18 | 2,918(0.62%)#31 | 108,470(0.02%)#715 |
| 32. | Weymouth Town | 16 | 2,918(0.55%)#32 | 108,470(0.01%)#749 |
| 33. | South Yarmouth | 15 | 2,918(0.51%)#33 | 108,470(0.01%)#785 |
| 34. | Framingham | 14 | 2,918(0.48%)#34 | 108,470(0.01%)#796 |
| 35. | Taunton | 12 | 2,918(0.41%)#35 | 108,470(0.01%)#844 |
| 36. | Leominster | 11 | 2,918(0.38%)#36 | 108,470(0.01%)#868 |
| 37. | Winchester | 10 | 2,918(0.34%)#37 | 108,470(0.01%)#897 |
| 38. | Wakefield | 9 | 2,918(0.31%)#38 | 108,470(0.01%)#930 |
| 39. | Everett | 8 | 2,918(0.27%)#39 | 108,470(0.01%)#956 |
| 40. | Northampton | 6 | 2,918(0.21%)#40 | 108,470(0.01%)#1,006 |
Common Questions
What are the Top 10 Cities with the Most Immigrants from Syria in Massachusetts?
Top 10 Cities with the Most Immigrants from Syria in Massachusetts are:
#1
283
#2
168
#3
156
#4
152
#5
127
#6
94
#7
91
#8
90
#9
89
#10
84
What city has the Most Immigrants from Syria in Massachusetts?
Worcester has the Most Immigrants from Syria in Massachusetts with 283.
What is the Total Immigrants from Syria in the State of Massachusetts?
Total Immigrants from Syria in Massachusetts is 2,918.
What is the Total Immigrants from Syria in the United States?
Total Immigrants from Syria in the United States is 108,470.