Cities with the Most Immigrants from Oceania in Massachusetts
RELATED REPORTS & OPTIONS
Oceania
Massachusetts
Compare Cities
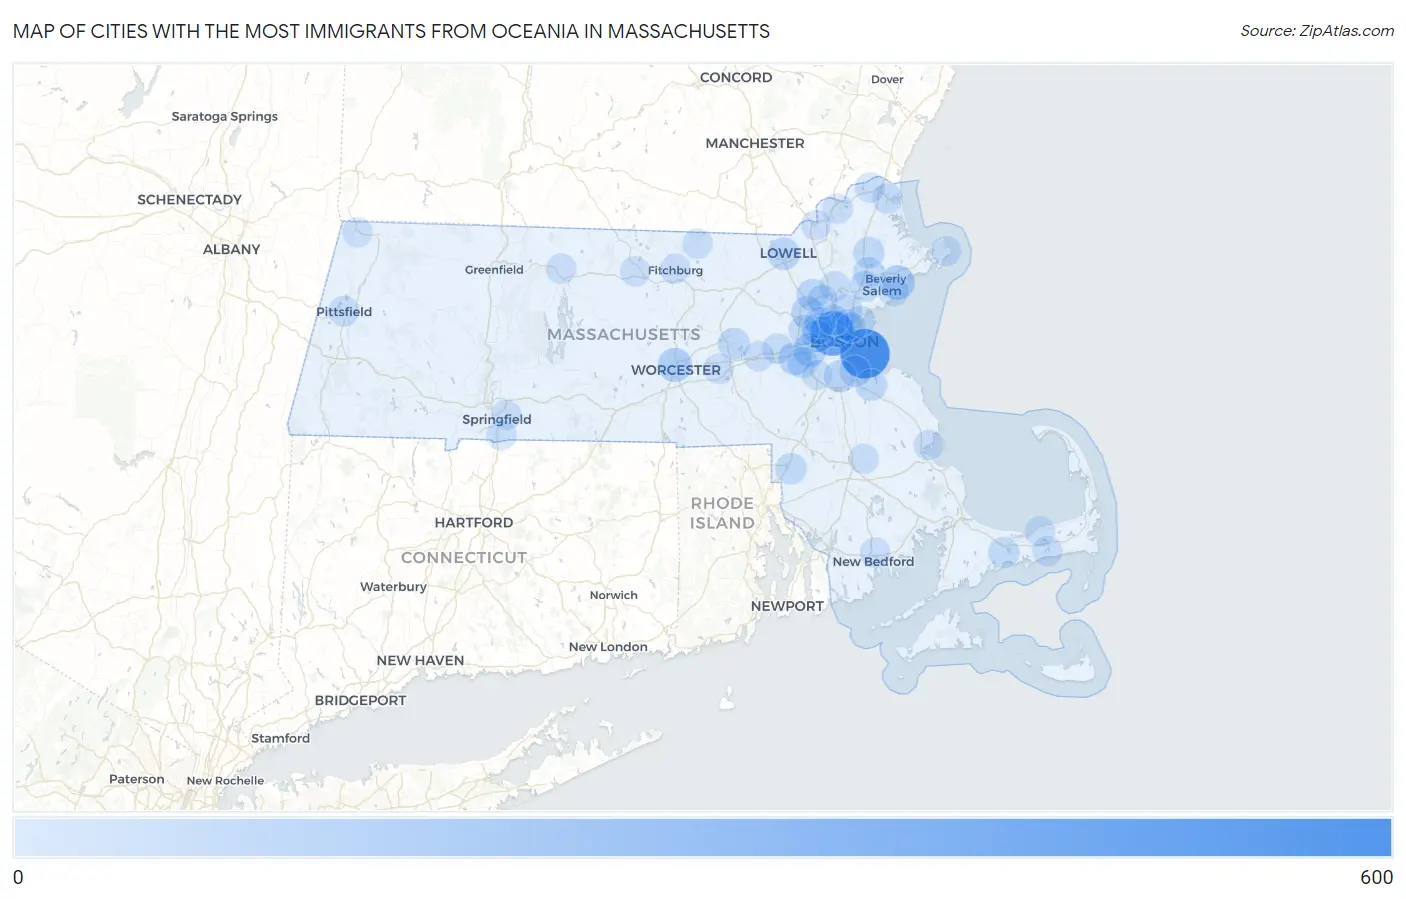
Map of Cities with the Most Immigrants from Oceania in Massachusetts
0
600
Cities with the Most Immigrants from Oceania in Massachusetts
| City | Oceania | vs State | vs National | |
| 1. | Boston | 573 | 4,002(14.32%)#1 | 293,459(0.20%)#62 |
| 2. | Cambridge | 408 | 4,002(10.19%)#2 | 293,459(0.14%)#99 |
| 3. | Somerville | 185 | 4,002(4.62%)#3 | 293,459(0.06%)#264 |
| 4. | Beverly | 126 | 4,002(3.15%)#4 | 293,459(0.04%)#393 |
| 5. | Worcester | 112 | 4,002(2.80%)#5 | 293,459(0.04%)#427 |
| 6. | Newton | 101 | 4,002(2.52%)#6 | 293,459(0.03%)#473 |
| 7. | Wellesley | 85 | 4,002(2.12%)#7 | 293,459(0.03%)#555 |
| 8. | Lexington | 73 | 4,002(1.82%)#8 | 293,459(0.02%)#611 |
| 9. | Lowell | 68 | 4,002(1.70%)#9 | 293,459(0.02%)#643 |
| 10. | Burlington | 64 | 4,002(1.60%)#10 | 293,459(0.02%)#686 |
| 11. | Milton | 61 | 4,002(1.52%)#11 | 293,459(0.02%)#711 |
| 12. | Watertown Town | 58 | 4,002(1.45%)#12 | 293,459(0.02%)#748 |
| 13. | Weymouth Town | 51 | 4,002(1.27%)#13 | 293,459(0.02%)#813 |
| 14. | Quincy | 48 | 4,002(1.20%)#14 | 293,459(0.02%)#848 |
| 15. | Marlborough | 48 | 4,002(1.20%)#15 | 293,459(0.02%)#850 |
| 16. | Melrose | 47 | 4,002(1.17%)#16 | 293,459(0.02%)#860 |
| 17. | Everett | 43 | 4,002(1.07%)#17 | 293,459(0.01%)#914 |
| 18. | Amherst | 42 | 4,002(1.05%)#18 | 293,459(0.01%)#935 |
| 19. | Attleboro | 39 | 4,002(0.97%)#19 | 293,459(0.01%)#983 |
| 20. | Topsfield | 37 | 4,002(0.92%)#20 | 293,459(0.01%)#1,034 |
| 21. | Belmont | 36 | 4,002(0.90%)#21 | 293,459(0.01%)#1,041 |
| 22. | Barnstable Town | 35 | 4,002(0.87%)#22 | 293,459(0.01%)#1,059 |
| 23. | Danvers | 35 | 4,002(0.87%)#23 | 293,459(0.01%)#1,061 |
| 24. | Needham | 34 | 4,002(0.85%)#24 | 293,459(0.01%)#1,080 |
| 25. | Peabody | 33 | 4,002(0.82%)#25 | 293,459(0.01%)#1,103 |
| 26. | Revere | 32 | 4,002(0.80%)#26 | 293,459(0.01%)#1,129 |
| 27. | Arlington | 32 | 4,002(0.80%)#27 | 293,459(0.01%)#1,130 |
| 28. | Medford | 28 | 4,002(0.70%)#28 | 293,459(0.01%)#1,230 |
| 29. | Pittsfield | 20 | 4,002(0.50%)#29 | 293,459(0.01%)#1,523 |
| 30. | Reading | 19 | 4,002(0.47%)#30 | 293,459(0.01%)#1,574 |
| 31. | Waltham | 18 | 4,002(0.45%)#31 | 293,459(0.01%)#1,613 |
| 32. | Cochituate | 18 | 4,002(0.45%)#32 | 293,459(0.01%)#1,652 |
| 33. | Woburn | 16 | 4,002(0.40%)#33 | 293,459(0.01%)#1,729 |
| 34. | Newburyport | 16 | 4,002(0.40%)#34 | 293,459(0.01%)#1,746 |
| 35. | Framingham | 14 | 4,002(0.35%)#35 | 293,459(0.00%)#1,854 |
| 36. | Haverhill | 14 | 4,002(0.35%)#36 | 293,459(0.00%)#1,857 |
| 37. | Westborough | 14 | 4,002(0.35%)#37 | 293,459(0.00%)#1,900 |
| 38. | Orange | 14 | 4,002(0.35%)#38 | 293,459(0.00%)#1,902 |
| 39. | Gardner | 13 | 4,002(0.32%)#39 | 293,459(0.00%)#1,944 |
| 40. | Amesbury Town | 13 | 4,002(0.32%)#40 | 293,459(0.00%)#1,949 |
| 41. | Dennis | 13 | 4,002(0.32%)#41 | 293,459(0.00%)#1,994 |
| 42. | Salem | 12 | 4,002(0.30%)#42 | 293,459(0.00%)#2,014 |
| 43. | South Duxbury | 12 | 4,002(0.30%)#43 | 293,459(0.00%)#2,064 |
| 44. | Dedham | 10 | 4,002(0.25%)#44 | 293,459(0.00%)#2,202 |
| 45. | Greenfield | 10 | 4,002(0.25%)#45 | 293,459(0.00%)#2,213 |
| 46. | Longmeadow | 10 | 4,002(0.25%)#46 | 293,459(0.00%)#2,215 |
| 47. | West Dennis | 10 | 4,002(0.25%)#47 | 293,459(0.00%)#2,253 |
| 48. | New Bedford | 9 | 4,002(0.22%)#48 | 293,459(0.00%)#2,268 |
| 49. | Chelsea | 8 | 4,002(0.20%)#49 | 293,459(0.00%)#2,387 |
| 50. | Methuen Town | 7 | 4,002(0.17%)#50 | 293,459(0.00%)#2,485 |
| 51. | Fitchburg | 7 | 4,002(0.17%)#51 | 293,459(0.00%)#2,490 |
| 52. | Rockport | 7 | 4,002(0.17%)#52 | 293,459(0.00%)#2,544 |
| 53. | Springfield | 6 | 4,002(0.15%)#53 | 293,459(0.00%)#2,590 |
| 54. | Bridgewater Town | 6 | 4,002(0.15%)#54 | 293,459(0.00%)#2,604 |
| 55. | Townsend | 6 | 4,002(0.15%)#55 | 293,459(0.00%)#2,688 |
| 56. | Williamstown | 3 | 4,002(0.07%)#56 | 293,459(0.00%)#2,941 |
Common Questions
What are the Top 10 Cities with the Most Immigrants from Oceania in Massachusetts?
Top 10 Cities with the Most Immigrants from Oceania in Massachusetts are:
#1
573
#2
408
#3
185
#4
126
#5
112
#6
101
#7
85
#8
73
#9
68
#10
64
What city has the Most Immigrants from Oceania in Massachusetts?
Boston has the Most Immigrants from Oceania in Massachusetts with 573.
What is the Total Immigrants from Oceania in the State of Massachusetts?
Total Immigrants from Oceania in Massachusetts is 4,002.
What is the Total Immigrants from Oceania in the United States?
Total Immigrants from Oceania in the United States is 293,459.